- AllllSevens
- Posts
- AllllSevens FREE Newsletter 9/05/23
Disclaimer
All information presented in this newsletter are my personal opinions & for speculation purposes only. It is not intended to be interpreted as financial or investment advice.
I talk in certainties that do not exist; the market is often be random and uncertain, especially in the short-term.
Please be aware of the risks involved with the stock market and do your own due-diligence before buying and selling securities.
$SPY
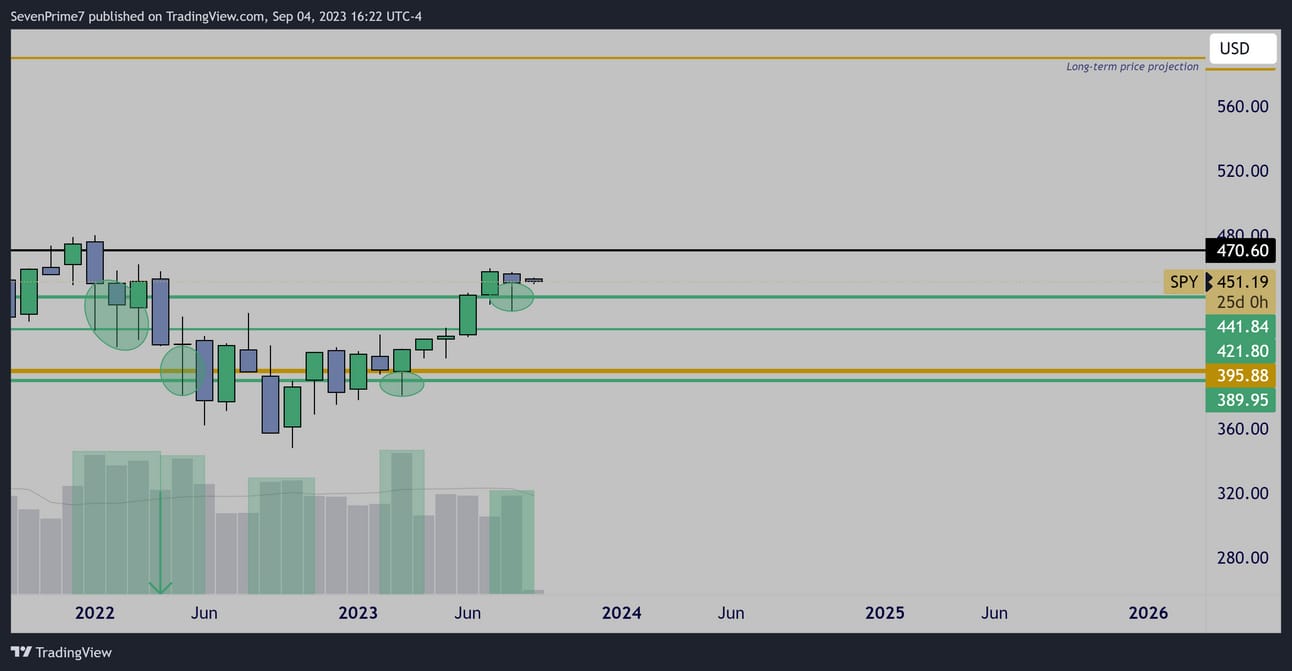
Monthly
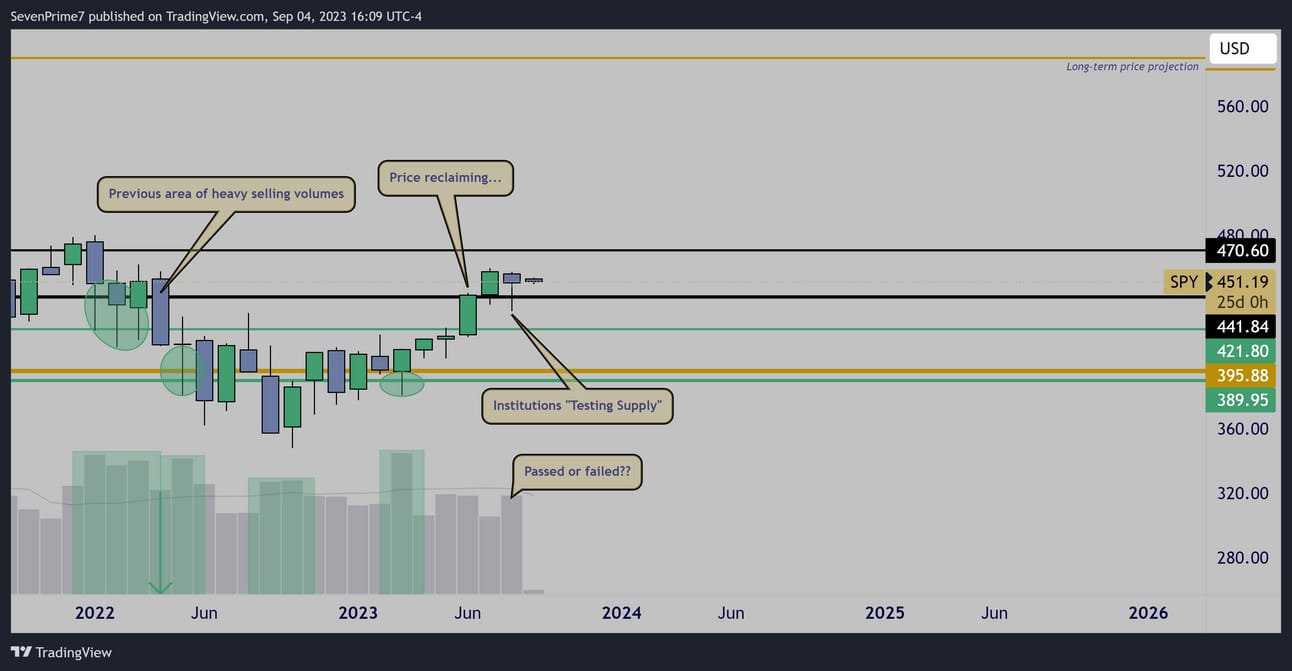
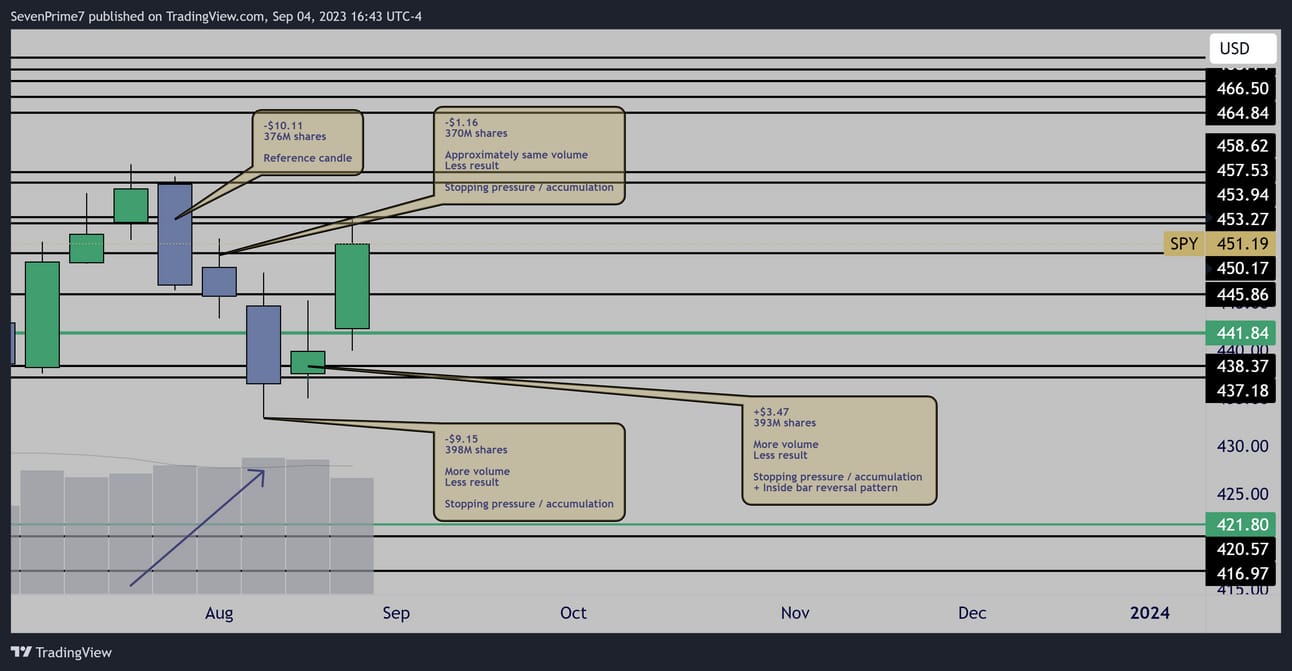
Institutional accumulation @ $389.95-$395.88, $421.80, & $441.84
Very significant candle formation this past month…
Monthly (Heikin Ashi)
Current trend / price-momentum favors upside.
$464.84 is the next major resistance.
$441.84 is key to be held or momentum could potentially shift.
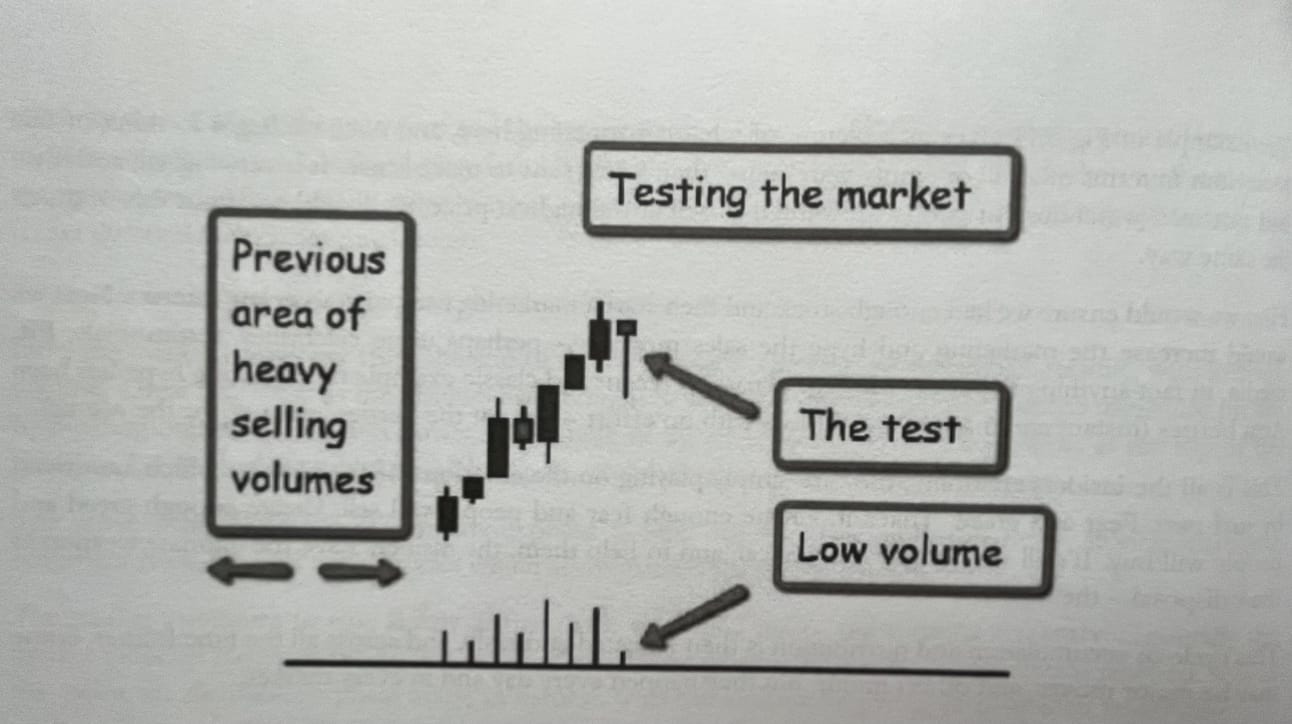
Test of Supply
Volume Price Analysis
Anna Coulling
So we know that institutions are accumulating the $SPY
This is very obvious and I have been talking about it for months.
However, we can also clearly see that price is in somewhat of a box.
When the market is being accumulated, it is typically accompanied by sideways price movement until a Test of Supply is ran and passed…
A test of supply is what institutions do to ensure that they have absorbed all the retail sell pressure in the market, and they can now easily mark prices higher and ignite a prolonged bull-run.
They do not want to push price out of the accumulation range if they are going to be met by retail sell-pressure rather than willful buyers.
They test supply by pushing price into an area of previous sell pressure ($440-$450) where they then drop bad news…
Fitch US Debt downgrade in our situation.
This sparks retail panic.
If high volume selling returns to the market, then it has failed the test of supply and institutions will need to mark prices lower in order to accumulate more.
If volume remains low, then that means the last of the retail sell pressure has been absorbed and the market is ready to move aggressively higher.
August’s candle looks like a textbook Test of Supply candle pattern…
Did the market pass?
Is price about to break range and enter a prolonged bull market?
Or did we fail?
Is price going to fall downwards and be accumulated more?
Monthly
A passed test of supply is supposed to leave the following;
Small candle body- Check
Large lower wick- Check
Low volume- Check?
While the candle’s volume is below average, it is increasing relative to the previous candle. This does make me question the pattern a bit.
I want to say that there’s no doubt we passed and price is ready to launch
I’d also love to say there’s no doubt we clearly failed and price needs to go lower…
The reality is this is a probabilistic pattern and nothing is for sure…
I’m not here to be a prophet, I’m here to make a profit, and if I’m being honest I do see the argument for and against this being a passed test of supply.
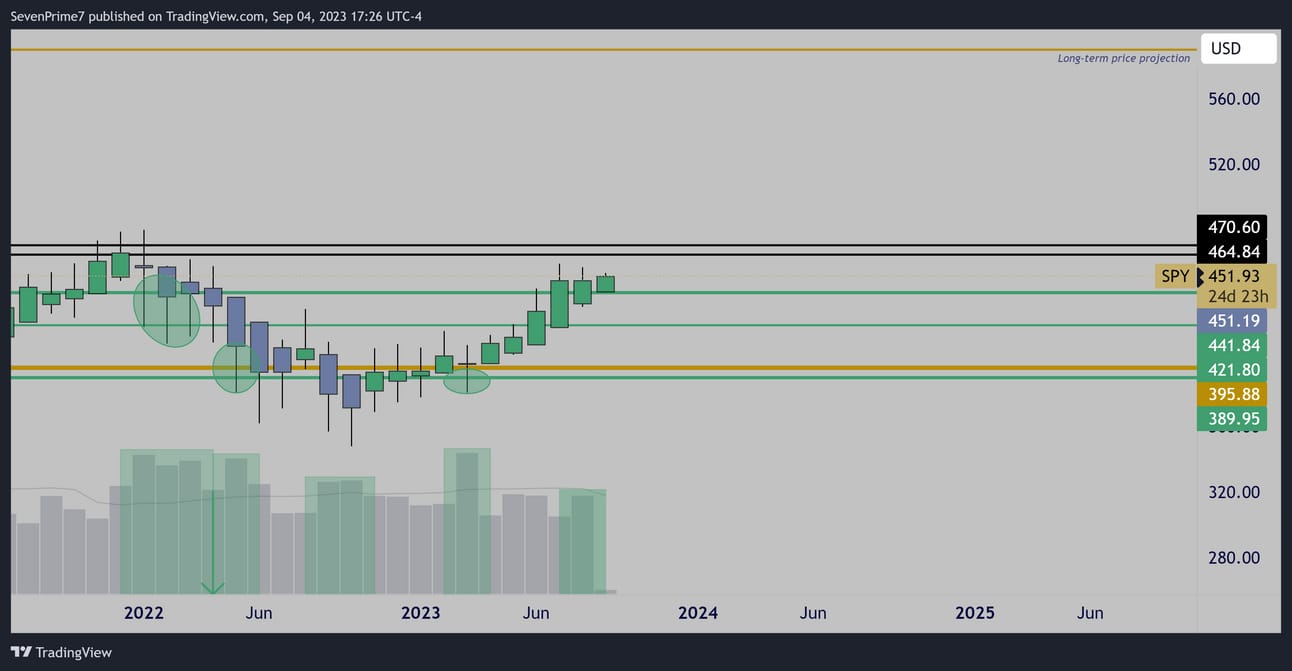
Weekly
We know institutions are still actively accumulating at these prices.
The weekly chart the past few weeks showed constant stopping pressure and accumulation- which I wrote about multiple times.
It was no surprise that price reversed and erased most of the sell-off by months end.
Let’s talk about THIS week’s candle. Any signal?
Not really.
It’s the lowest volume in 7 weeks.
Not typically a candle I open new positions from.
I don’t see it as a bearish anomaly because volume priced this in for the last 4 weeks. This move didn’t necessarily need to be backed by volume because the volume supplying this move occurred beforehand.
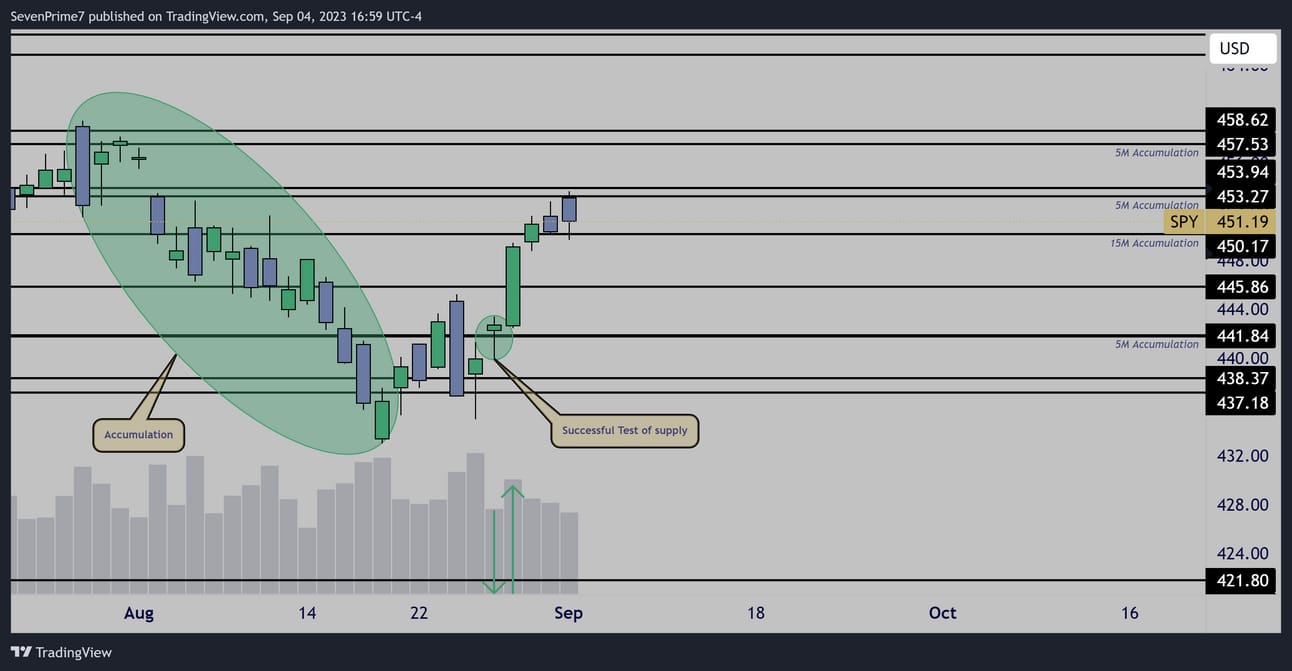
Daily
Here’s an example of a successful test of supply that ignited last weeks rally. I went in heavy detail how this daily chart was bullish and being accumulated in a newsletter a few weeks back, https://twitter.com/AllllSevens/status/1690849811203784704?s=20
The Test of Supply candle pattern was a perfect long entry.
It is possible we’re seeing this same pattern about to play out on a monthly time frame…
Unusual Options Flow
An absolutely insane full risk bullish order that makes me want to slam the table on longs…

$540M 10/6 Bullish
Conclusion-
I am pretty positive that the SPY has just passed a Test of Supply and the bull market is ready to begin…
My first target is $464.84
At the same time, I do see the potential for this to be a failed test and I have a plan.
If price closes below $441.84, my longs will immediately be stopped and I'll need to reevaluate the situation to potentially go short targeting 8/18 lows and potentially lower. If this scenario happens, I will update on twitter and again in next weeks newsletter!
$AMZN
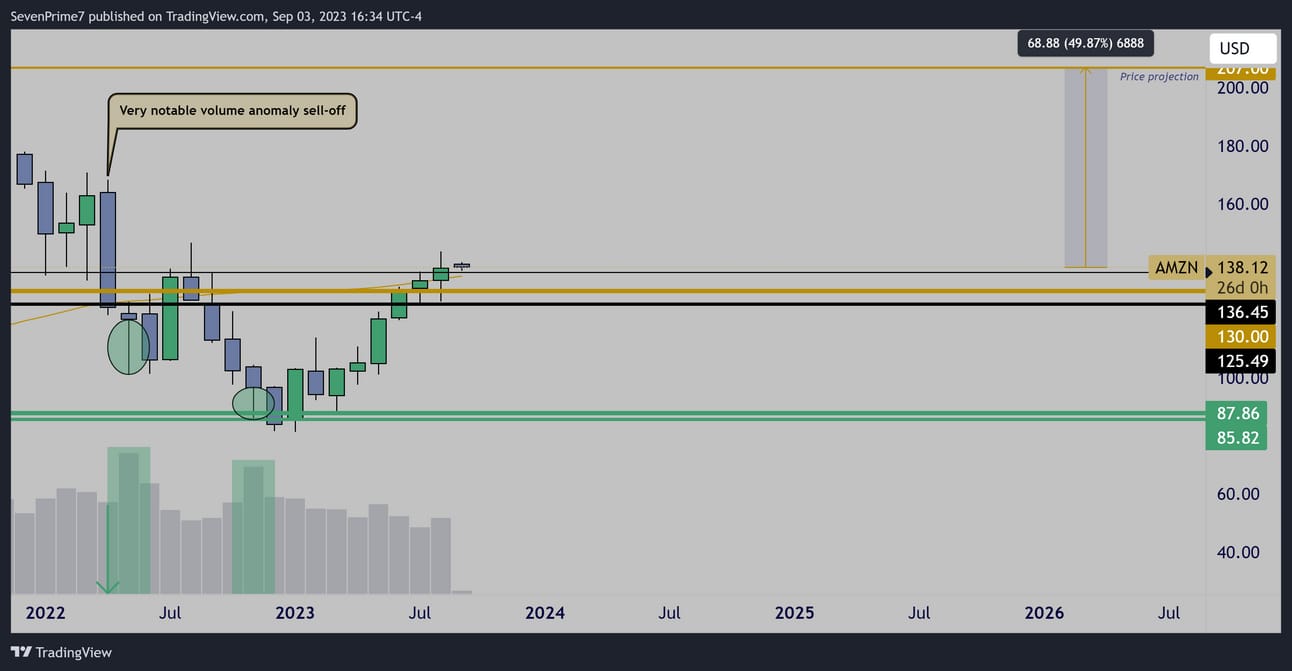
Monthly
Institutional accumulation @ $85.82-$87.86
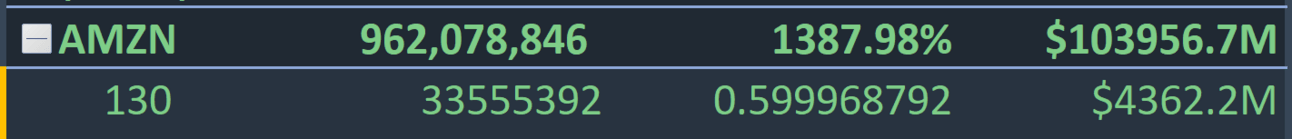
7/21 Dark Pool Transaction
$130.00
33.5M Shares
$4.36B
The sentiment behind this dark pool transaction is unknown-
It could be a massive buy, or it could be a massive sell.
All I know is the $125-$130 area is a price level of extremely concentrated institutional volume so it should act as a strong support/resistance in the future, potentially for institutions to accumulate more shares from. Only time can tell.
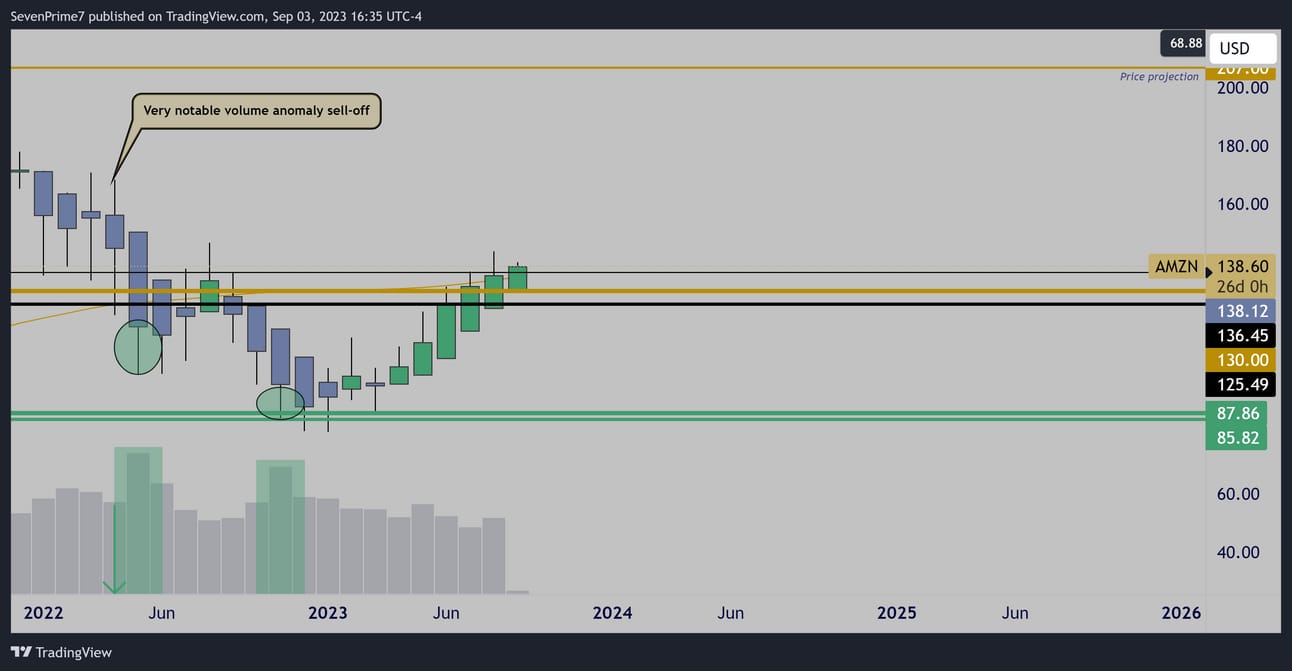
Monthly (Heikin Ashi)
Bulls holding momentum on this break over $130 so far.
Unusual Options Flow

$250M 11/17 Bullish

$42M 11/17 Bullish
Conclusion-
Institutional money is in for the long-term.
Notably at levels much lower.
I’m currently looking for potential for short-term continuation into November expirations as long as $125-$130 is held.
$INTC
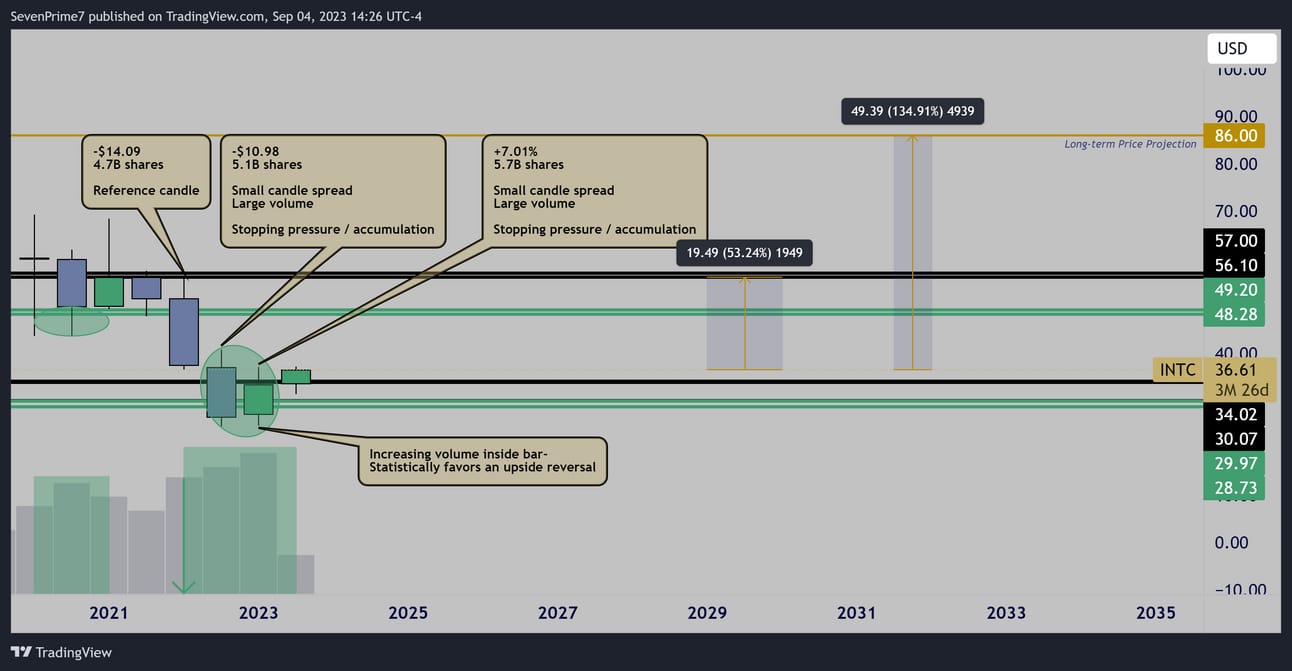
6 Month
Institutional accumulation @ $38.73-$29.97 & $48.28-$49.20
Upside reversal pattern.
Unusual Options Flow

$8.8M 1/19/24 Bullish

$2.6M 10/20 Bullish
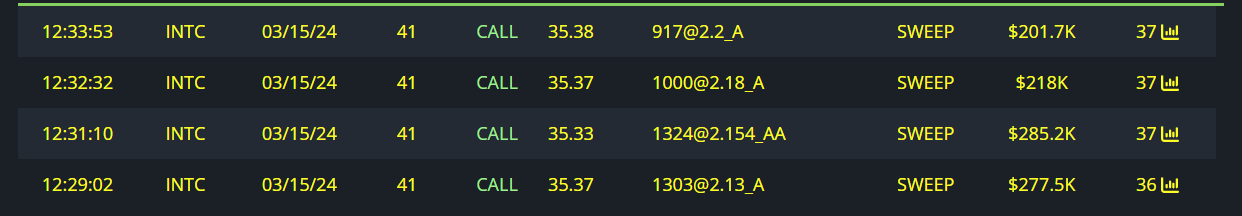
$1M 3/15/24 Bullish

$540K 9/8 Bullish

$150K 9/8 Bullish

$100K 9/15 Bullish
Conclusion-
Institutional money is in for the long-term.
Short-term we are seeing potential for this 6 month candle to continue expanding towards the high $40’s
$ARKK
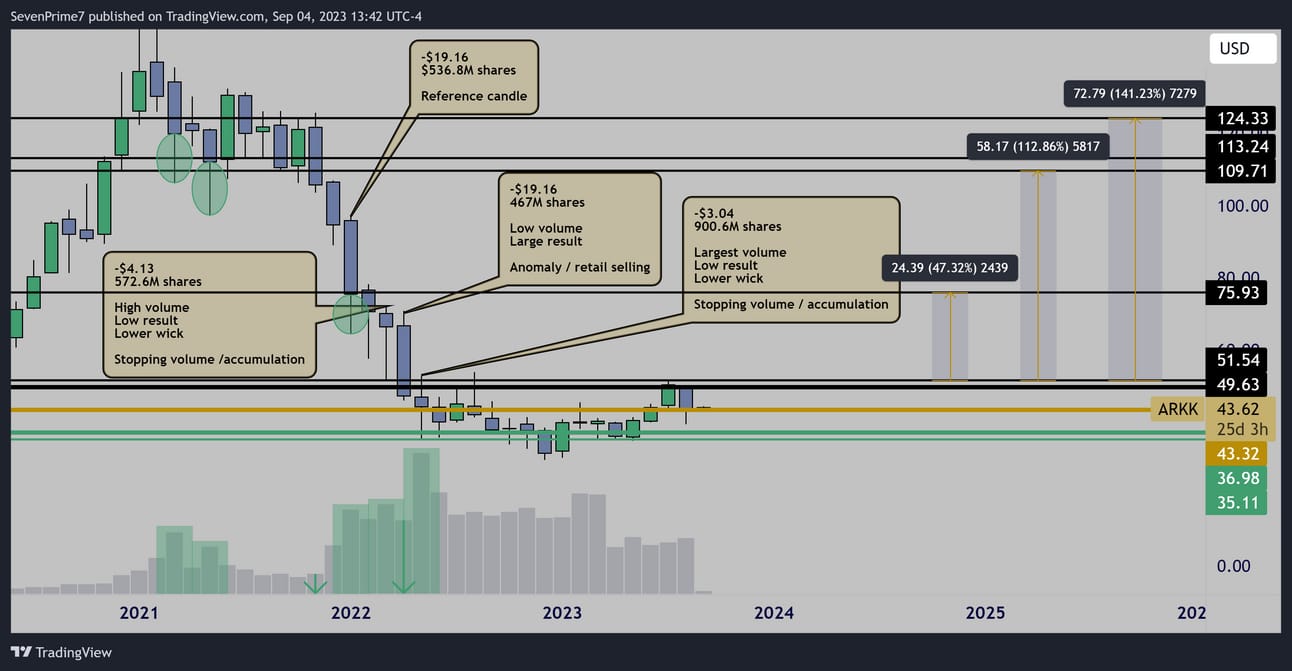
Monthly
Clear stopping volume / accumulation patterns on the $75.93 sell-off.
Institutional accumulation @ $35.11-$36.98 & $109.71
Unusual Options Flow

$1.8M 12/1825 Bullish

$500K 12/15 Bullish

$300K 6/21/24 Bullish

$70K 9/29 Bullish
Conclusion-
It’s very clear institutional money is positioned for long-term upside.
I would like to do the same.
Buying shares I’d be willing to hold for 10+ years is my current plan.
Price is currently stuck in a base, forming higher lows over the past few months, unable to break to the upside.
Over $51.54 range opens up big-time.
For me to get aggressive with short-term adds and/or call options I want to see that breakout and/or a an A+ weekly or monthly candle for entry.
Unfortunately right now I am not seeing that.
I will update when I do!
After this email is sent out, I send a premium newsletter as well!
This includes analysis on 6 more stocks this week.
Plus, get access to my Discord where I organize and update every idea I’ve ever posted. Keeping track of the newsletters can be a bit of a hassle. In discord it’s much easier to know my current thoughts on anything I’ve previously mentioned.
It’s $7.77 per month! Upgrade with this link below.
https://allllsevensnewsletter.beehiiv.com/upgrade
BlackBoxStocks
The Ultimate Tool For Traders
Dark Pool
Options Platform
Stocks Platform
Proprietary Indicators
Live Community & Members Chat
Education Program Courses
Mobile App
News
I collect all my Unusual Options Flow and dark pools through BBS
BlackBoxStocks offers a 20% discount to first time members!
Use my referral link >http://staygreen.blackboxstocks.com/SHMs
BBS also offers a military discount!
See in detail what all BBS has to offer by reading this guide linked just below!
https://docs.blackboxstocks.com
Reply