- AllllSevens
- Posts
- AllllSevens Weekly Newsletter 10/30/23
Disclaimer
All information presented in this newsletter are my personal opinions & for speculation purposes only.
Nothing is intended to be interpreted as financial or investment advice.
I present the market through the lens of an institutional trader/investor.
I use two tools to do this:
-Dark Pools
Large institutional transactions that create price levels of highly concentrated volume. Highly concentrated volume at specific prices create strong support & resistance- Institutional support & resistance.
-Volume Price Analysis
Analyzing the relationship between candle spreads/wicks & volume to determine institutional accumulation or distribution.
VPA also validates or invalidates institutional participation in trend.
SPY
First, let’s discuss why the bear market of 2022 occurred.
The entire event was orchestrated by institutions.
This will also introduce you to some key VPA concepts-
The market moves in cycles. It is efficient overtime.
Accumulation or distribution occurs…
Price moves against it, creating imbalances that will inevitably be rebalanced. This is where a high quality edge is created.
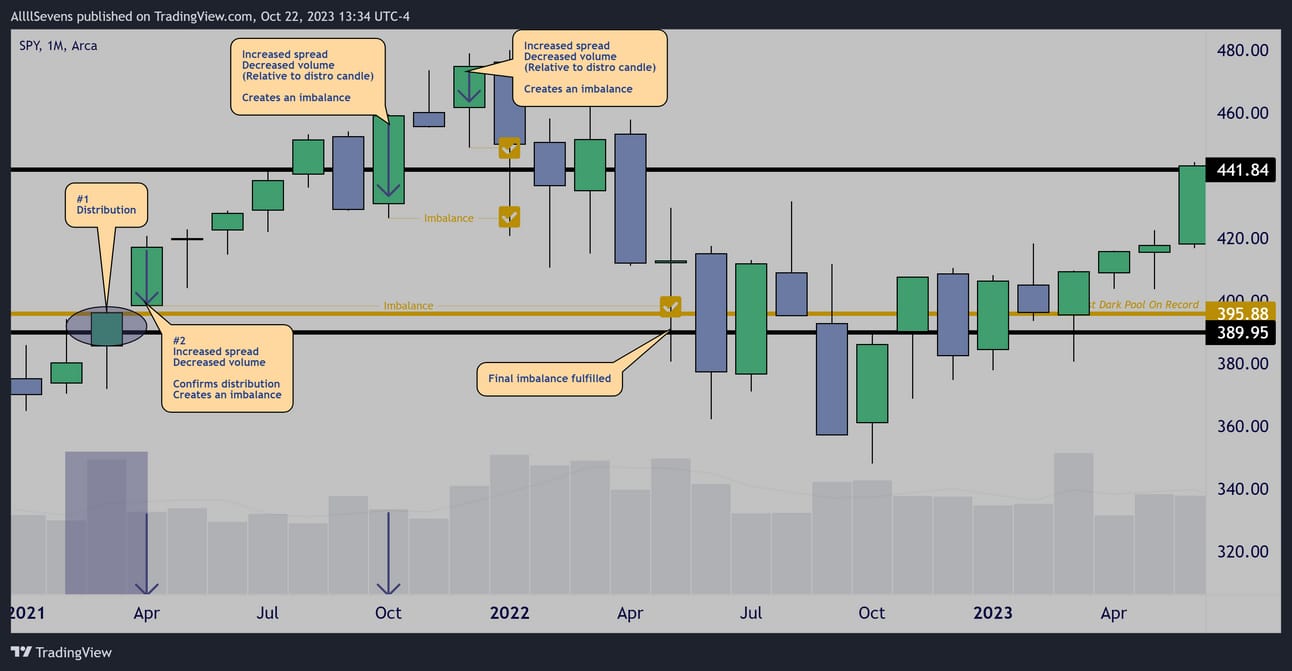
2021 Distribution & 2022 Rebalance
#1
March 2021 was a distribution candle.
Such large volume in a clear uptrend should have produced a massive candle spread (candle body) to the upside… It did not.
Institutions sold out.
#2
The following candle was an increased spread with decreased volume;
Confirming institutions sold out of the market and retail participants continues pushing prices higher, created imbalances on the way up.
As price continues to rise, two more imbalances are created before price eventually reverses and fully rebalances.
What was the point of this sequence? Why did institutions sell out?
2022 Rebalance, Re-Accumulation & Rebalance
The purpose of the 2021 distribution was to “trap” retail participants and
create liquidity/supply that would allow them to re-accumulate massive amounts of shares- More than they distributed.
When all the FOMO buyers from 2021 started to sell out in 2022, this created the ideal environment for institutions to start re-purchasing the shares they distributed AND some.
Perfectly orchestrated!
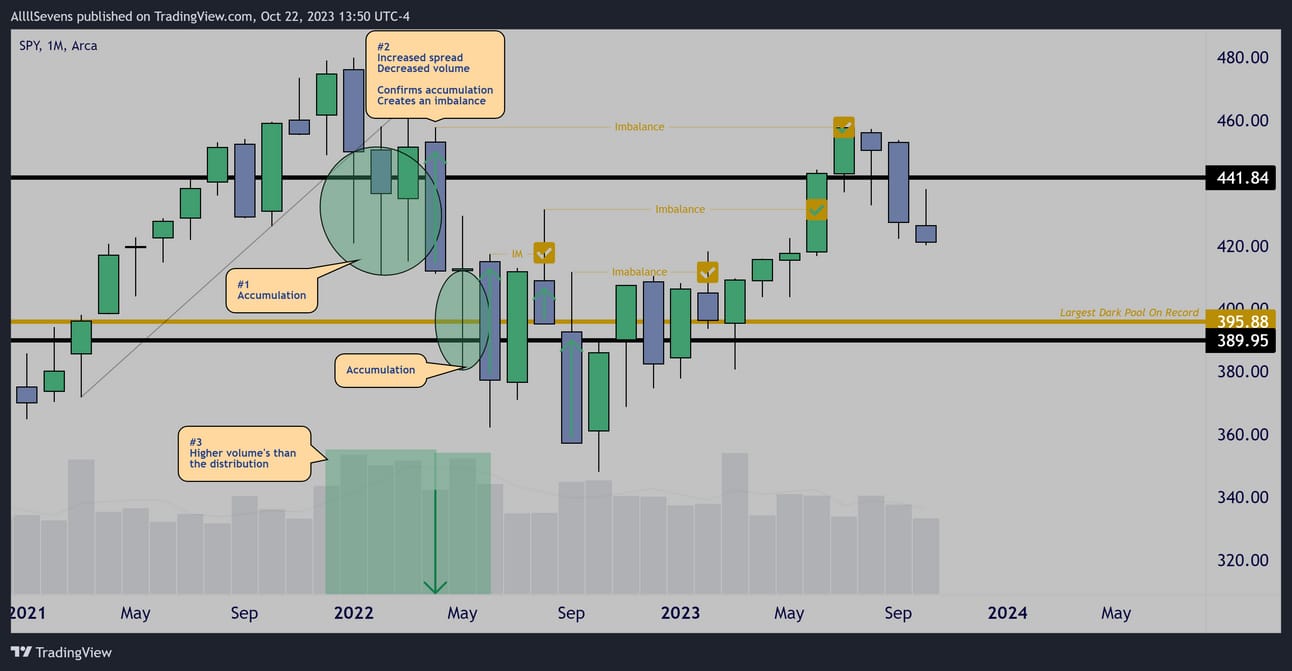
#1
As soon as price broke trend and an overwhelming amount of panic hit the market, institutions began absorbing shares (re-accumulating)
Visible by the extremely high volume candles with large lower wicks.
#2
Following the accumulation, much like during the distribution;
An increased spread candle with decreased volume pushed price down, confirming the accumulation, showing us that retail participants are driving prices lower, not institutions.
This creates an imbalance for later rebalancing.
Another large accumulation takes place, and three more imbalances are created relative to this candle.
#3
You’ll notice the volume during this accumulation is higher than the distribution from 2021, confirming that this was a RE-accumulation and the end-goal was to become net-long the market.
So, now you should have an understanding of how this all works.
Where does the market need to rebalance to now?
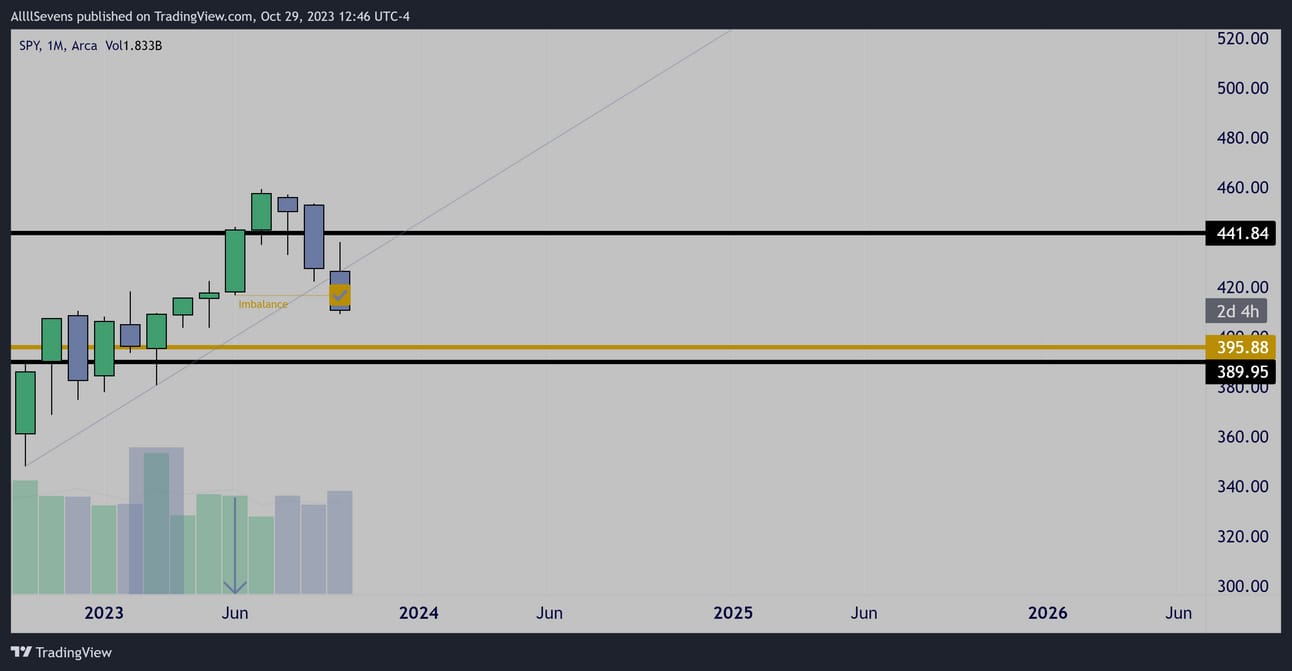
Distribution, Imbalance, Rebalance
The same exact pattern as 2021 has repeated itself.
Institutions sold out in March, propping the market up potentially for the same re-accumulation sequence to repeat itself.
For now, there is no direction to play on a monthly time frame.
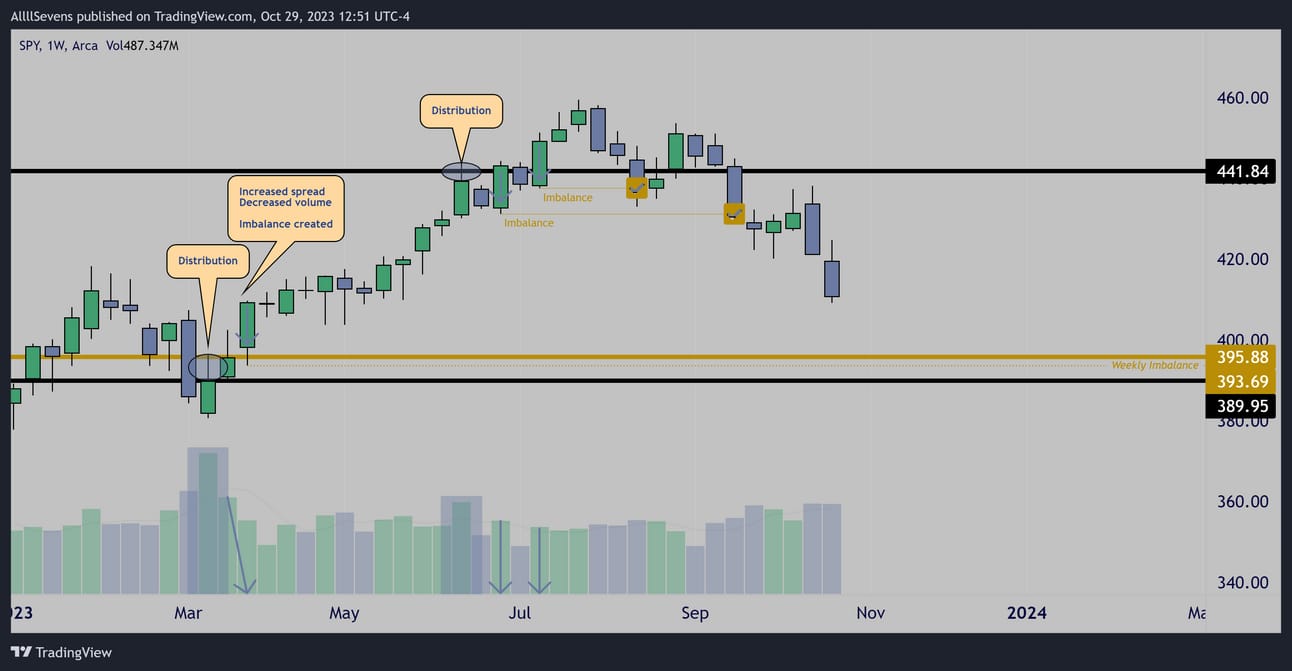
Distribution & Imbalance’s
On the weekly time frame you can see the March distribution more clear-
You can also see a lower imbalance was created at $393.69
You can also see why the market topped out where it did.
At the next large dark pool level, more distribution occurred and new imbalances were created.
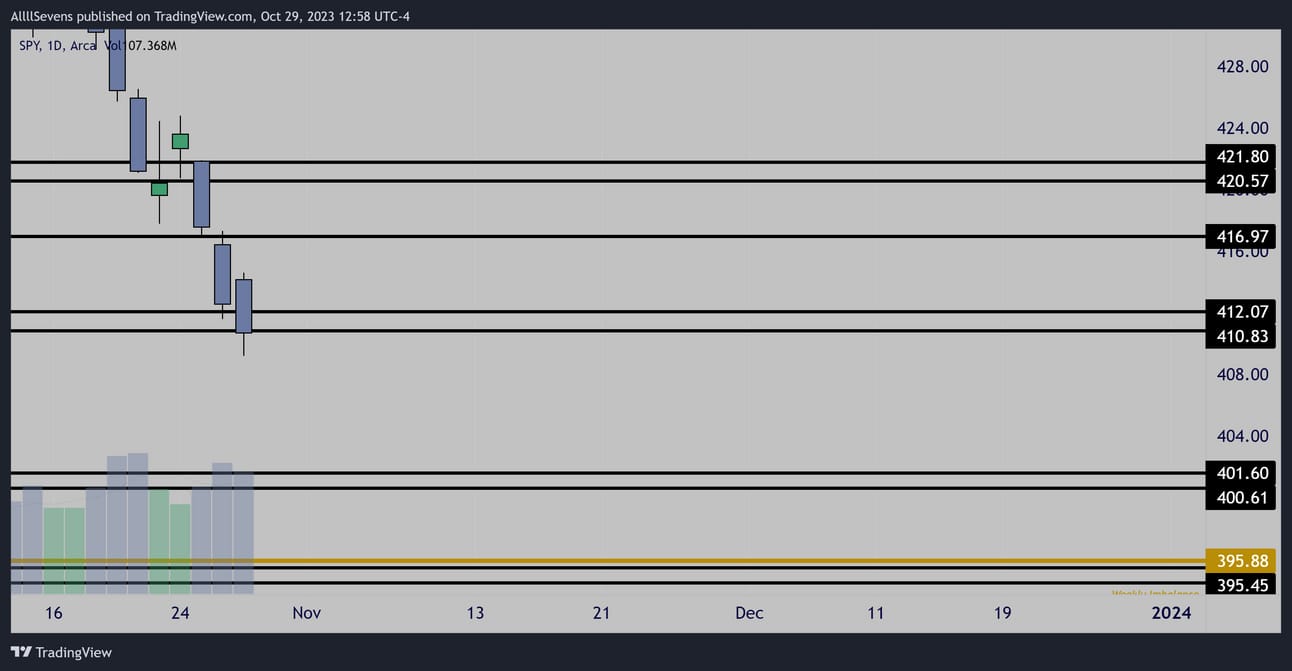
Daily Levels
Last daily support before downside range really opens up.
Conclusion
The market wants to go down.
The weekly imbalance at $393.96 is my focus.
Unfortunately, entering heavily short here is a bad risk-to-reward.
The best entry short would be as close to $441.84 as possible.
Unless that setup occurs, I am a day trader in this environment-
Open to both long and short trades.
Unusual Options Flow
-$162M Bearish Flows
+$441M Bullish Flows
11/01 -2.56M
11/03 -3.75M
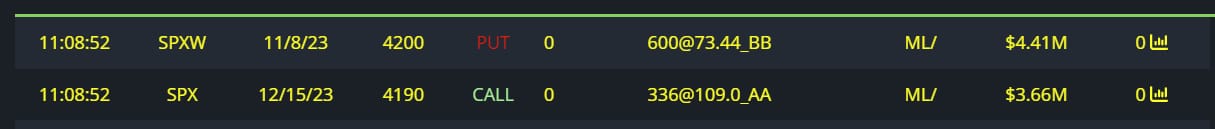
11/08 -9.34M
11/14 -1.62M
11/15 +2.78M
11/17 -5.89M
11/22 -7.91M
11/24 -1.95M
11/27 -95.06M
11/28 -22M
11/30 11.8M
12/01 -1.87M
12/07 +68.16M
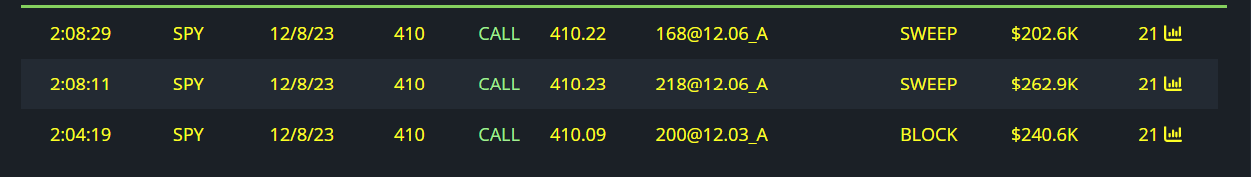
12/08 +110.14M
1/19/24 +5.32M
2/16/24 +28.29M
2/29/24 -9.75M
3/15/24 +3.77M
11/15/24 +95.27M
12/17/27 +47.93M
12/17/28 +67.86M
Short-term flow is definitely leaning bearish-
Bulls don’t step in until late November, early December
And of course the large 2027-2028 leaps
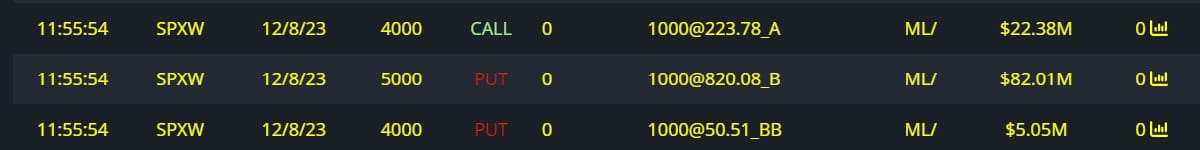
$109.44M Full Risk Bull 12/08
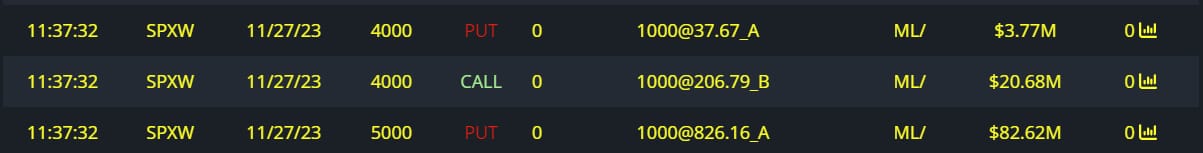
$107.07M Full Risk Bear 11/27

$100M Full Risk Bull 11/15/24
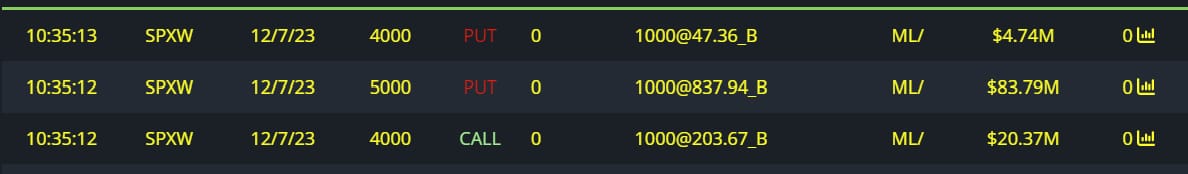
$68.16M Bullish Premium Collection 12/07
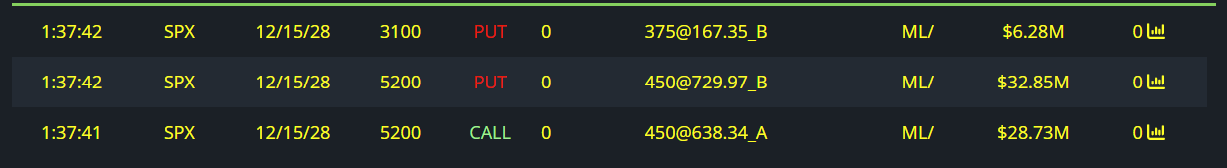
$67.86M Full Risk Bull 12/15/28

$47.93M Full Risk Bull 12/17/27

$35M Full Risk Bear 11/28

$28.29M Full Risk Bull 2/16/24-12/20/24

$13M Full Risk Bull 11/28

$12M Full Risk Bear 11/08
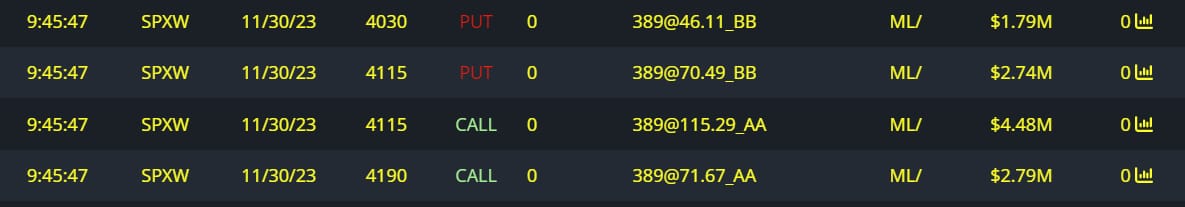
$11.8M Full Risk Bull 11/30

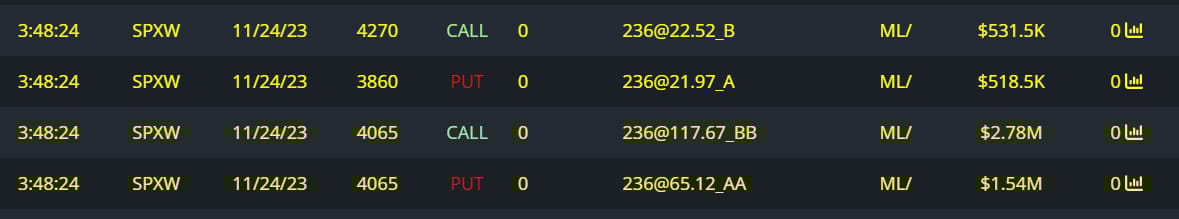
$7.11M Full Risk Bear 11/22

$5.32M Full Risk Bull 1/19/24

$2.78M Full Risk Bull 11/15-12/15

$1.87M Full Risk Bear 12/01

$1.6M Full Risk Bull 11/27

$1.62M Full Risk Bear 11/14

$1.45M Full Risk Bull 11/24
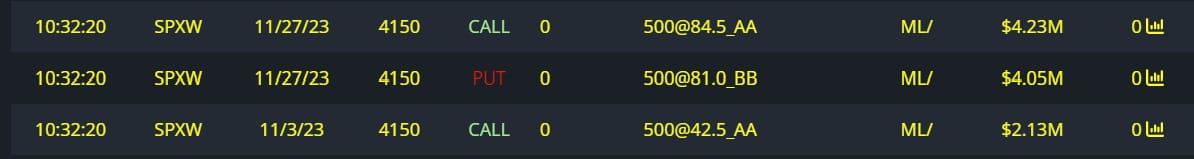
$10.41M Full Risk Bull 11/03-11/27

$9.75M Full Risk Bear 2/29/24
$8.07M Full Risk Bull

$5.89M Full Risk Bear 11/17
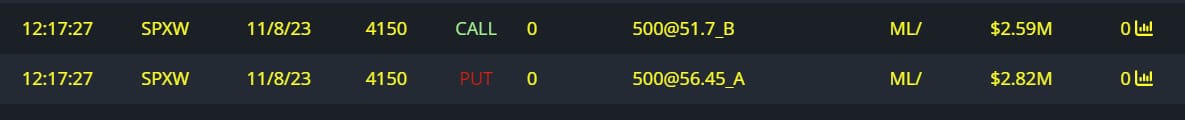
$5.41M Full Risk Bear 11/08
$5.37M Full Risk Bear 11/24

$4.73M Full Risk Bear 11/15/24

$4.63M Full Risk Bear 11/03-12/15

$3.77M Full Risk Bull 3/15/24

$2.56M Full Risk Bear 11/01-12/15
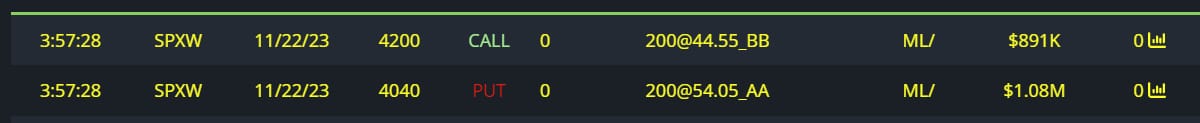
$1.97M Full Risk Bear 11/22

$1.95M Calls Bought
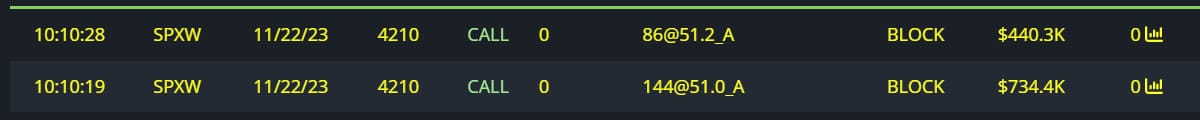
$1.17M Calls Bought
$878K Calls Bought
$700K Calls Bought
QQQ
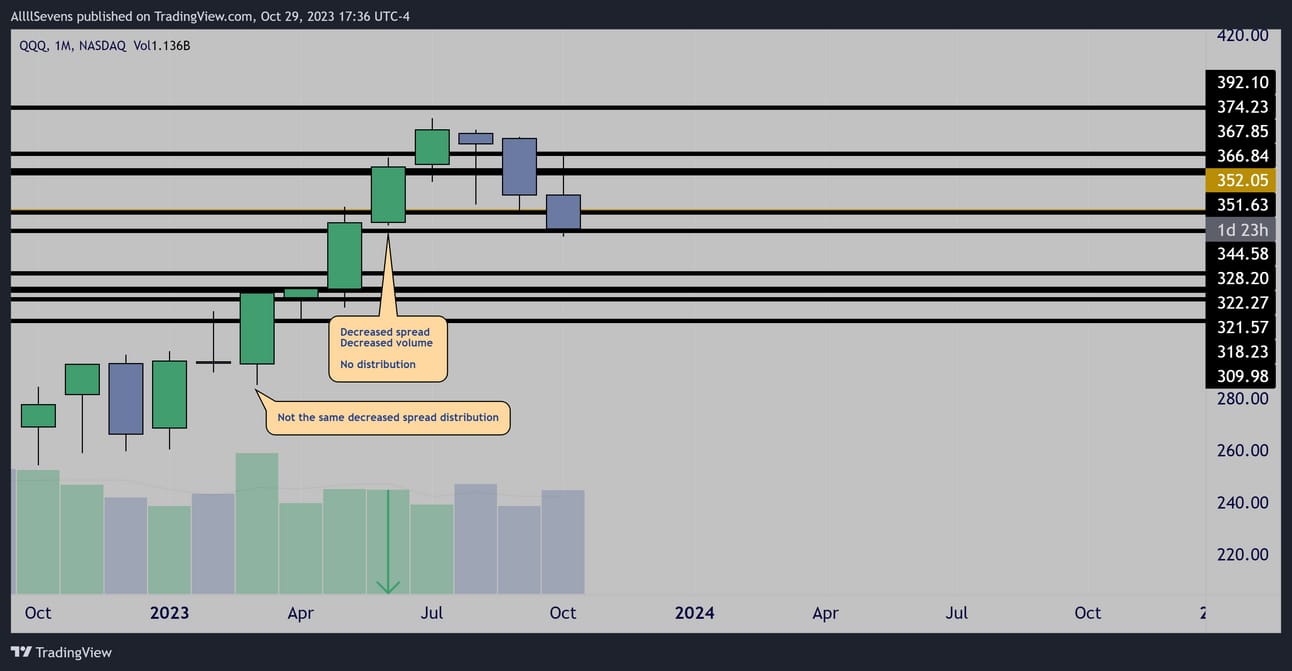
QQQ monthly does not share the same distribution patterns as the SPY
QQQ weekly does not show the same distribution in march…
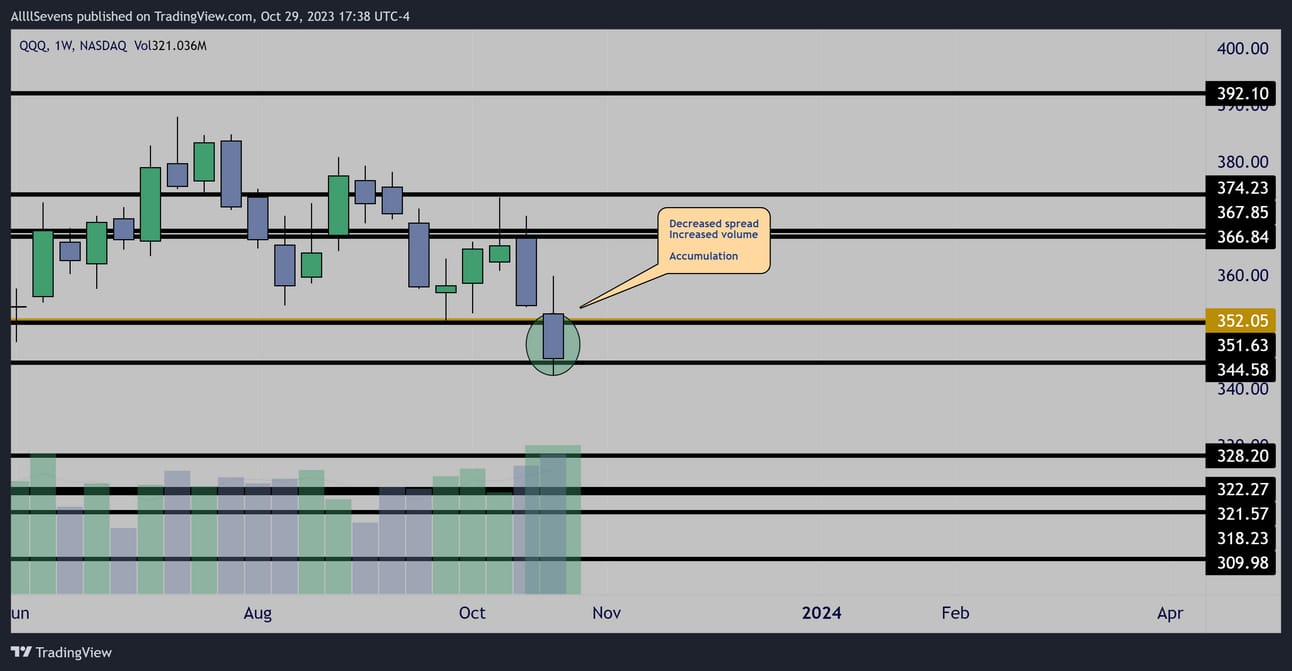
This past weeks candle notably shows buyers stepping in, unlike the SPY
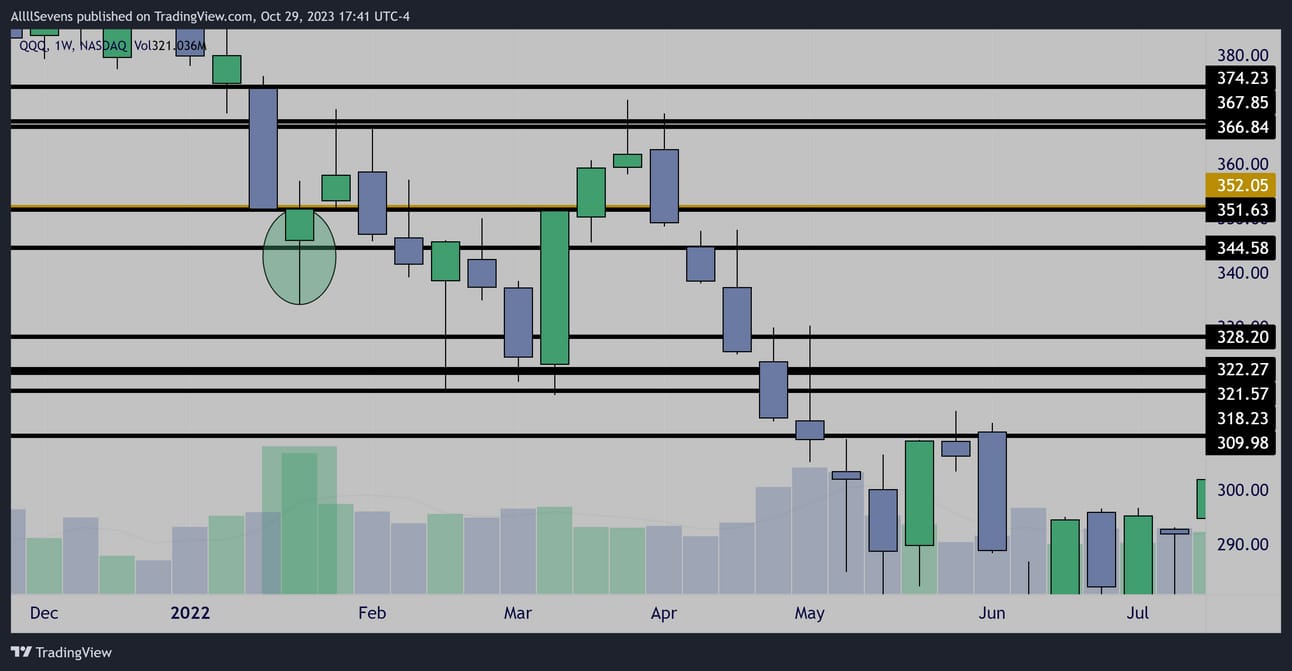
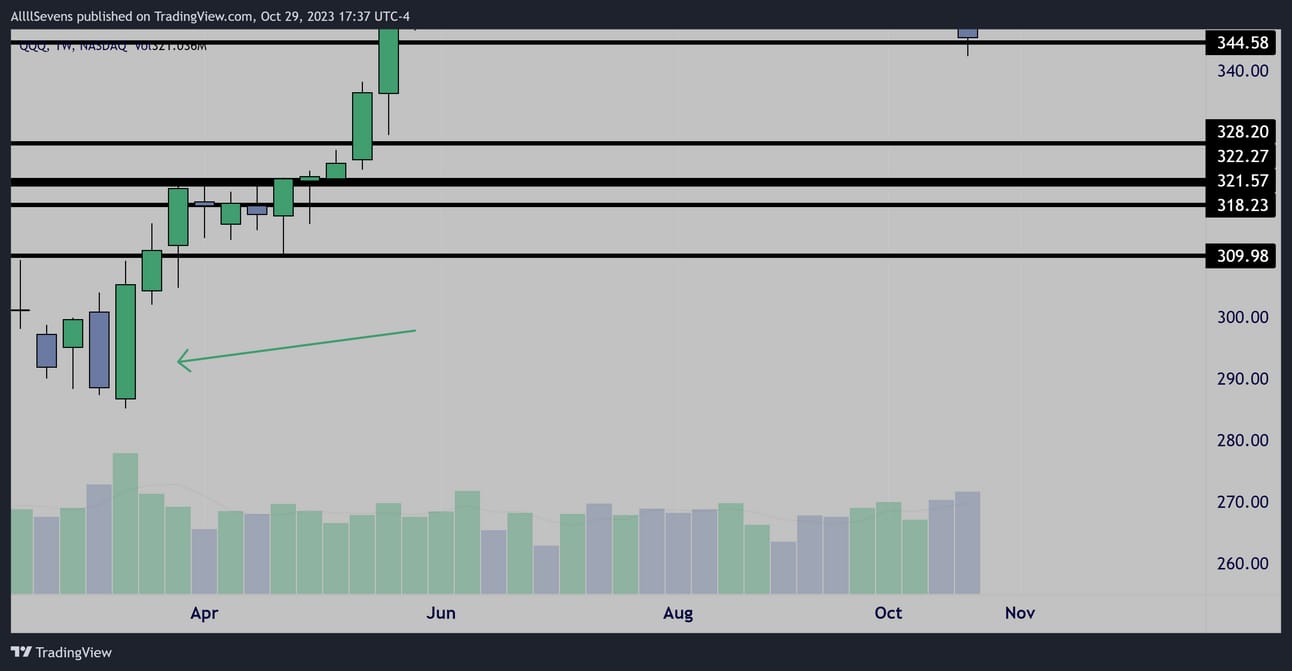
Weekly Accumulation
Back in January of 2022 QQQ saw it’s largest volume in over ten years on an accumulation candle in this same area of dark pool support.
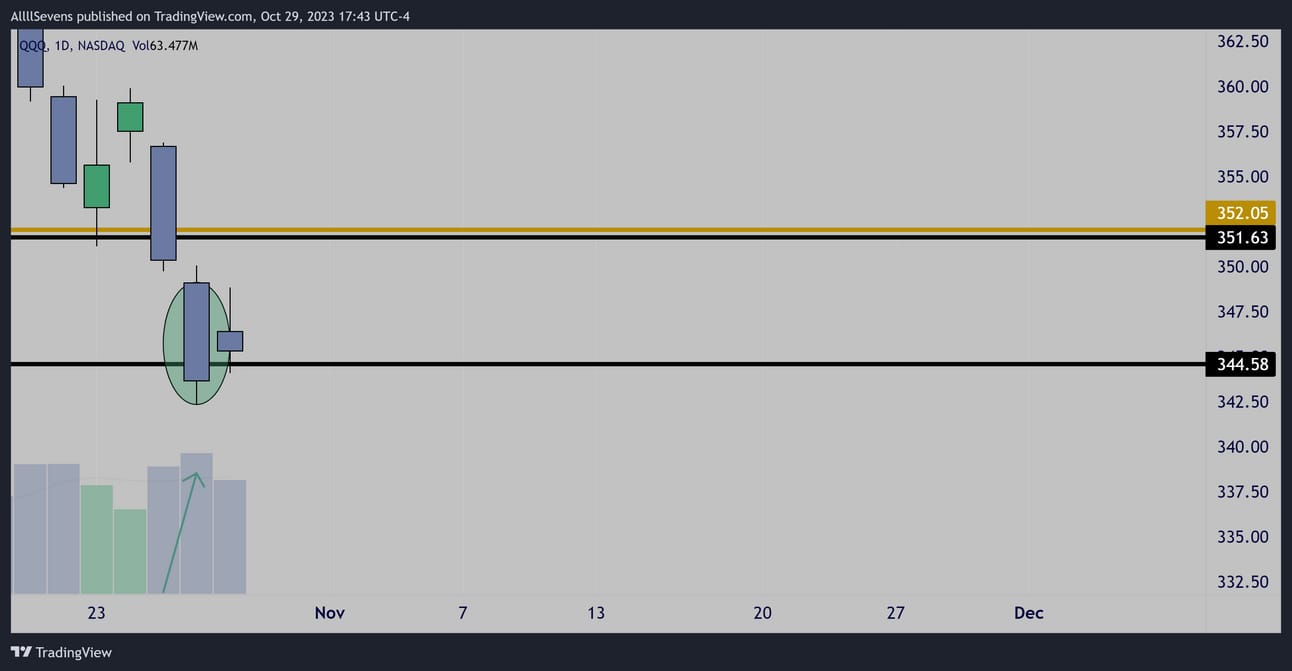
Daily
Daily inside bar on low volume.
Volume says this is a bullish consolidation.
Trend says this is a bearish consolidation…
Conclusion
One thing is certain-
QQQ is relatively stronger than the SPY
We have big news this week-
FOMC on Wednesday
AAPL earnings the next day after close.
Bears want to see SPY remain below support
Bulls want to see QQQ hold support and SPY reclaim support.
Unusual Options Flow
Some longer dated bulls similar to the SPY
And shorter dated bears similar to the SPY
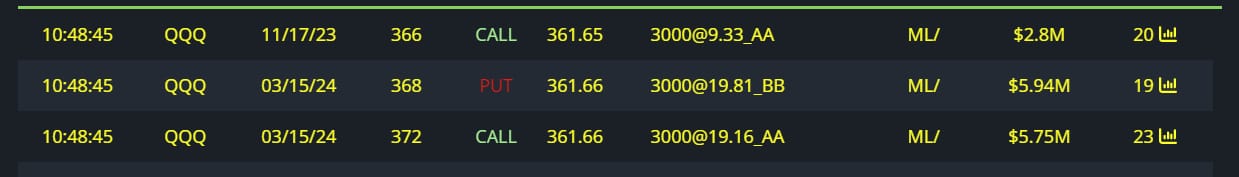
$14.5M Full Risk Bull 3/15/24

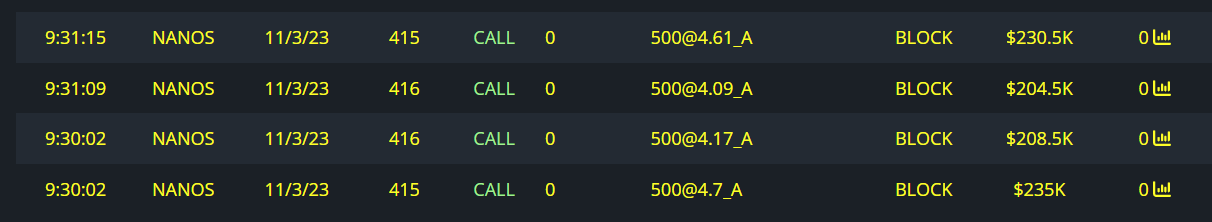
$3M Bearish Put Spread 11/03

$1.6M Bullish Call Spread 1/19/24
AllllSevens+
I offer a premium version of this newsletter where I cover individual stocks and not just indices!
I also have a Discord where I organize and consistently update my analysis on EVERYTHING everyday, every week.
If you like my work and you want more of it / want to support me this is the way to do it! Would love to see you sign up!
It’s only $7.77 per month.
https://allllsevensnewsletter.beehiiv.com/upgrade
BlackBoxStocks
The Ultimate Tool For Traders
Dark Pool
Options Platform
Stocks Platform
Proprietary Indicators
Live Community & Members Chat
Education Program Courses
Mobile App
News
I collect all my Unusual Options Flow and dark pools through BBS
BlackBoxStocks offers a 20% discount to first time members!
Use my referral link >http://staygreen.blackboxstocks.com/SHMs
BBS also offers a military discount!
See in detail what all BBS has to offer by reading this guide linked just below!
https://docs.blackboxstocks.com
Trading View Referral
https://t.co/1khrLDRuP0
We-Bull Referral
https://a.webull.com/gGlp9cTCDSzfJtjShj

Reply