- AllllSevens
- Posts
- AllllSevens Weekly Newsletter 11/27/23
Disclaimer
All information presented in this newsletter are my personal opinions & for speculation purposes only.
Nothing stated is intended to be interpreted as financial or investment advice.
I present the market through the lens of an institutional trader/investor by using Volume Price Analysis at Dark Pools. (VPA @ DP)
What is a Dark Pool?
Why do Dark Pools exist?
How are Dark Pool Price Levels useful in trading & investing when combined with Volume Price Analysis?
See this tweet below if you’d like to know.
https://x.com/AllllSevens/status/1725949825307254859?s=20
Reach out if you have questions.
Preface:
SPY is sitting below a major breakout level.
With the QQQ sitting almost directly below resistance the best move is to wait for a confirmed breakout rather than positioning for it beforehand
If the QQQ remains below resistance and SPY loses support, we have a downside trade setting up. Until either a breakout or a breakdown occurs this week, we are at a cross-roads where I don’t see any reason to get aggressive on either direction.
IWM is my focus this week with a clear directional setup to start the week.
Over support this could lead the other indices into a breakout.
TSLA is also a focus if the market can remain sturdy and QQQ push through it’s resistance.
Calendar
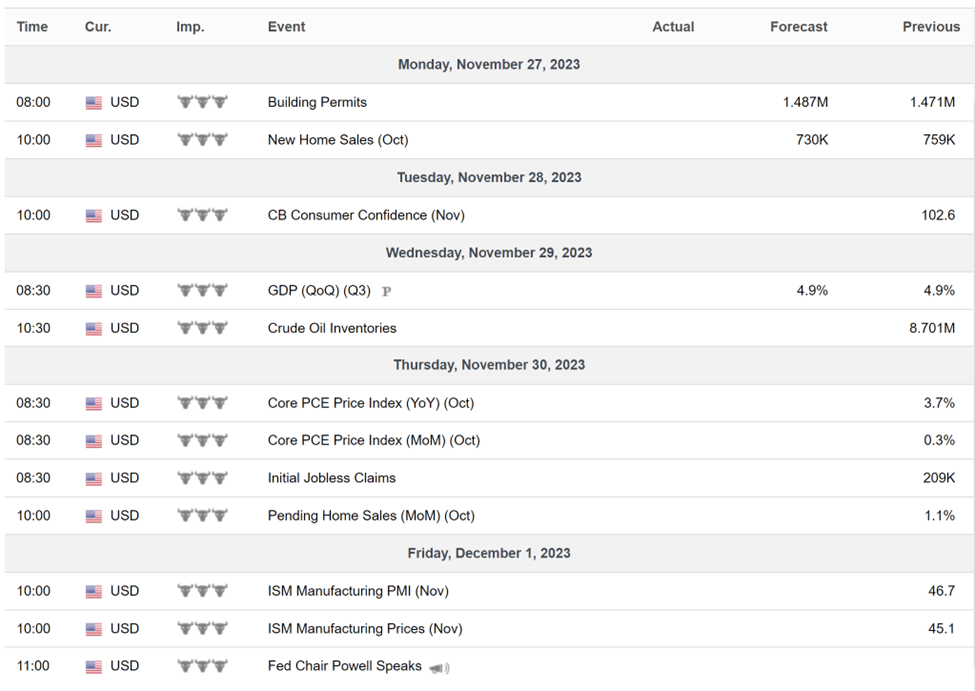
High Impact Economic Data
SPY
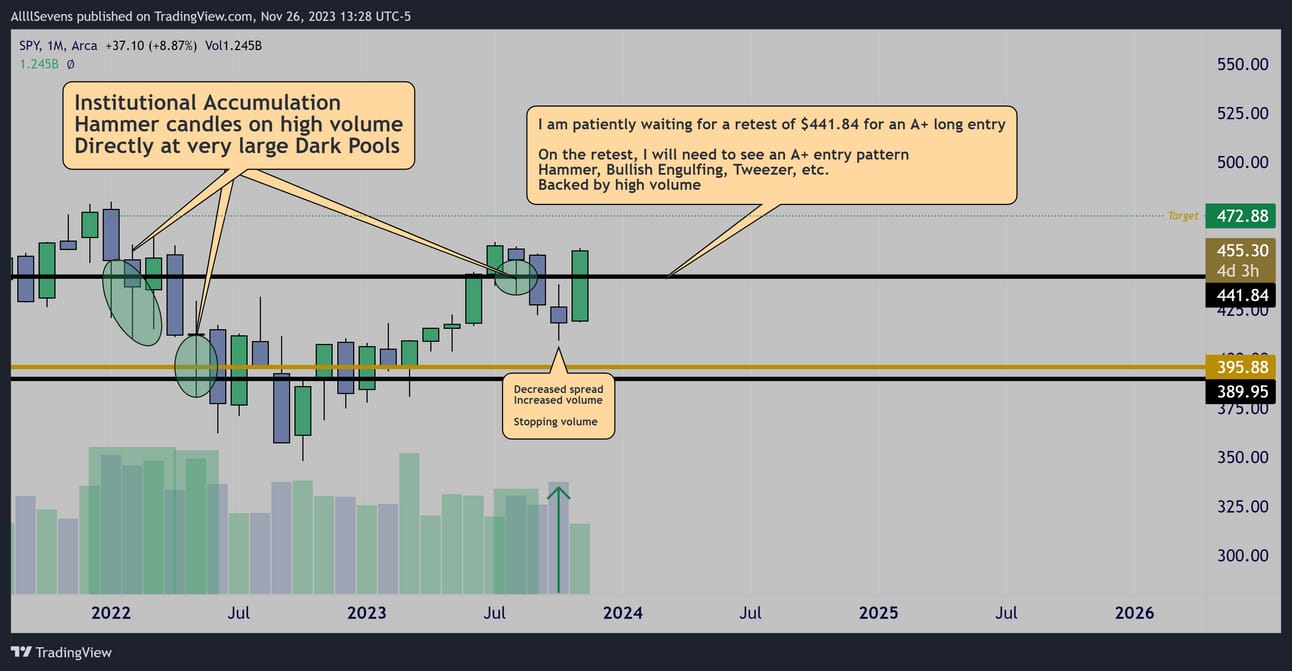
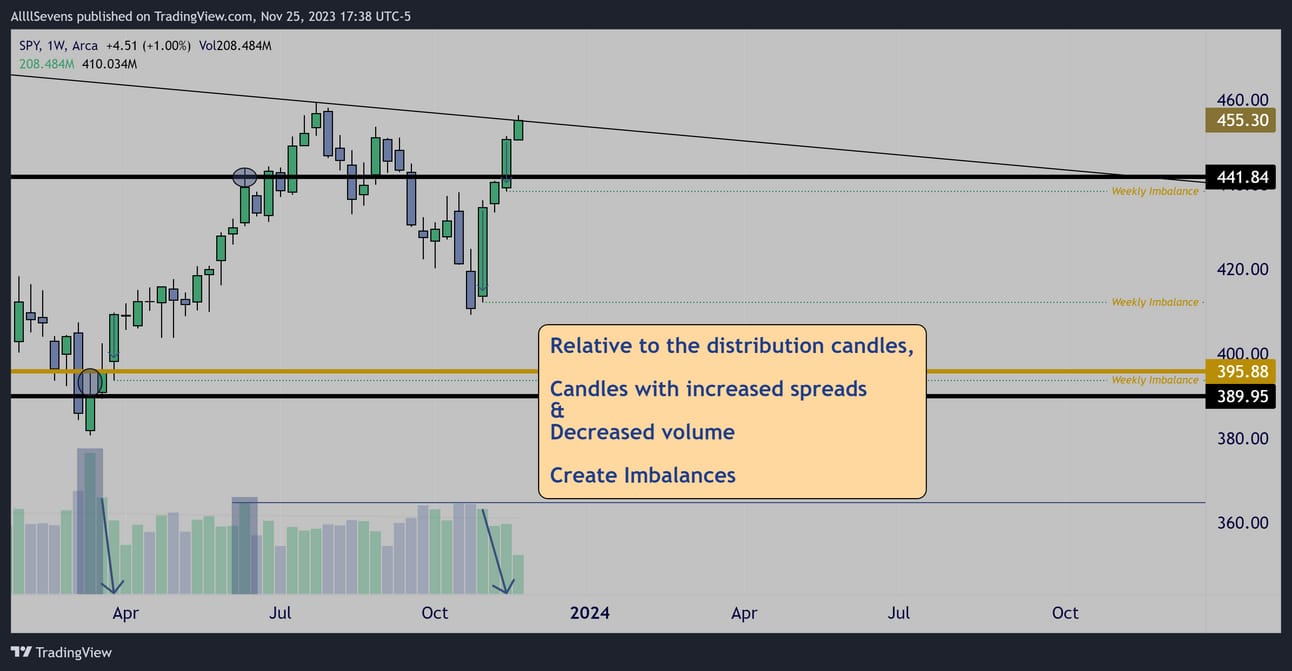
Monthly
Institutional accumulation at the $441.84 & $395.88 Dark Pools (2022)
The extreme fear and panic during that period of time was the perfect environment for institutions to absorb all the retail selling.
Further accumulation took place at $441.84 in August.
Price lost support in September anyways (impatient retail participants)
The secret was noticing the decreased volume confirming the $441.84 accumulation and creating an imbalance at the candle’s high.
Stopping volume appeared in October leading us to the November rally.
Over this key pivot ($441.84) I am generally expecting upside continuation. However, the best area to look for high risk-to-reward longs is near this pivot, which we aren’t close to at this time.
There has been no clean retest if this level, leaving me out of the market for the time being. Stalking for an entry…
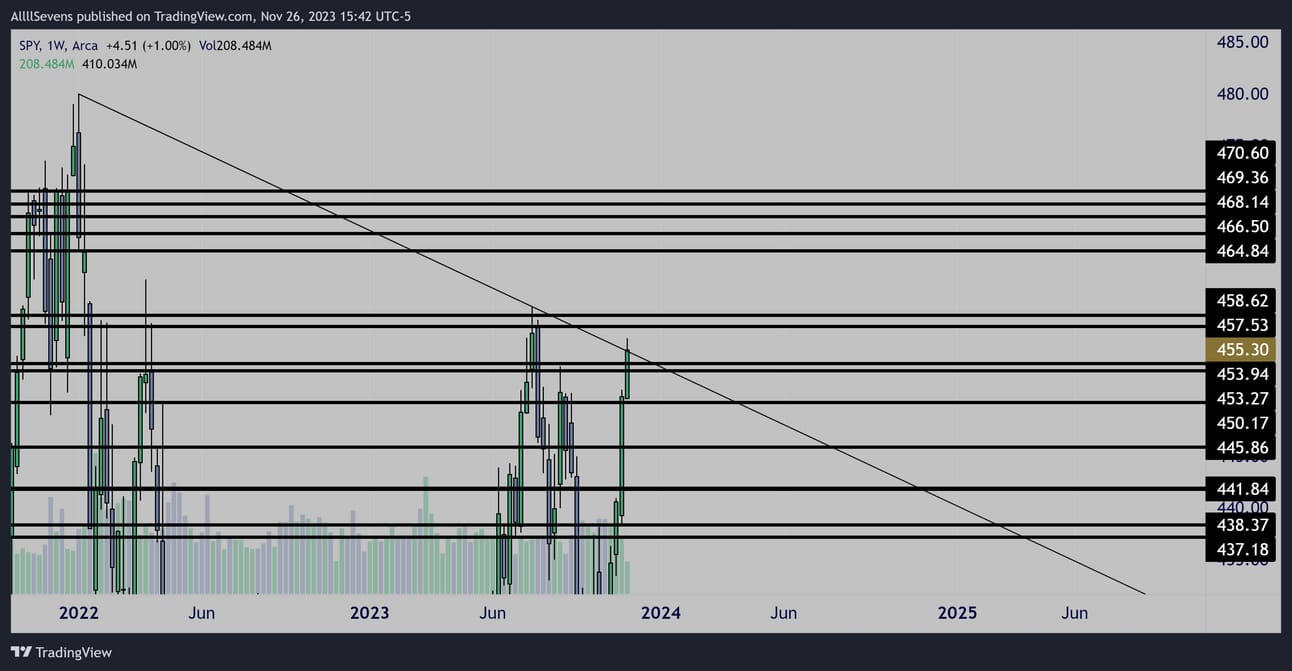
Weekly
Weekly trend resistance.
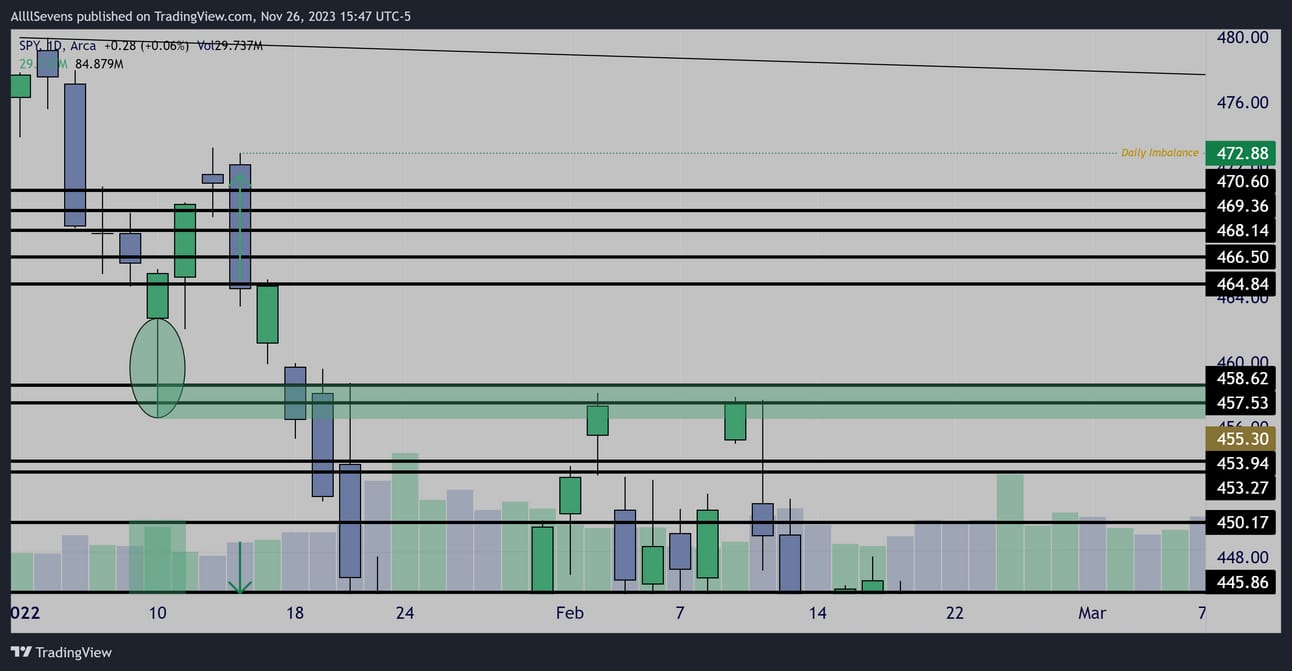
During the 2022 accumulation a daily Imbalance was created at $472.88
The $457.53-$458.62 Dark Pools were the basis for this accumulation…
A break over this zone and weekly trend would ignite a massive move!
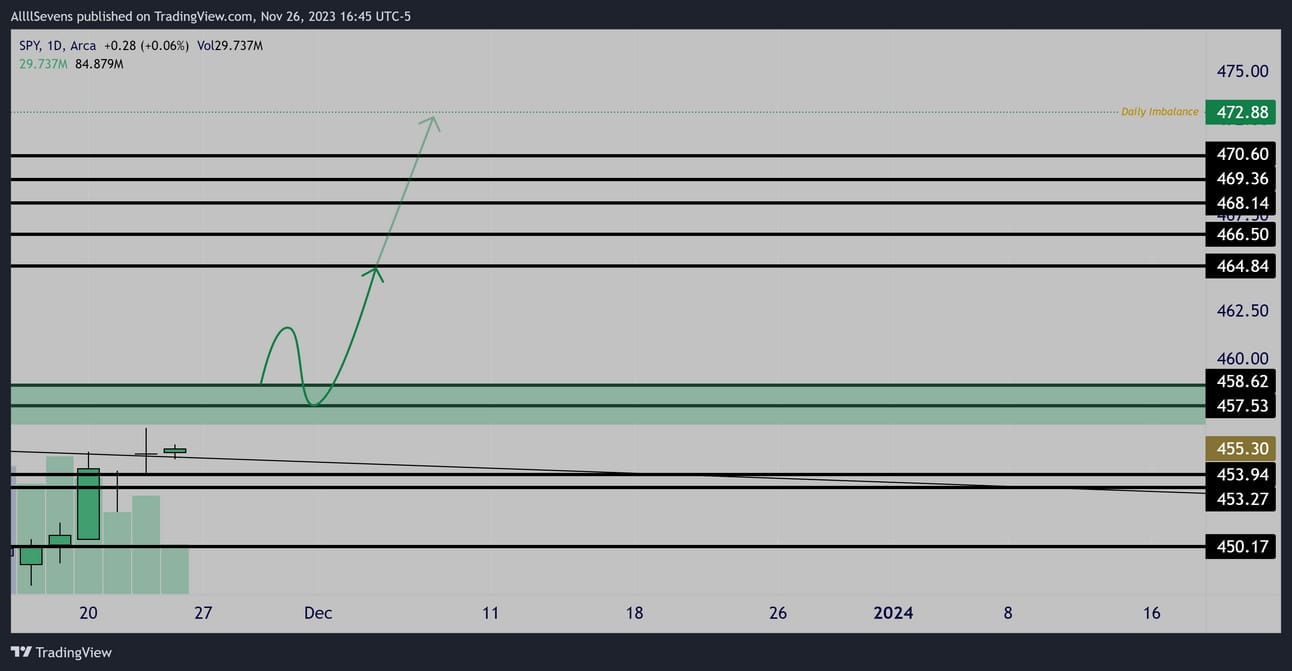
Heading into the week, $453.27-.94 could act as support favoring the current monthly trend, but I am not pressing that bias… Why?
QQQ is at a large resistance which I will display later.
The real move begins when price breaks the zone above.
When that happens, QQQ will also have broke over resistance.
That’s what I’m most interested in.
Until then, I’m not pressing the issue of opening longs so extended from $441.84 which we have not retested.
I’m a day trader with pretty much no bias until then.
Will be updating the market daily on 𝕏 !
https://twitter.com/AllllSevens
THE BEAR CASE:
There’s a reason why the March candle is not marked as accumulation on my chart shown above…
Weekly
The $395.88 Dark Pool (Largest on Record) was re-distributed in March
It’s now THE institutional “Point of Control”. It will eventually be retested.
A long-term SUSTAINABLE move cannot occur until this happens.
Key words: sustainable & eventually.
This is a long-term forecast.
Short-term I think it is crazy to be bearish SPY at this time:
Trend is up. Sentiment is positive. Price is OVER $441.84
Until something changes that, I am not pushing a bear bias.
You need to understand WHY institutions would sell out of a large portion of their longs that they just spent half a year accumulating…
And then continue to accumulate more at higher prices in August…
What the hell are they doing??
It might seem like they have no idea and they’re scrambling to react the market, but I assure you this is not the case.
They are creating a controlled environment.
Their goal is to eventually create the same event that occurred in 2022.
The same environment that allowed for massive accumulation.
The higher prices go short-term, the more retail participants will pile into long positions and FOMO into the SPY…
This creates liquidity.
When the euphoria and positive sentiment inevitably fades…
When trend shifts…
All the people piling in now will be the people panic selling and allowing for MASSIVE re-accumulation by institutions. Makes sense doesn’t it?
Let me say it again:
Institutions are creating a manipulated environment to induce volatility and create liquidity for further re-accumulation during a second wave of fear and panic when price inevitably retest’s $395.88.
They WANT price to continue rising from here because that means more retail participants BUYING into the market.
The people buying now will be the first to sell when things start turning…
They will be providing institutions with the liquidity needed to re-accumulate a massive amount of shares and prepare for a TRUE bull run.
That is my long-term view on the market.
https://x.com/AllllSevens/status/1723821796724494576?s=20
I’m not a buyer here-
I’m trader stacking cash for the buy opportunity that will come in the foreseeable future-
Could be weeks, months, or years from now.
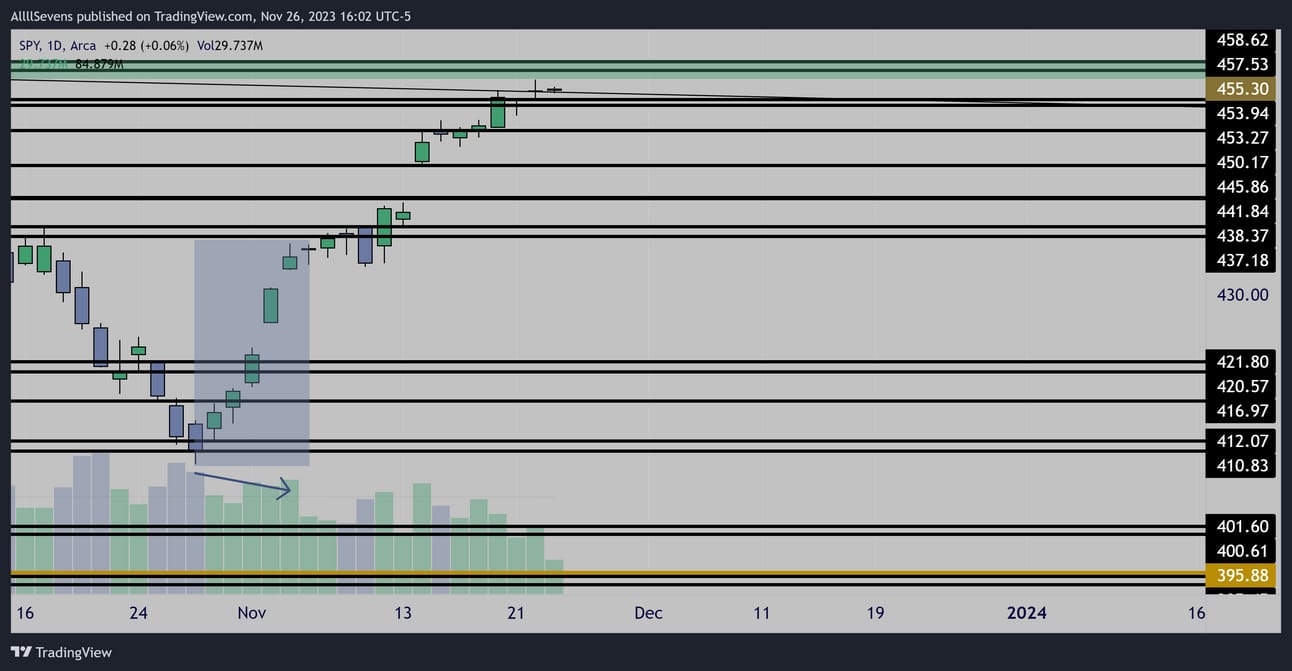
Daily
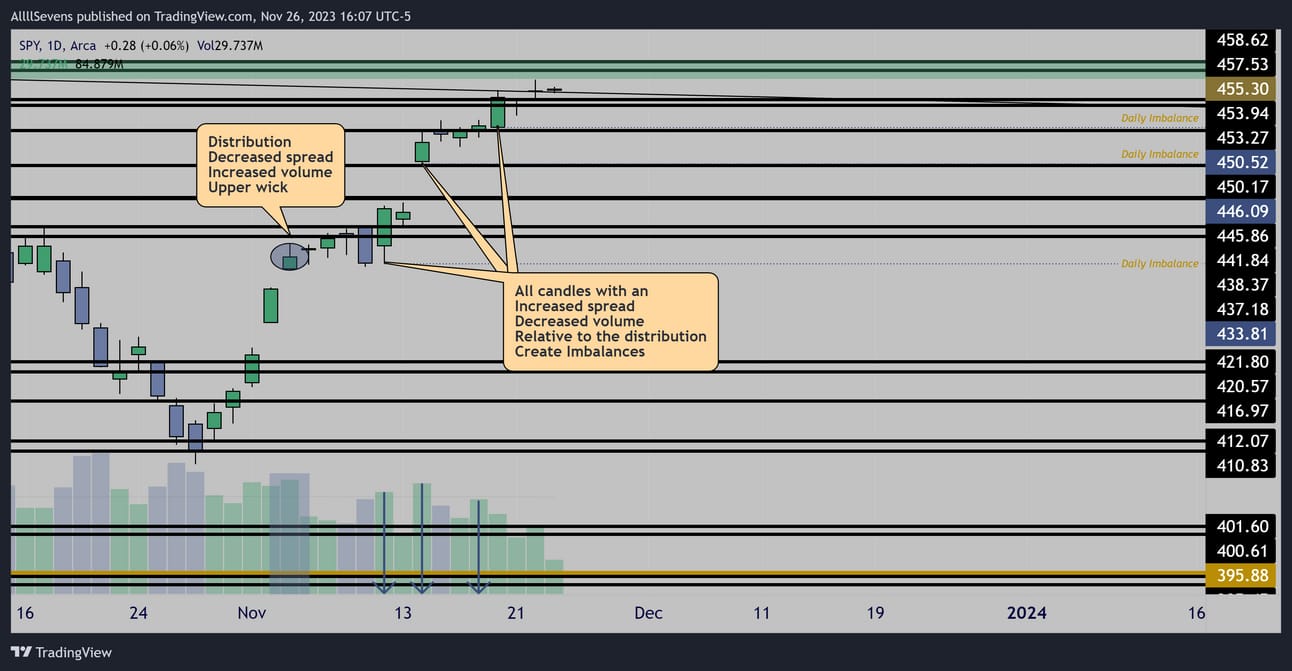
Daily
The weekly chart already shows us that this rapid move up on low volume is not stable, creating an imbalance.
I also observed and collected data on each daily candle during this sequence to confirm that institutions were distributing small amounts of shares the entire time.
(Shared in Discord. Too many images for the newsletter)
When price gets back below $437
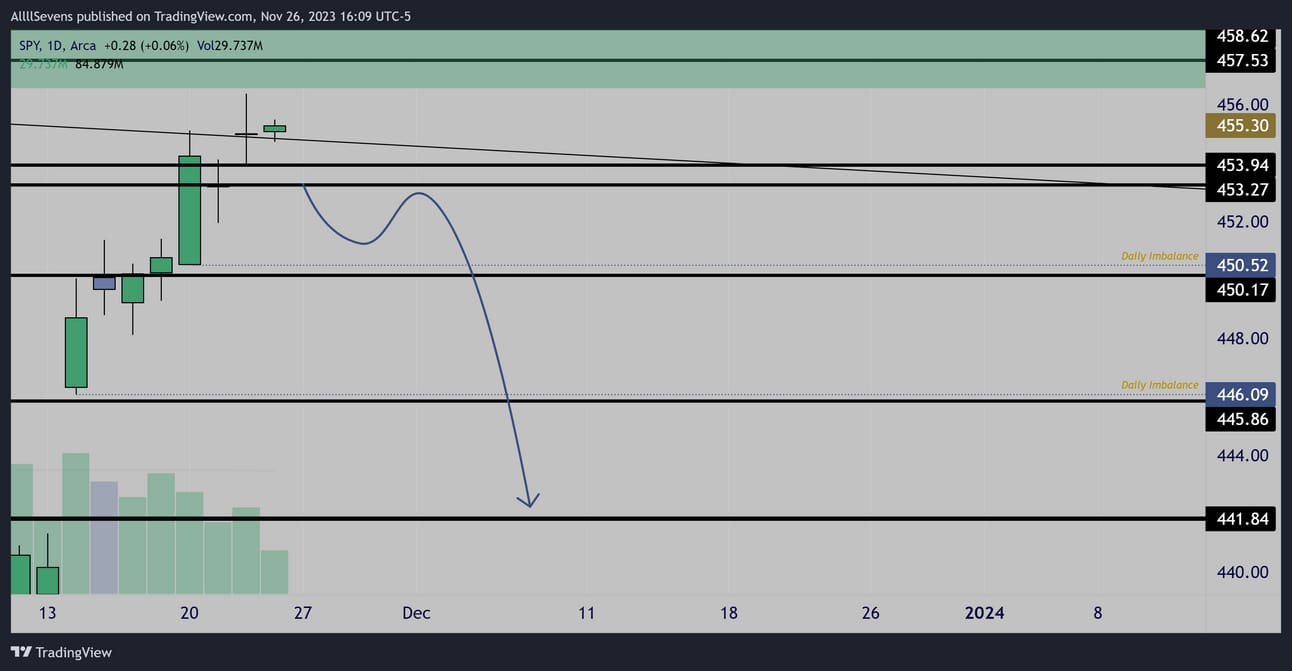
Daily
If the current support $453.27-$453.94 is lost, I will be willing to trade downside towards the $441.84 dark pool.
With QQQ being at resistance ($392.10) while SPY weekly/monthly is at trend resistance, this scenario is very much possible.
(QQQ chart in a moment)
Unusual Options Flow
I spend every day of the week recording notable Unusual Options Flow in my Discord, accessible to AllllSevens+ members.
To sum up what I have seen in the last week:
A LOT of put writing. Big money collecting the premiums of put options expiring EOY and the beginning of next year, expecting $441.84 to hold and the contracts to decrease in value over time.
Conclusion
As an investor, I don’t want to buy SPY above $393.69
I can wait.
As a short-term trader, I am in no position at this moment.
I am looking at a very lucrative long-side trade if the market can breakout over $457.53-$458.62 (QQQ $392.10)
Until that breakout happens, I have no urgency to get long-
Price is rather extended and has not yet retested a major pivot @ $441.84
The QQQ does not have support until $374.23
There are extreme nuances involved with a price holding and/or breaking a level. Price slips below and above levels all the time “faking out” traders depending on what time frame your watching.
I’d almost guarantee price won’t PERFECTLY react to these levels without any some of slippage… The key is analyzing volume heading into the test as well as during the test.
I will be analyzing and trading SPY all week on 𝕏
Make sure to view my posts for updates daily on what I’m seeing.
https://twitter.com/AllllSevens
QQQ
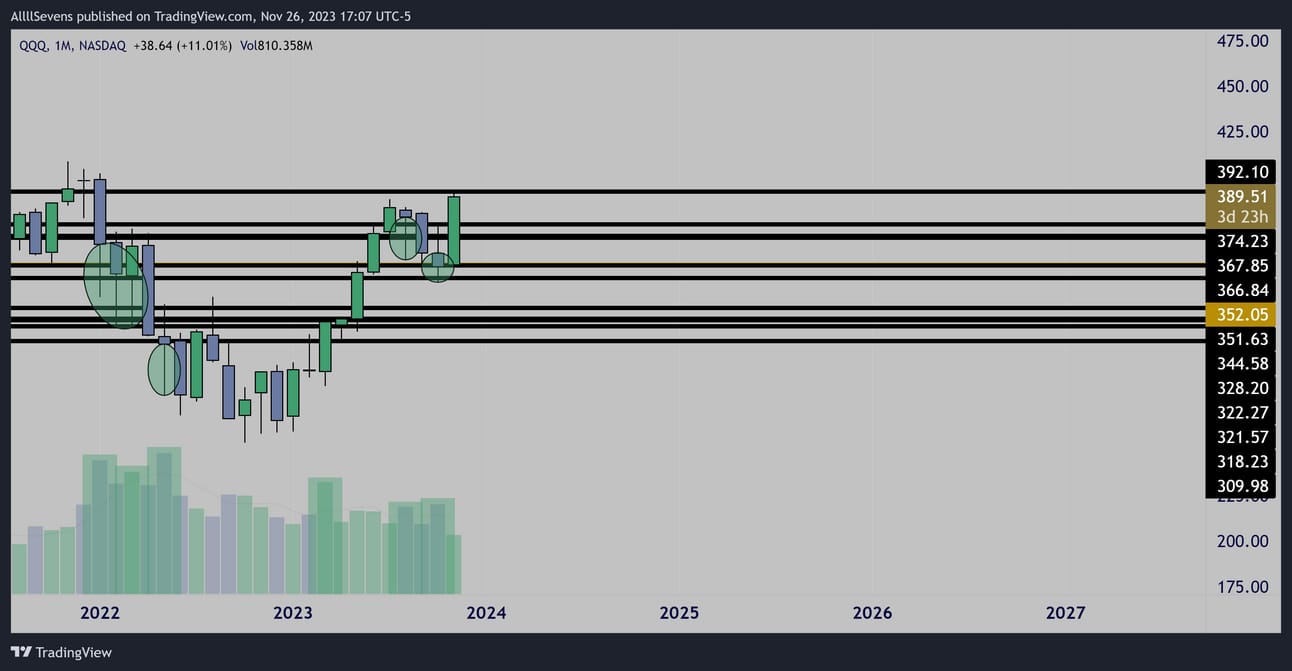
Monthly
Beautiful accumulation patterns.
Notice the QQQ does not show the same distribution as SPY in March
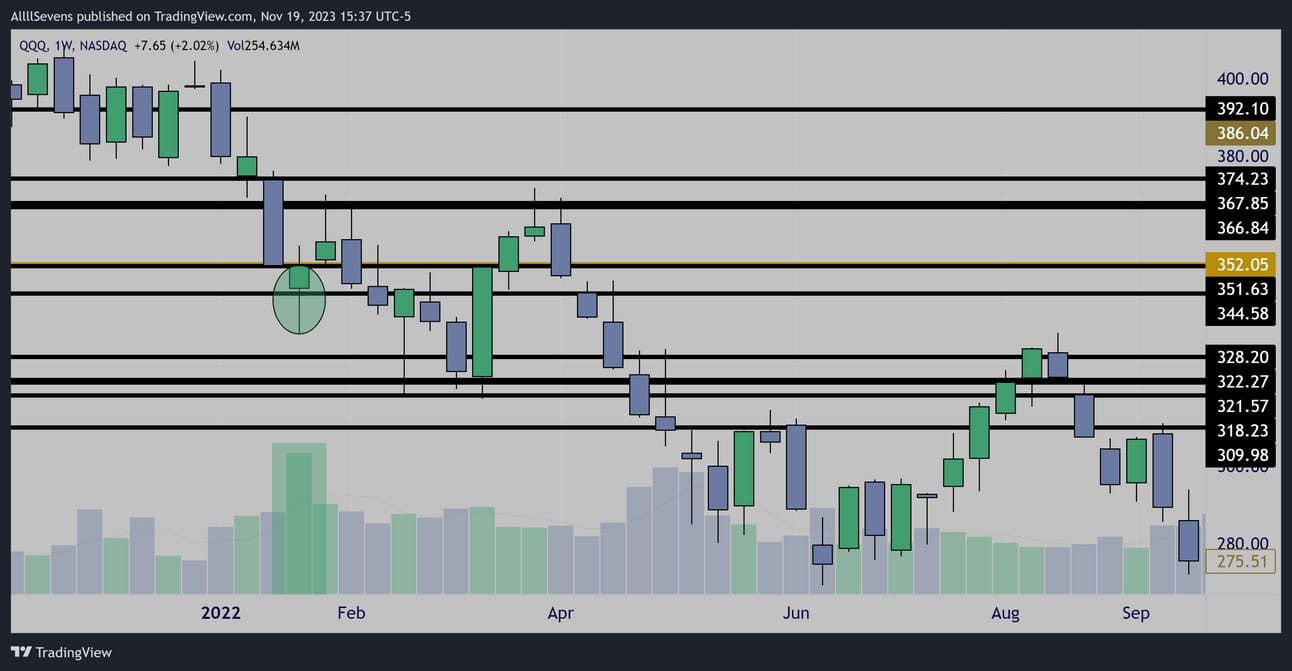
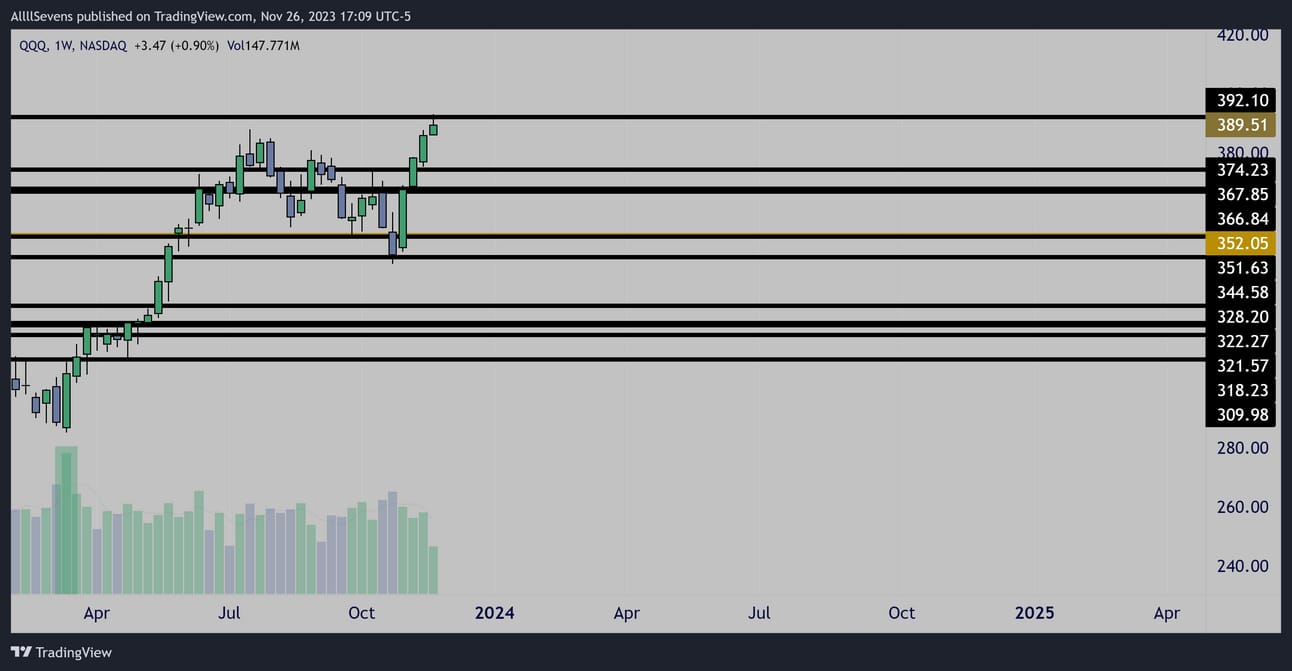
Weekly
The QQQ saw it’s largest weekly volume in over 10 years at the $352 dark pool (largest on record) on an accumulation candle in 2022
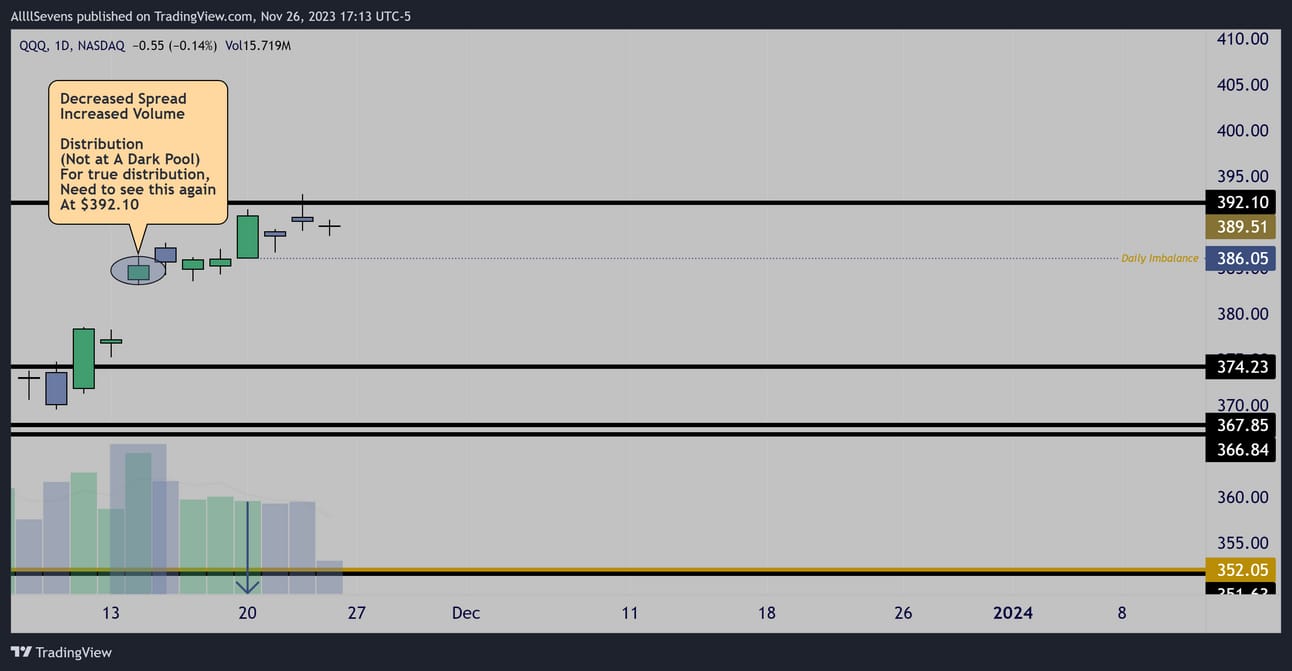
Daily
Conclusion
There’s not much to work with here.
Reading the volume off $392.10 will be very important this week if price tests it again. Being at this resistance is why I am not pushing longs on SPY until we see a confirmed breakout.
It’s definitely possible to see the market correct a bit from this resistance.
IWM
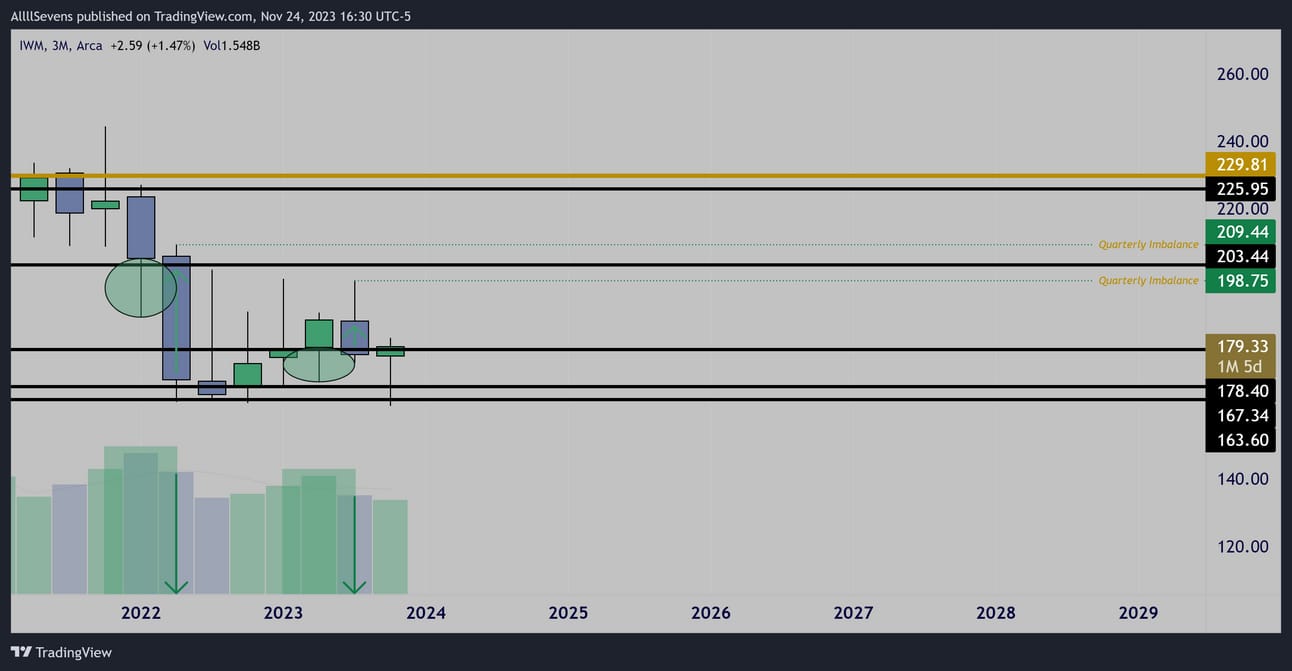
Quarterly
Institutional accumulations at the $203.44 and $178.40 Dark Pools
Both followed by low volume increased spread anomalies creating imbalances for future targets.
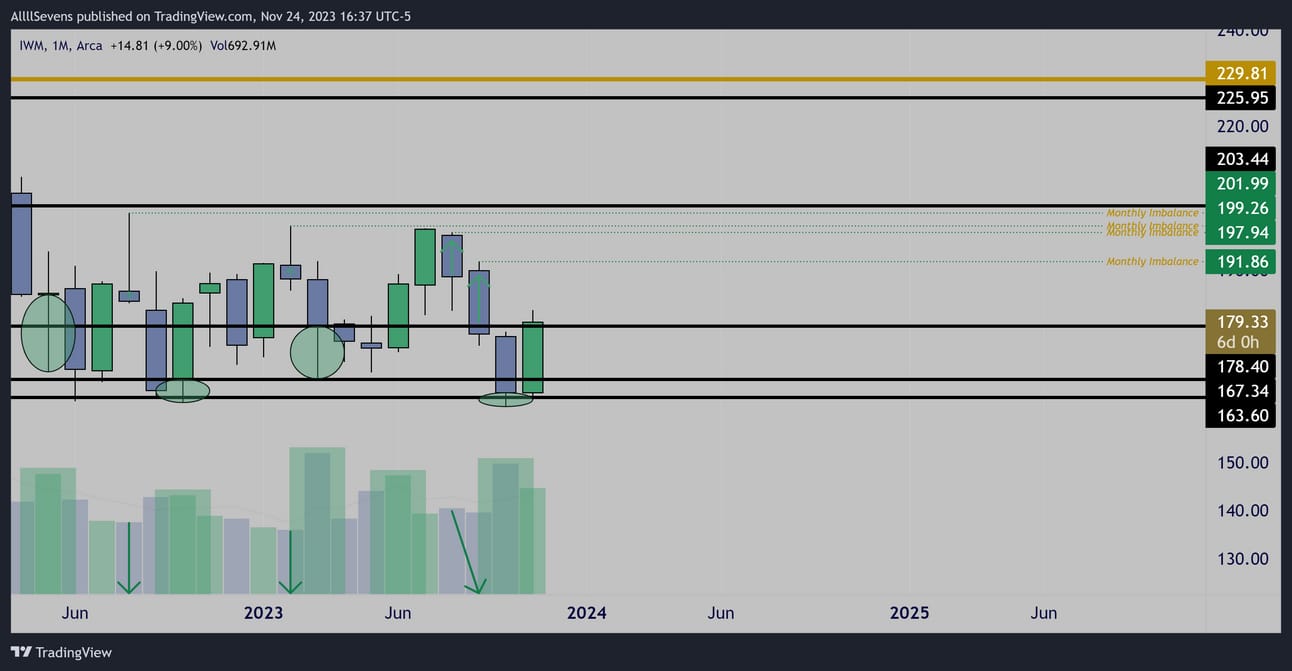
Monthly
The monthly chart further displays the accumulation at the $178.40 DP
It also shows accumulation at the lower levels $163.30-$167.34
More imbalances visible on this time frame.
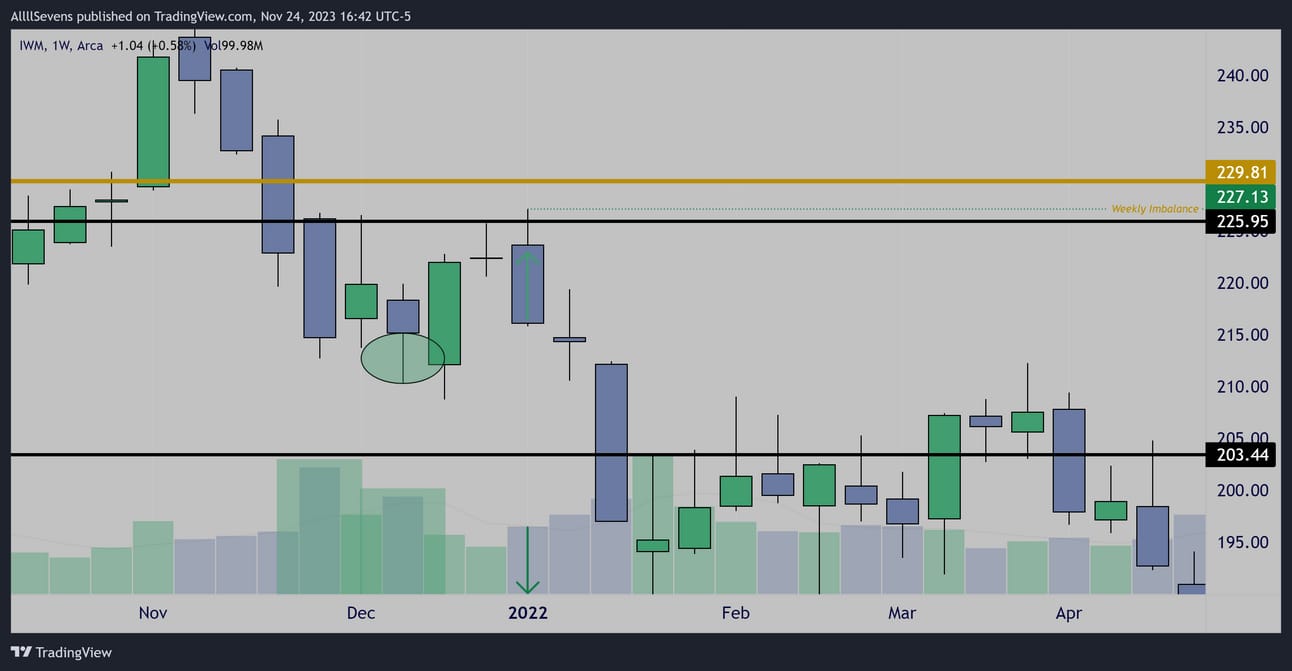
Weekly
Weekly Imbalance as high as $227.13
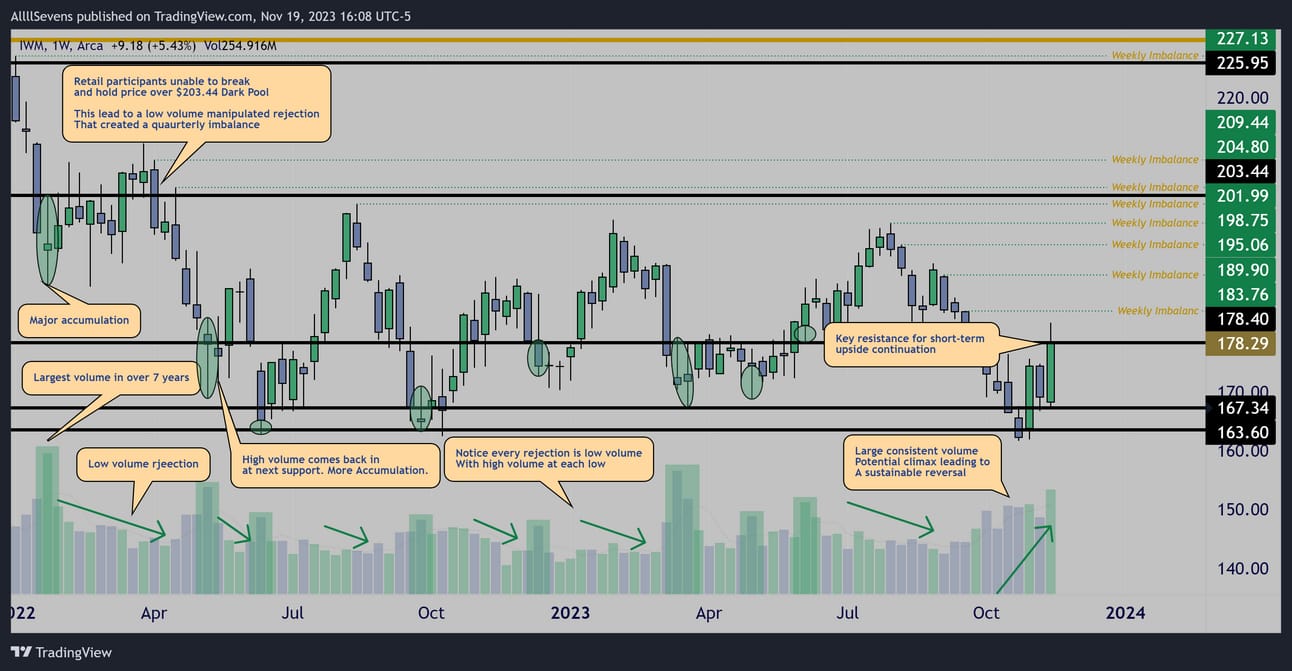
Weekly
(Image from last week’s newsletter)
Overall incredible weekly accumulation patterns for the last 2 years.
The largest volume in 7+ years came in and created the $209.44 quarterly imbalance.
Notice how ALL the volume on this chart consistently comes in at the lows of each wave, NOT at the highs. It’s only a matter of time before this explodes to the upside.
I mentioned last week;
Over the $178.40 Dark Pool range can really open up…
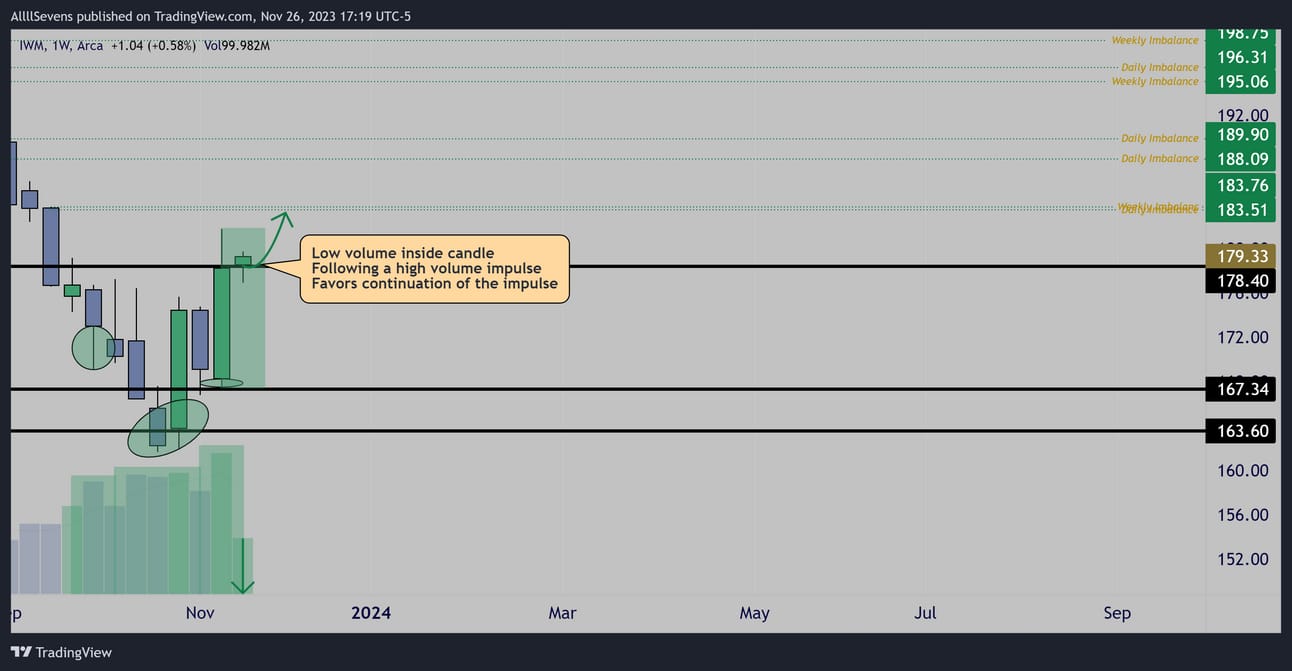
Weekly
This is an absolutely A+ setup and easily my #1 focus this week.
It’s simple over $178.40 I expect a large upside push.
If price cannot hold this level, I’m still extremely bullish IWM into March of next year and beyond, but short-term it could consolidate longer.
Unusual Options Flow
There’s a TON of bull flow for IWM out into the March 2024 expiration and beyond. I have shared it multiple times in previous newsletters now-
And it’s all in my IWM channel in Discord as well as my twitter.
For the sake of the size of this email (I literally can’t send it out with all the flow attached) I have to remove the flow from prior weeks and only share what has came in last week.
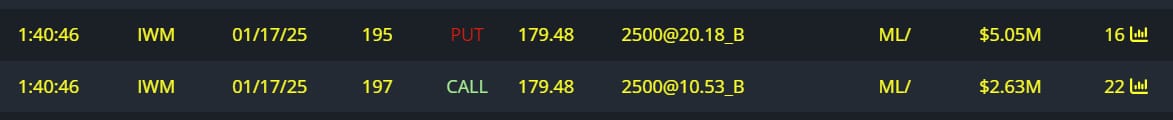
$2.4M Bullish Straddle

$200K Calls Bought

Phantom Print
Price is likely to touch this level in the future
Conclusion
As a long-term investor now is a great time to buy the IWM
As a short-term trader this is an A+ setup for upside continuation.
As long as the $178.40 support holds, I am extremely focused on this index for upside. If this support can’t hold, I’ll simply let off the gas for short-term longs. It wouldn’t be a valid short, and it would still be a great long-term buy.
TSLA
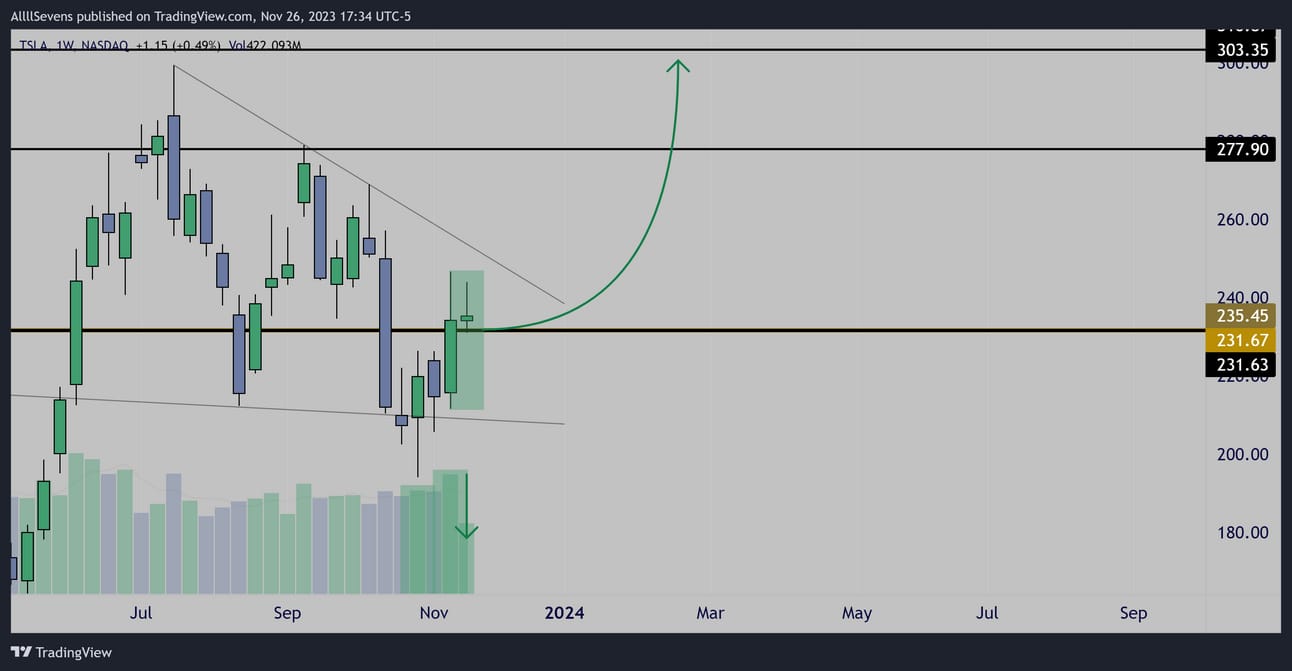
Weekly
Low volume inside bar following a high volume bullish impulse over the largest Dark Pool on record ($231.67) favoring upside continuation.
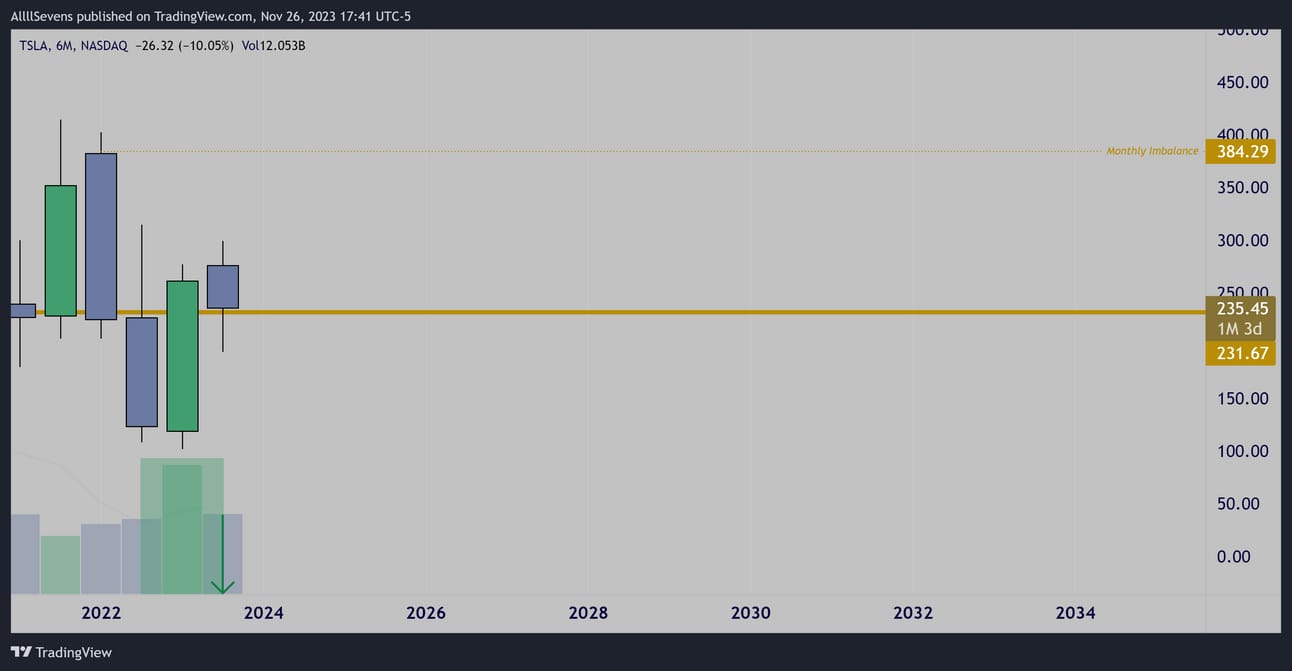
6 Month
The same kind of candle formation.
Price setting up over the largest dark pool on record following a high volume bullish impulse.
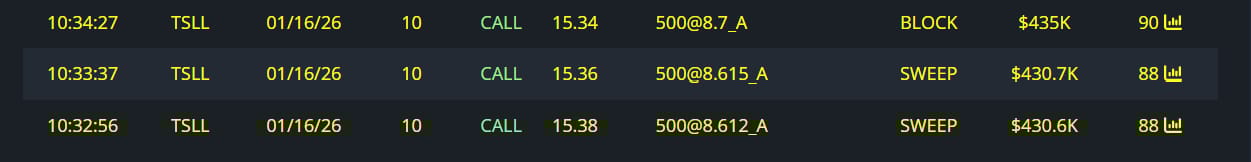
Unusual Options Flow

$113M Calls Bought

$45M Full Risk Bull
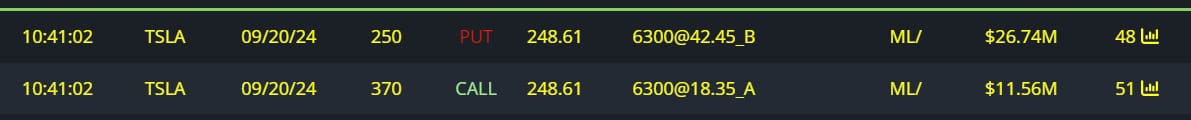
$38M Full Risk Bull

$19M Full Risk Bull
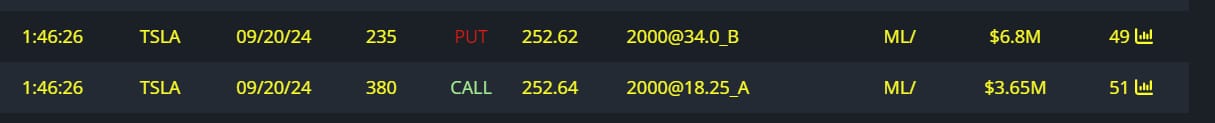
$10M Full Risk Bull

$1.6M Calls Bought
$1M Calls Bought
(Leveraged TSLA ETF)
Conclusion
An A+ weekly setup suggesting now could be the optimal entry for this multi-month swing setup.
The 6 month candle closes soon and it is essential that it closes OVER the largest Dark Pool on record ($231.67)
That’s 5 weeks to hold and reverse off this level.
The factor fighting against a reversal THIS week is the QQQ sitting below $392.10 and the SPY below a breakout level as well.
True confirmation will be when TSLA breaks last week’s high alongside the SPY and the QQQ breaking over resistances.
For now, price is clearly in a bullish consolidation, and could continue to chop around this Dark Pool. What I’m saying is I am going to be somewhat loose managing risk on this weekly entry.
It will be very key to watch this level for large bullish volume this week, confirming institutions are actively accumulating.
I will update all week on 𝕏
AllllSevens+
I write a premium newsletter and I discuss many more individual stocks.
Upon signing up for the premium newsletter you also get access to my Discord where I organize and consistently update my analysis on EVERYTHING everyday, every week with any volume anomalies or unusual options flow as they happen / come in.
It’s only $7.77 per month.
https://allllsevensnewsletter.beehiiv.com/upgrade
We-Bull Referral
https://a.webull.com/gzxp9cTCDSzfJtjmSj

BlackBoxStocks
The Ultimate Tool For Traders
Dark Pool
Options Platform
Stocks Platform
Proprietary Indicators
Live Community & Members Chat
Education Program Courses
Mobile App
News
I collect all my Unusual Options Flow and Dark Pools through BBS
BlackBoxStocks offers a 20% discount to first time members!
Use my referral link >http://staygreen.blackboxstocks.com/SHMs
BBS also offers a military discount!
See in detail what all BBS has to offer by reading this guide linked just below!
https://docs.blackboxstocks.com
Reply