- AllllSevens
- Posts
- $AMZN Short Squeeze
Disclaimer
I am not a legal professional.
The content shared in this newsletter is purely my personal opinion and for information purposes only.
You should not interpret any of this as investment or financial advice.
The statements I make are not solicitations, recommendations, or endorsements to buy or sell a security or financial instrument.
I am not a fiduciary on account of your viewing of this information.
You are solely responsible for the risks involved with the use of any information shared in this newsletter.
By using this site and reading this newsletter, you agree to not hold me, my affiliates, or any third party liable for decisions you might make based of information shared in this newsletter.
Preface
In my last newsletter, I wrote about my strong conviction to NOT yet short the S&P500 ($SPY) even though I do believe a short-term top could be on the horizon due to the monthly candle formation.
You can view this here, or just read the brief recap below before I dive into the actual focus of this week’s newsletter 👇
I explained that while the April Monthly candle appears very ominous, bearish engulfing the March candle on increasing volume and potentially signaling a stall in the current upwards trend…
The Daily & Weekly candles & volume did / do not align.
Both showed bullish anomalies in the $520’s as price tested the $494.38 support in a very clearly exhausted downtrend.
R/R and probabilities both favored a bounce before considering shorts.
Price is now sitting at $511 headed into next week and those imbalances in the $520’s remain.
All that has changed, is the R/R for opening longs.
There’s no way I’m opening SPY longs this far from the $494.38 support.
It’s not an option. It was two weeks ago when I wrote that newsletter!
Just because the R/R is not here for opening longs, I want to make sure I don’t force a bear bias just yet.
I generally expect price to continue gravitating upwards to the $520+ imbalances and $522.14 monthly resistance as long as price is over $494.38. This is why this week’s focus is indeed a long, just on a stock with a good R/R
I do not / can not take action on my bearish monthly thesis until the R/R for shorts is there ($522.14) PLUS, daily candles show aggressive sellers.
When / if that happens, I will update. Until then,
Here are my DAILY levels for trading SPY
These are larger than normal dark pool transactions.
Notable institutional supports & resistances, no hand drawn magic lines.
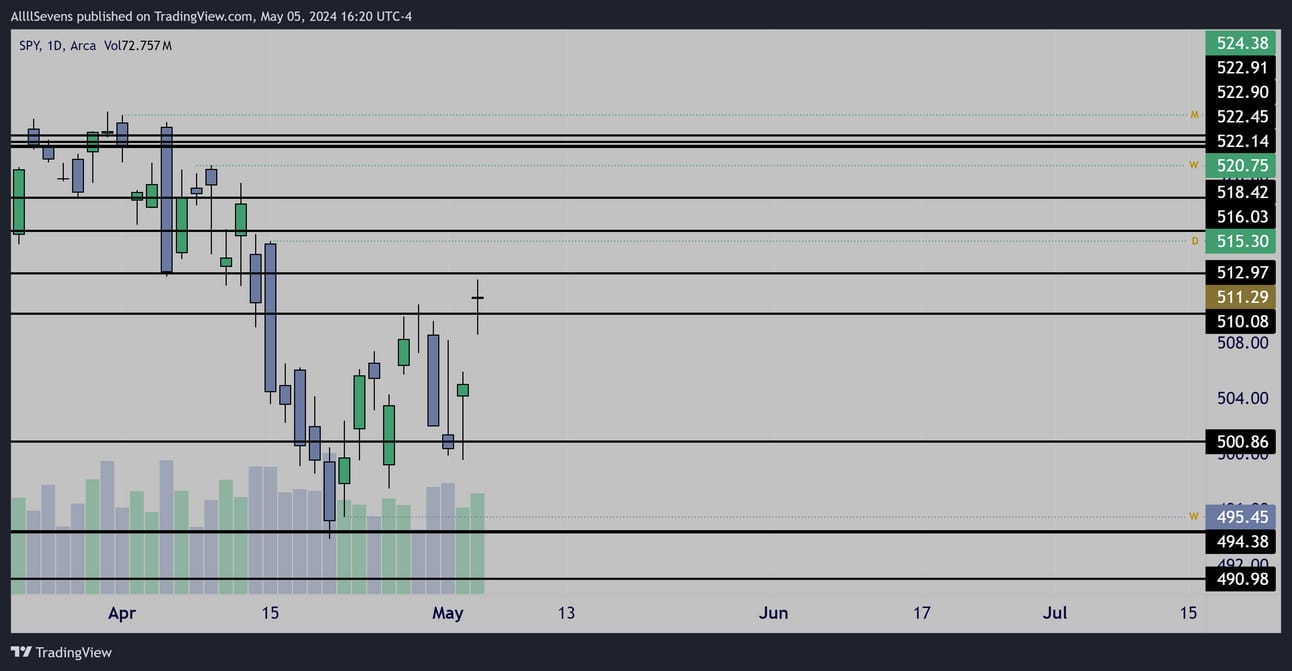
Daily Interval
I share day trade ideas & update SPY levels daily on my 𝕏 (Twitter) account so make sure you are following me with notifications on for market updates!
Remember, the weekly chart is very much in no-mans land here.
$494.38 and $422.14 are the two primary dark pools in this range.
This week does not have a ton of high impact economic data, no notable option expirations, nor do we have any major tech earnings this week.
There could be lowered volatility on the SPY this week.
All reasons why I am focused on…
AMZN
Monthly Interval
Zoomed Out
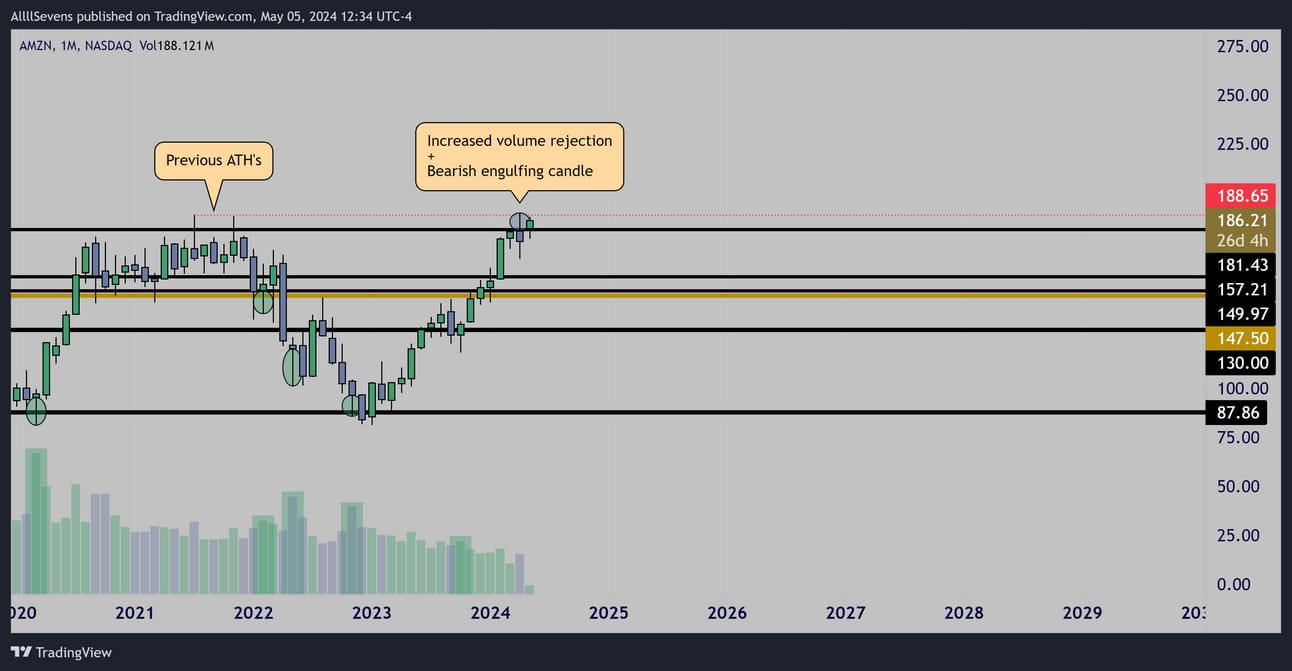
$AMZN stock broke to new ATH’s last month and quickly rejected,
Forming an increasing volume bearish engulfing candle.
I’d consider this an A+ short-term bearish setup and I’m sure many other traders/investors would agree.
Therefore, I assume that a substantial amount of market participants either went short or sold a large chunk of their investment headed into this earnings report last week.
Rightfully so! Holding through earnings reports are inherently risky, plus the monthly candle formation. I think doing that was valid…
Monthly Interval
Zoomed In
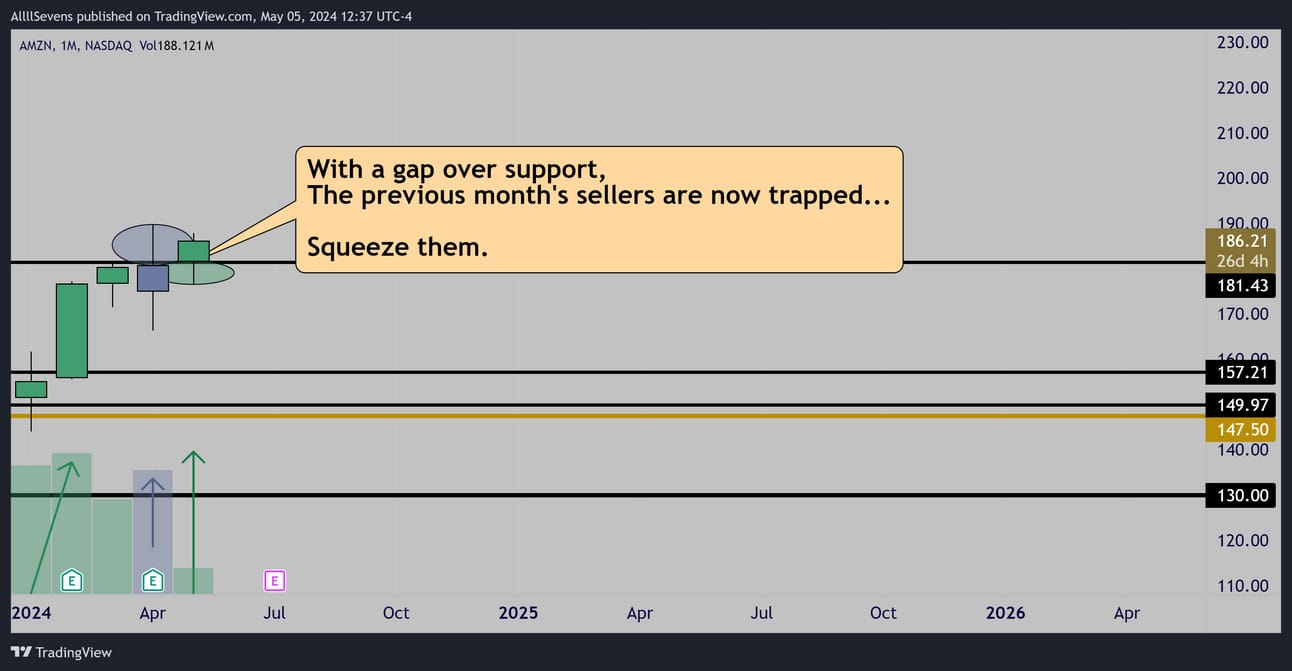
But, earnings was a beat, and price managed to gap UP & OVER a historic (pre-split) dark pool level @ $181.43
Not many people actually have these levels marked on their charts or are even aware they exist, but, this immediately invalidates last month’s bearish pattern. Price is now pivoted UP on the month.
It opened OVER institutional institutional support @ $181.43
The concept here is simple:
A large handful of market participants sold their AMZN longs last month & some even went short.
With price gapping up & over $181.43- They are now trapped.
Like I said, they don’t even know this dark pool level exists.
They still see a bearish pattern and are completely un-aware of the invalidation that occurred when price gapped, retested, and held this level post-earnings.
Because of this “hidden” support coming into play after a clearly bearish pattern, there are now a lot of un-suspecting bears on AMZN…
A large number of participants are either short, or waiting to buy back in at lower prices having just sold prior to earnings…
I predict that people who are short are about to get “squeezed”
I predict people waiting for lower prices are about to FOMO in when no lower price comes and new ATH’s get made.
These two dynamics create a perfect psychological effect on the market to draw in lots of volume and volatility. Exactly what you want as a short-term trader looking to exploit short-term fluctuations in price.
Conclusion
As long as AMZN price holds over $181.43, there is a high probability for a volatile expansion higher due to short covering and FOMO buyers.
This could happen over a series of days, weeks, months, etc.
How long it takes is not something I believe anyone is able to predict.
All I can say, is if $181.42 holds, upside is likely.
I think a new ATH is a no brainer and my primary target is $200+
You’ve got to think from the perspective of the average trader / investor, more specifically the ones who are bearish AMZN here.
The average trader/investor loses money. Why?
They likely don’t make plans for their positions, and if they do, they don’t follow them… they adjust them to avoid loss in any way.
So, when a new ATH is made and their bear thesis is threatened,
I think most of these bearish participants rather than accepting they were wrong, will actually adjust their “plan” and make the $200 psychological level their line in the sand for covering shorts and / or FOMO’ing back into longs.
I predict new ATH break will only add fuel to the rally.
More so if it initially rejects… because then bears will continue to hold onto their thesis. Maybe even short or sell more shares.
And, if $181.42 is never lost, they will likely get squeezed!
Here is some notable options flow I gathered over the last month:
I really like these August $205c’s

$6.37M 8/16/24 205c’s Bought
Date: 4/05/24

$32.9M 6/18/26 140c’s Bought
Date: 3/29/24
I hope you found some value here!
If you did, be sure to sign up for more of my email newsletters HERE
I also share content DAILY on 𝕏 !!
Follow me here: https://twitter.com/SevenParr
I also write PREMIUM newsletters -
Same style as these, just more. I charge only $7.77 per month because I want to be affordable, I am not trying to scam people, and I also want to get rich from trading & investing not just writing about it!
With premium, also get access to my Discord where I log and journal all the data leading up to to these newsletters as well as update my thesis’s regularly. Discord is NOT an alert service, if that’s what you’re looking for this premium subscription is not for you.
Example of a premium newsletter sent last week : CLICK HERE
Upgrade with this link below :
https://allllsevensnewsletter.beehiiv.com/upgrade
Thank you for your time & attention!
I will update this AMZN thesis regularly on 𝕏
Reply