- AllllSevens
- Posts
- The bull market hasn't even began.
Disclaimer
I am not a legal professional.
The content shared in this newsletter is purely my personal opinion and for information purposes only.
You should not interpret any of this as investment or financial advice.
The statements I make are not solicitations, recommendations, or endorsements to buy or sell a security or financial instrument.
I am not a fiduciary on account of your viewing of this information.
You are solely responsible for the risks involved with the use of any information shared in this newsletter.
By using this site and reading this newsletter, you agree to not hold me, my affiliates, or any third party liable for decisions you might make based of information shared in this newsletter.
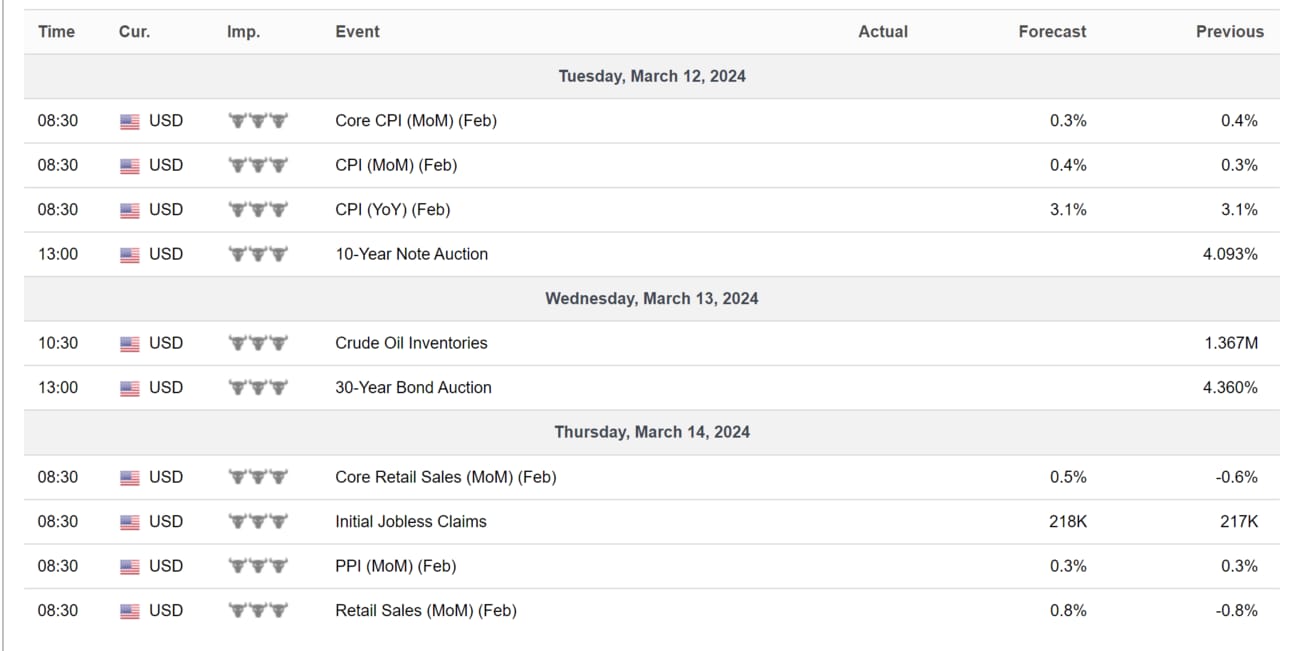
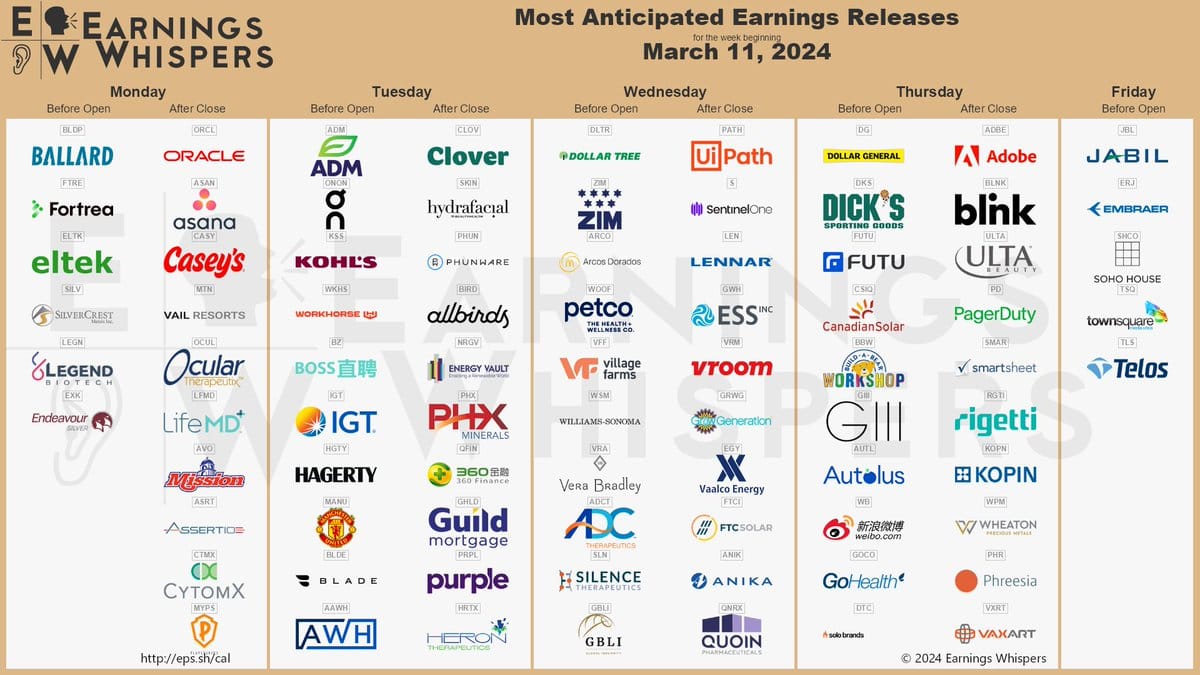
Calendar
Preface
The main take-away of this newsletter should be the DATA I share.
Not my personal opinions.
Feel free to put YOUR own spin on things.
Also, the focus here are LONG-TERM institutional outlooks.
I do think the market is strong and will continue rising short-term BUT if it doesn’t and by some freak coincidence this newsletter marks the top, just remember the bigger picture.
Anyways,
There are once in a generation opportunities in front of us.
It may seem enticing to “go all-in” but that’s not at all the message I am trying to put out.
Never over leverage. Never get to aggressive.
Take time. Plan. Be conservative.
That’s how you beat the market over time.
Pigs have fun in the short-term but always get slaughtered.
In this newsletter I explain how the SPY & the QQQ are STILL discounted.
I go in depth on each individual sectors to identify where the largest opportunity is to capitalize off of this.
I also cover the IWM & the KRE
Some really notable opportunity over there.
And the XBI - just wow. You’ll see.
On top of this, I explain my short-term view on QQQ & SPY and why I think the uptrend is still very much in tact & not seeing strong signs of a reversal yet ever after Friday’s rejections.
P.S.
Thank you so much for your time.
I put a lot of work into this.
QQQ
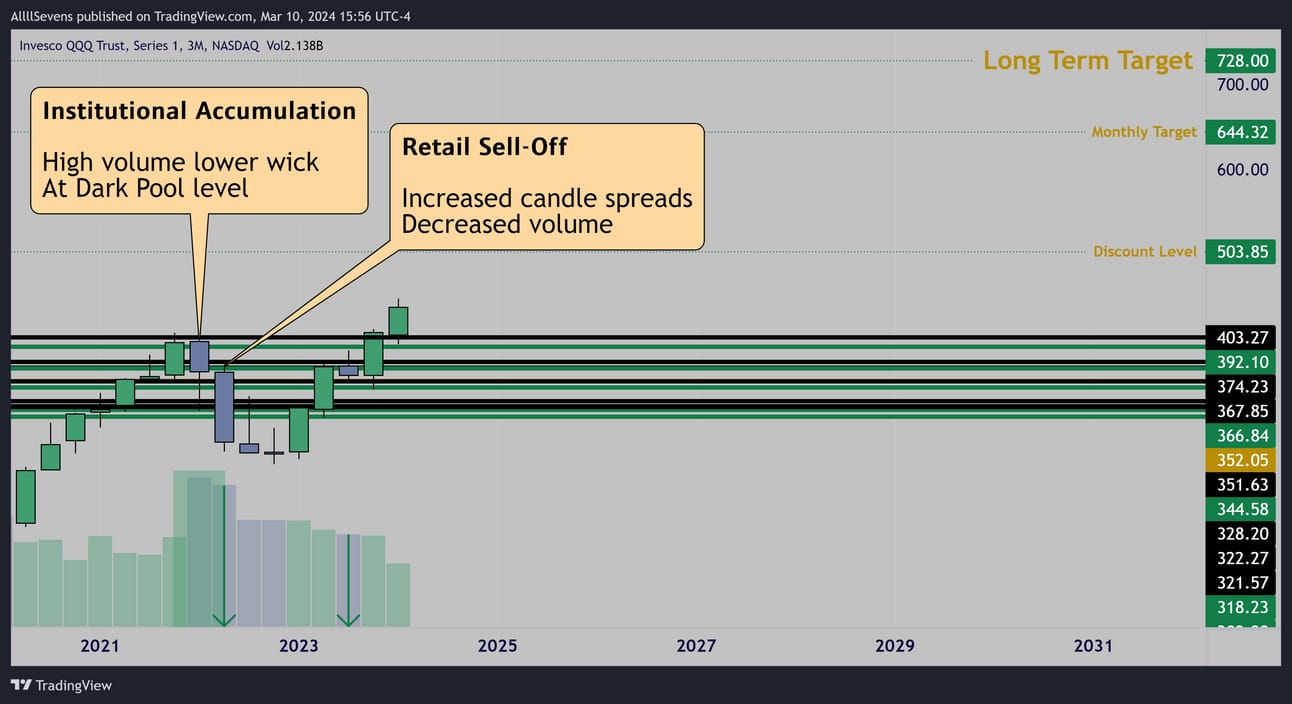
3 Month
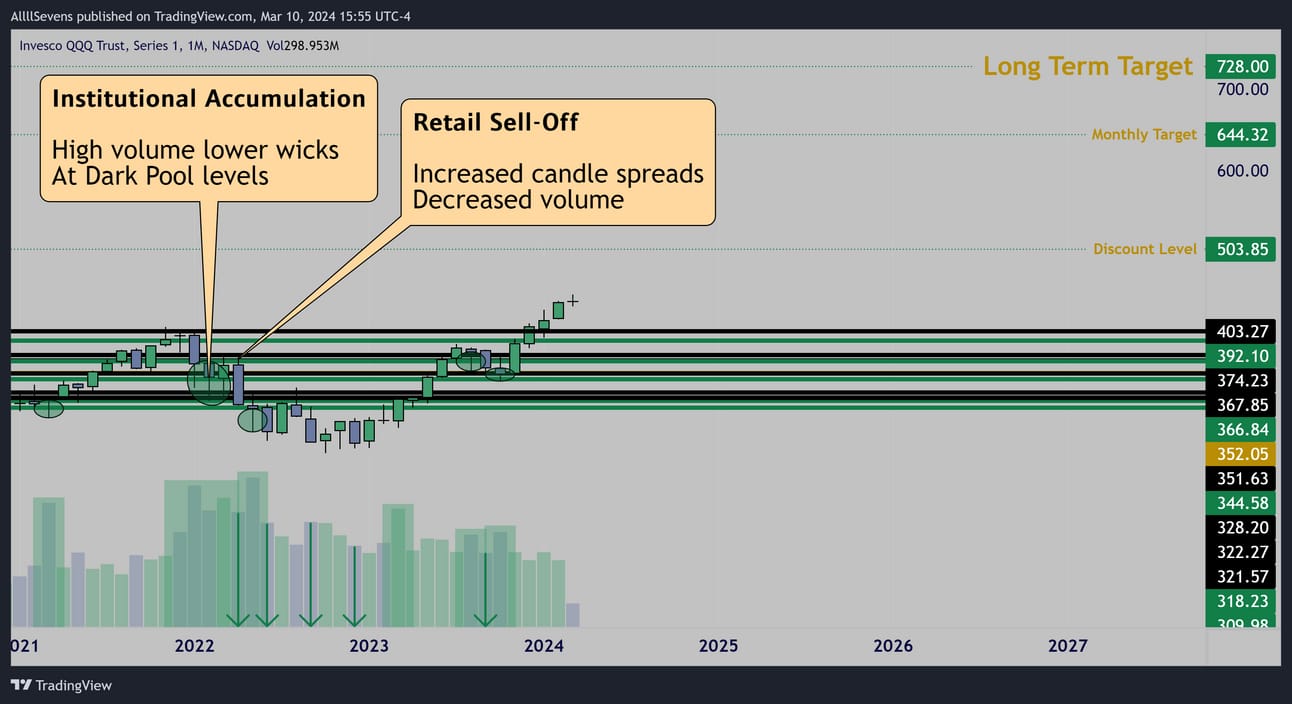
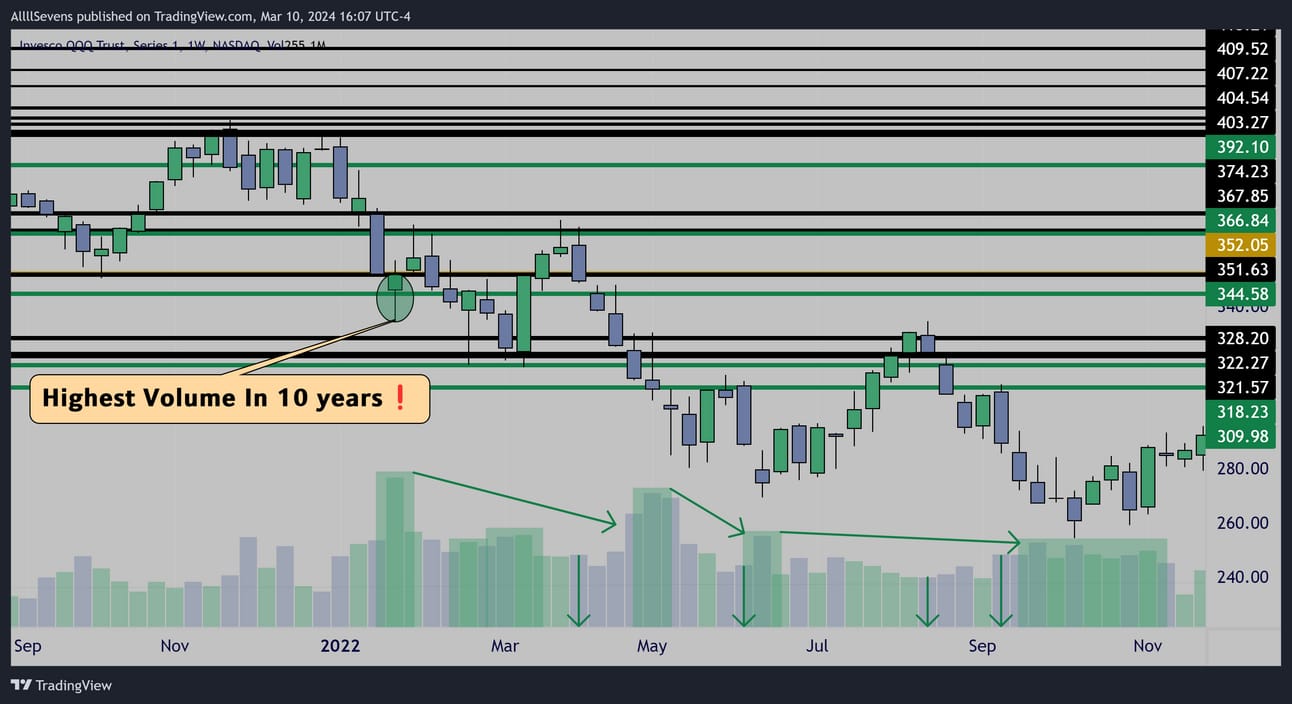
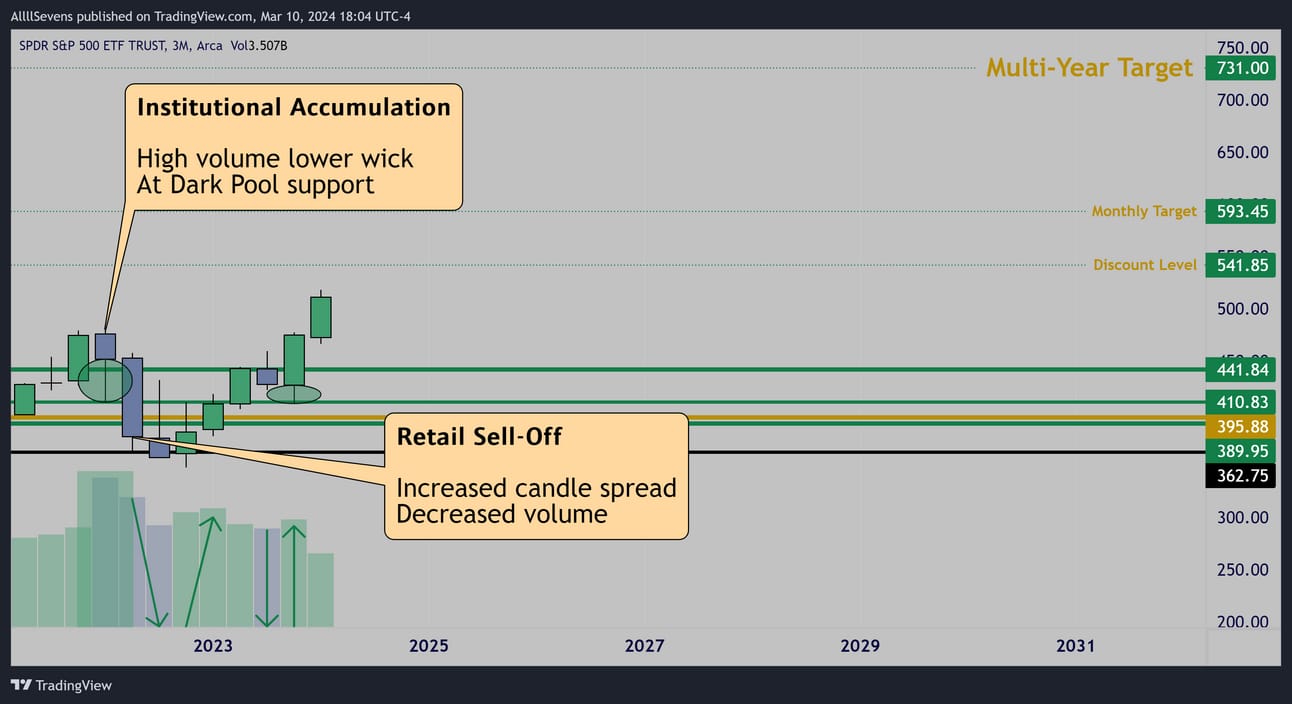
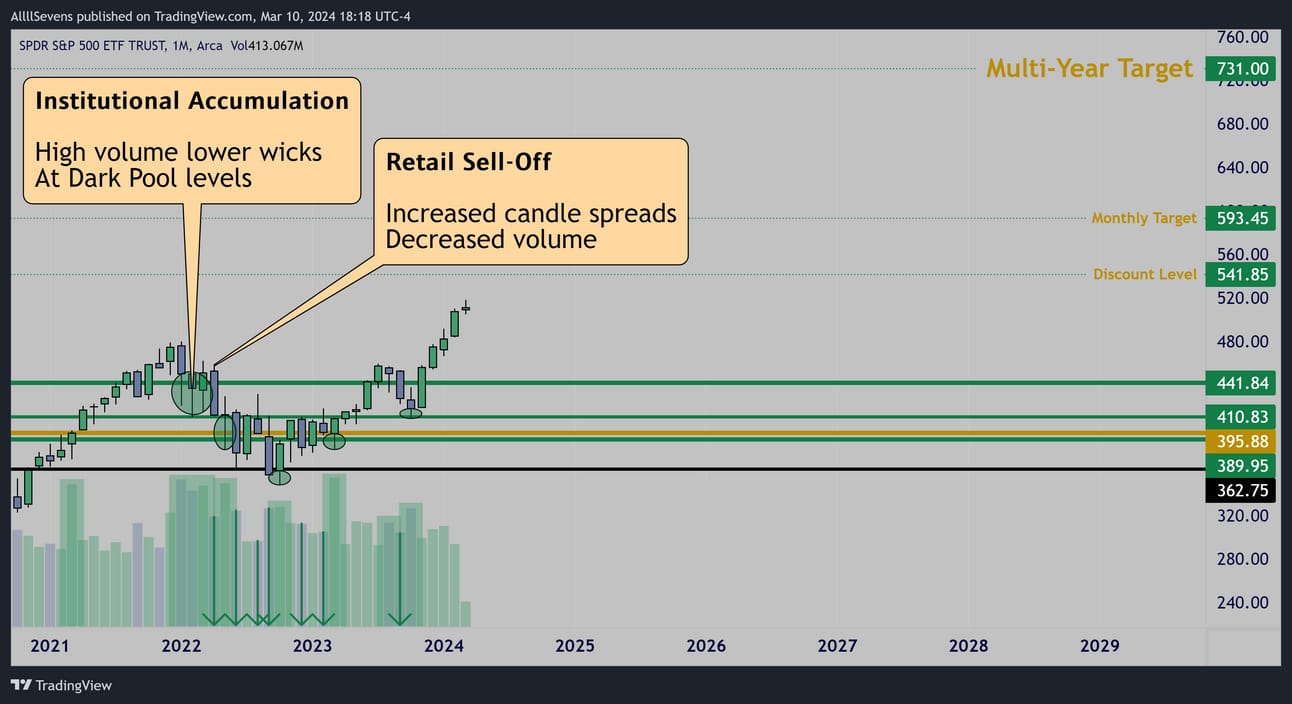
A historic institutional accumulation the first quarter of 2022
This candle was the largest volume QQQ has seen in 10+ years.
This explains the relative strength to SPY that has been displayed over the last year doesn’t it? This strength could continue long-term.
My projections on the QQQ are much larger than they are on the SPY
This means QQQ will also be more volatile when pullbacks occur.
With heightened reward comes heightened risk.
QQQ is currently trading at a -12.87% discount below $503.85
From there, I see minimum upside potential of +44.49% to $728
Where am I getting this discount level?? How does that even make sense? I assure you I did not pull this out of thin air.
It’s backed by data!
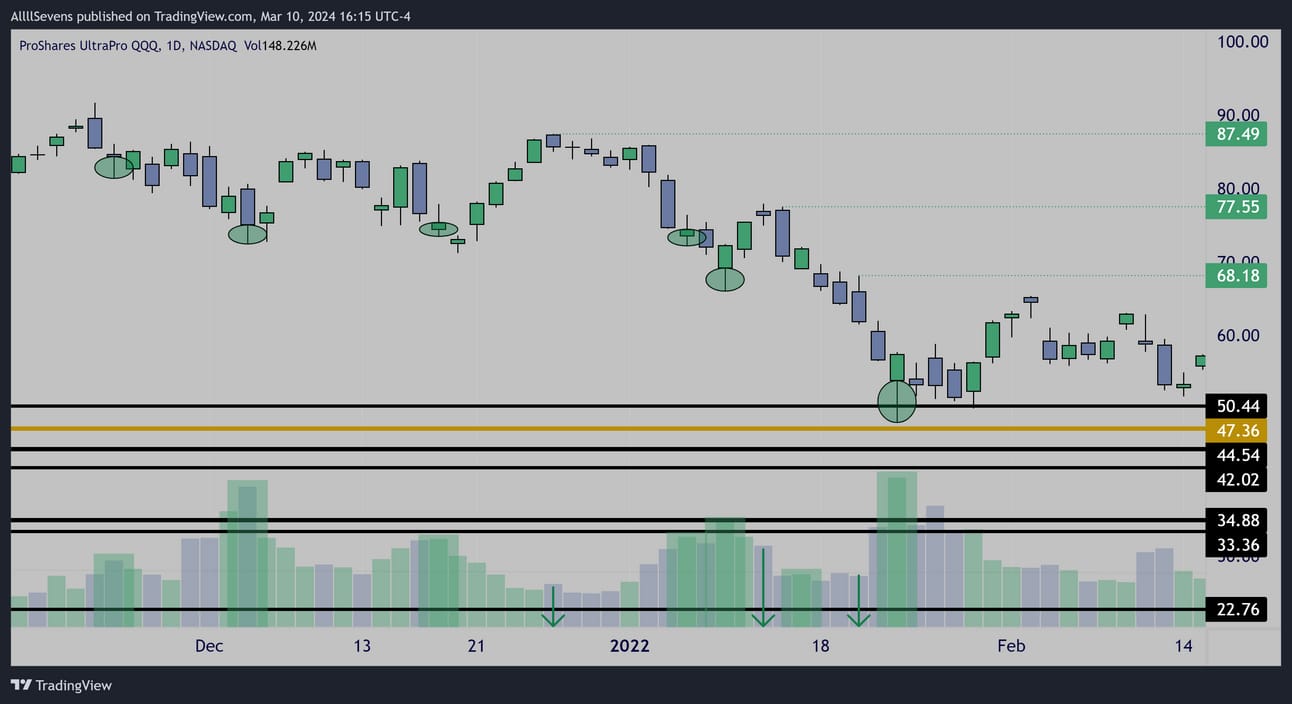
Daily
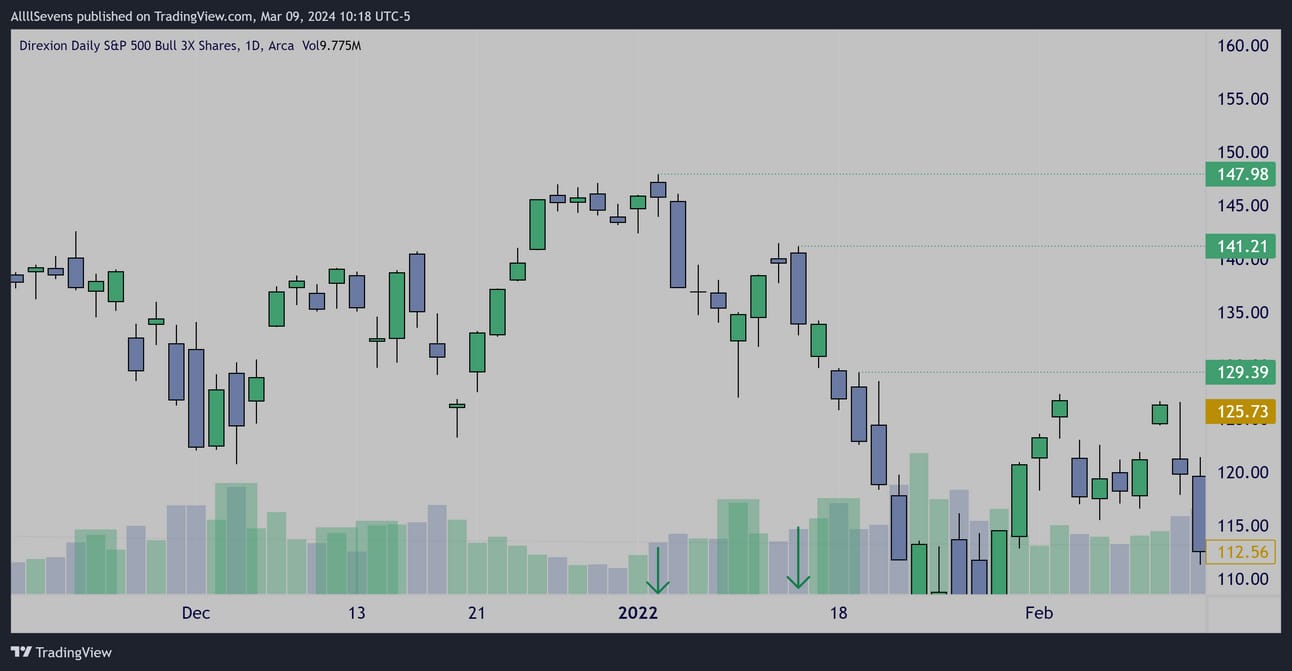
The TQQQ is a 3x leveraged ETF that tracks the QQQ
Institutions were actively accumulating this even at ATH’s in 2022
Increased candle spreads with decreased volume ignited a downtrend creating imbalances between price and volume that should be rebalanced in the future, giving me my “discount levels”
There are imbalances @ $68.18, $77.55, & $87.55
On the QQQ that will be approximately $457.30, $479.90, & $503.85
Monthly
Weekly
Just for your viewing pleasure.
These are TEXTBOOK institutional accumulation patterns that have lead to the current rally. These patterns will occur again and again on future market corrections. Study and be prepared.
Using the TQQQ I have identified imbalances between price and volume that have yet to be fulfilled. $503.85 on QQQ is $87.49 on TQQQ
Long-Term it is extremely obvious we are bullish.
Corrections & pullbacks are not to be feared.
Let’s talk more about the short-term:
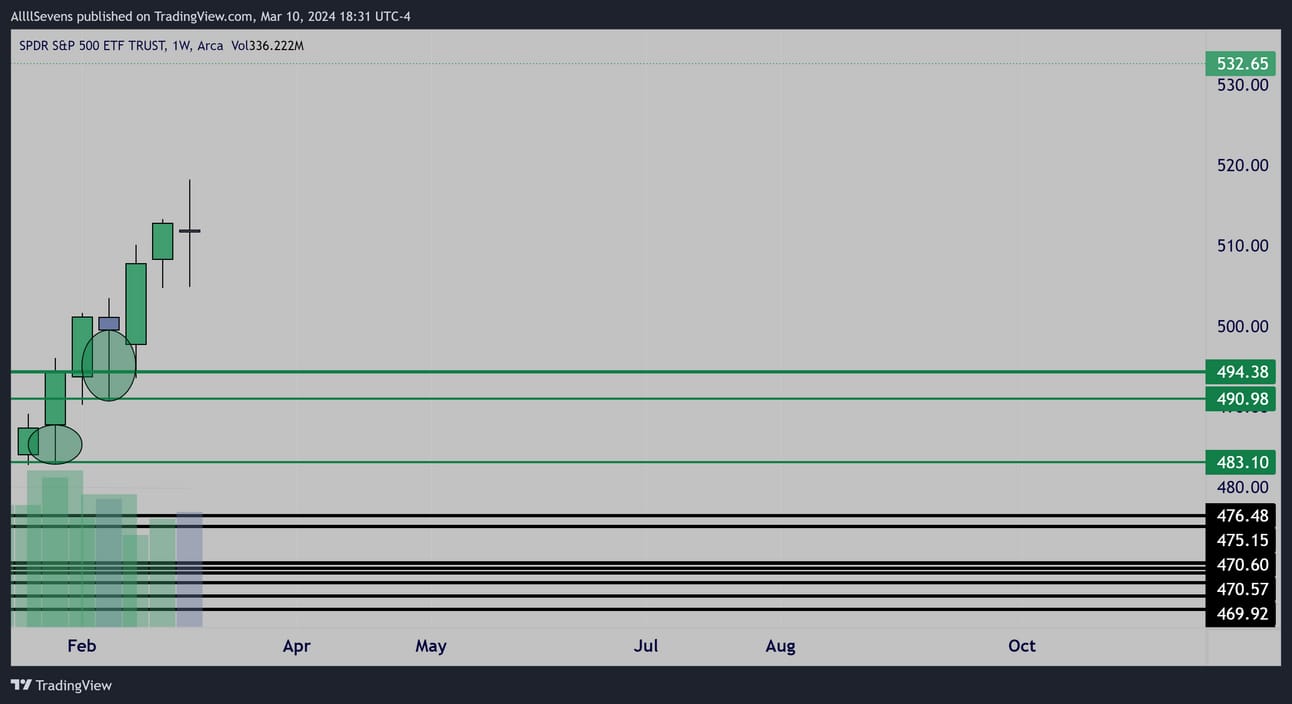
Weekly
Institutional accumulations continue even at these prices.
Makes sense considering it’s trading at a -12.87% discount.
The only people afraid to buy “this high” are scared short-term focused retail investors who aren’t envisioning the bigger picture 20+ year hold.
Even if short-term top were being placed here, everything would be fine.
Just as it was the entire 2022 correction.
Trust me, I wish I was writing this newsletter back then.
Anyways, I said I’d move on the my short-term trade plan:
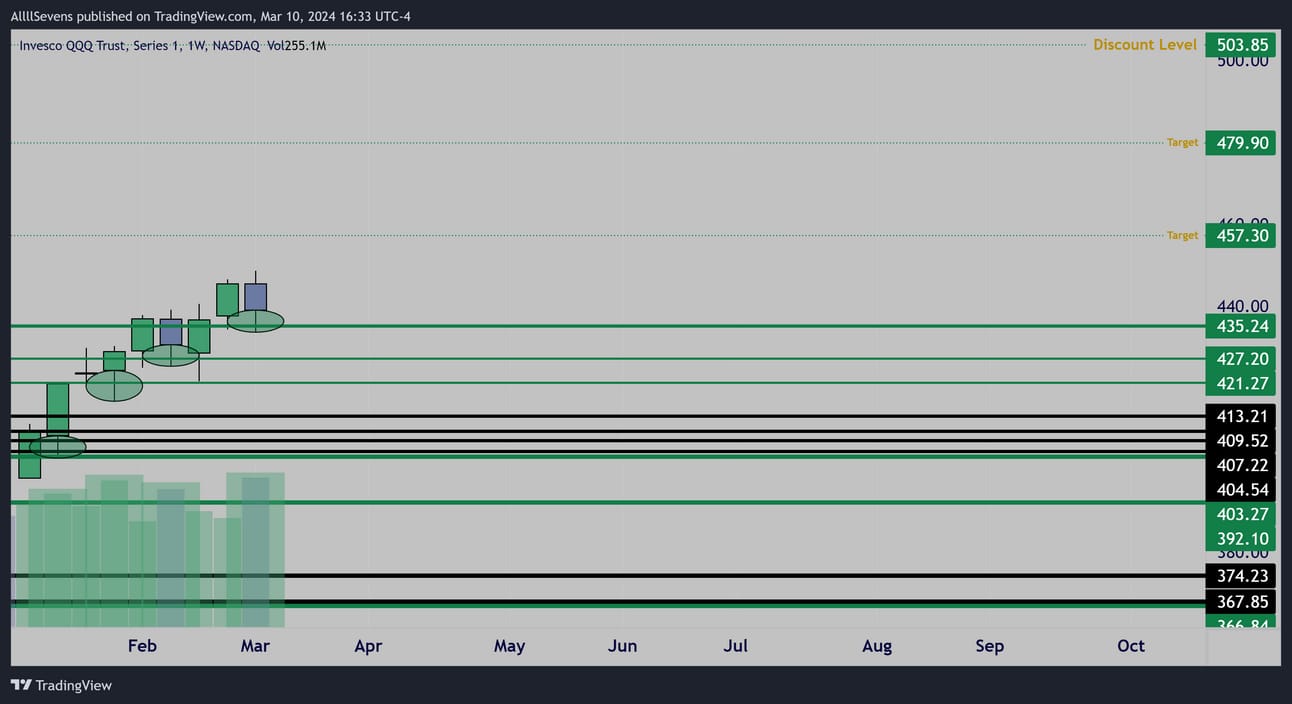
The green levels displayed on the chart above are know institutional buy pivots, likely to act as support.
$435.24 being the largest.
This is the main level to gauge overall strength of the current trend.
Weekly & monthly structure above, and trend is strong.
Weekly & monthly candles begin to close & open below this level, and trend is weakening - a pullback could ensue.
As of now, trend is clearly UP and institutions are actively accumulating.
Until that changes, I’m risk-on. Obviously this will change at some point but there’s no need to be a hero. Odds currently favor more upside.
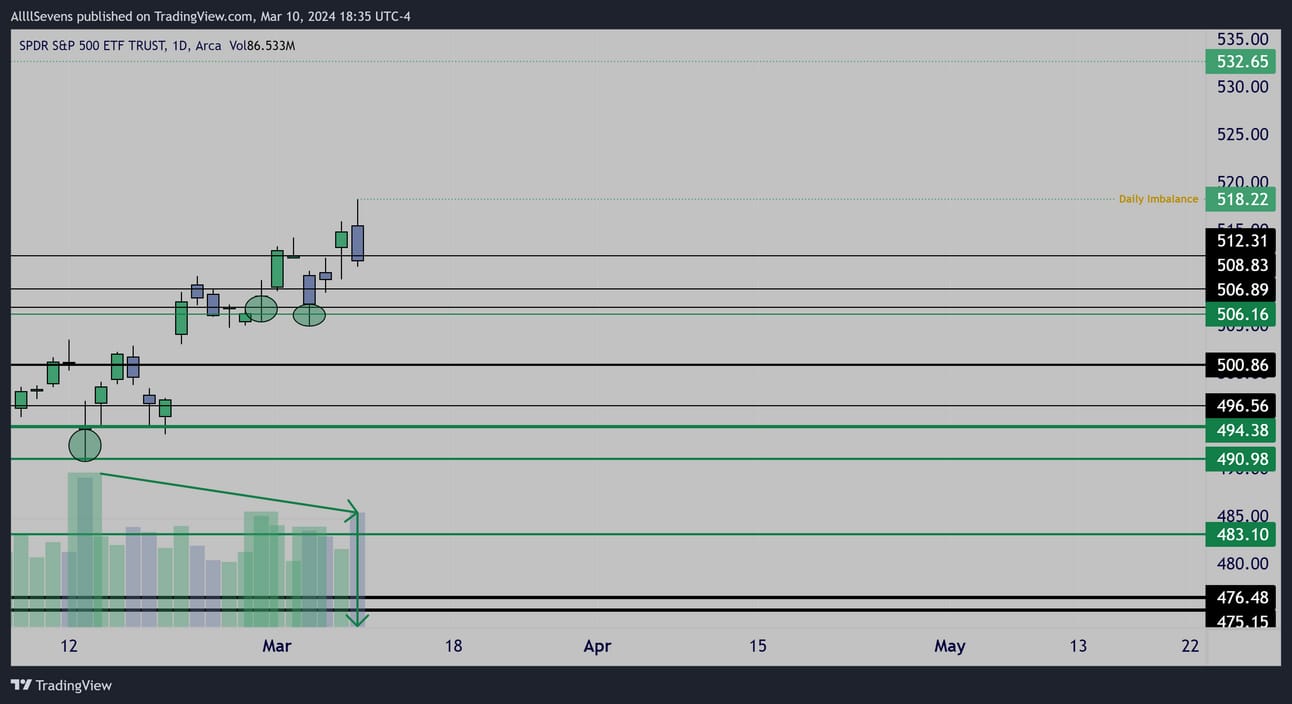
Daily
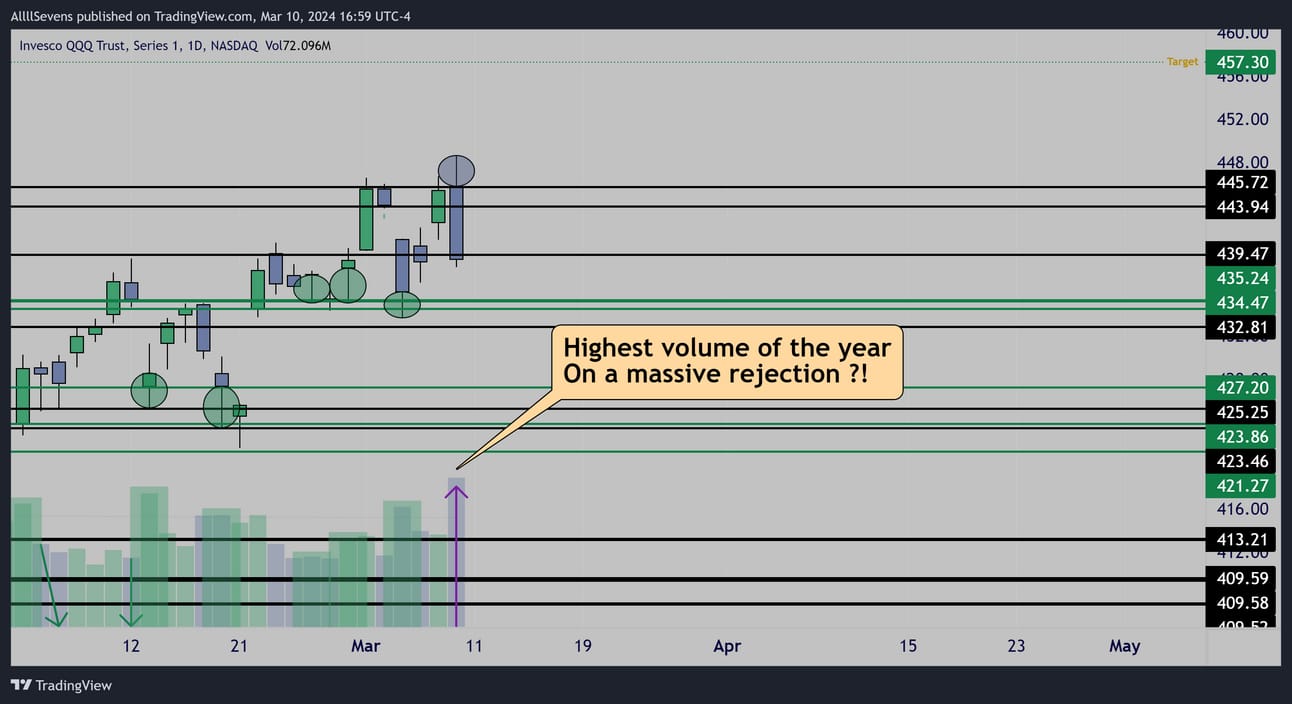
Friday last week the QQQ declined -1.44% from the prior sessions close-
The largest down day since October 25th of last year.
Also the largest volume the QQQ has seen since October 24th.
At first glance, this appears extremely bearish.
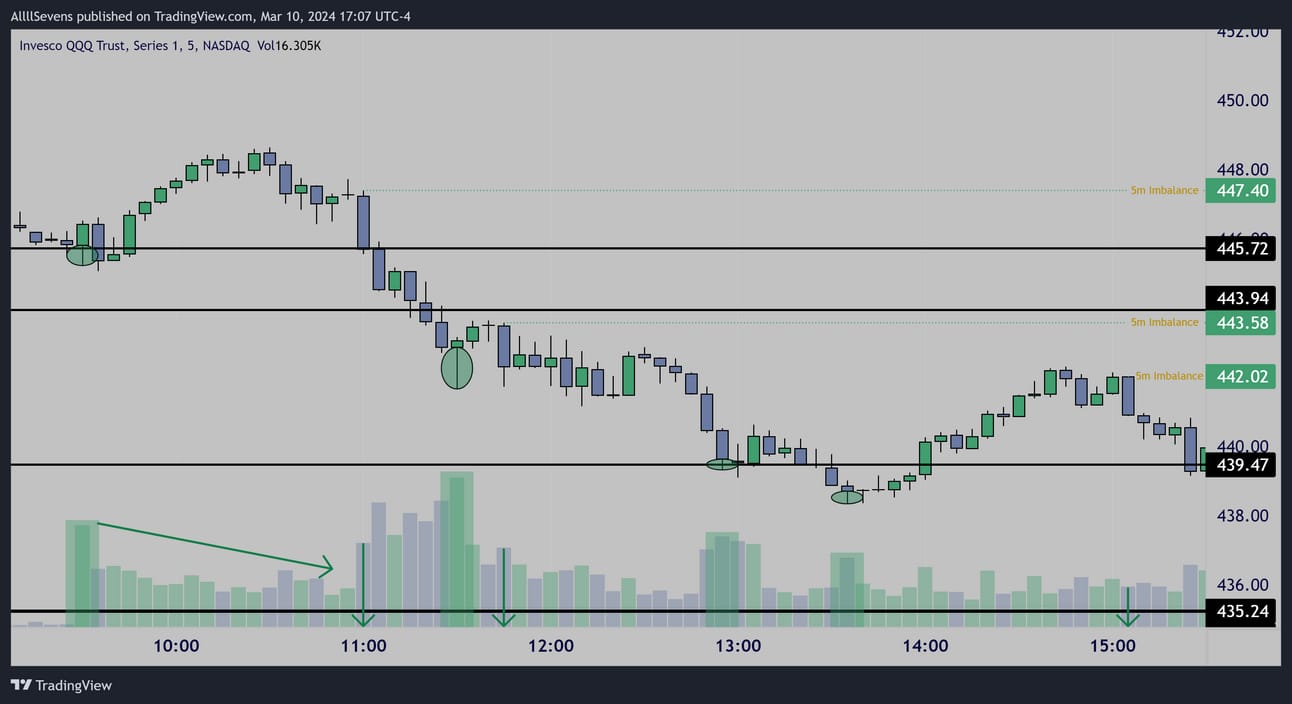
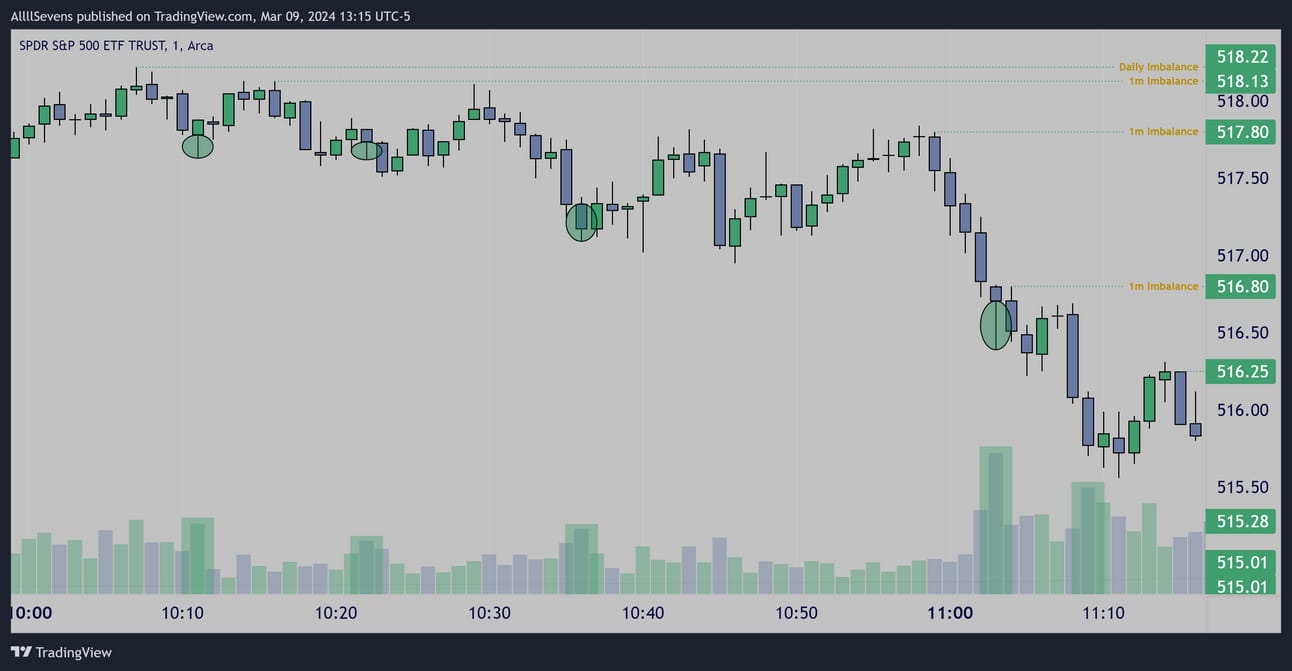
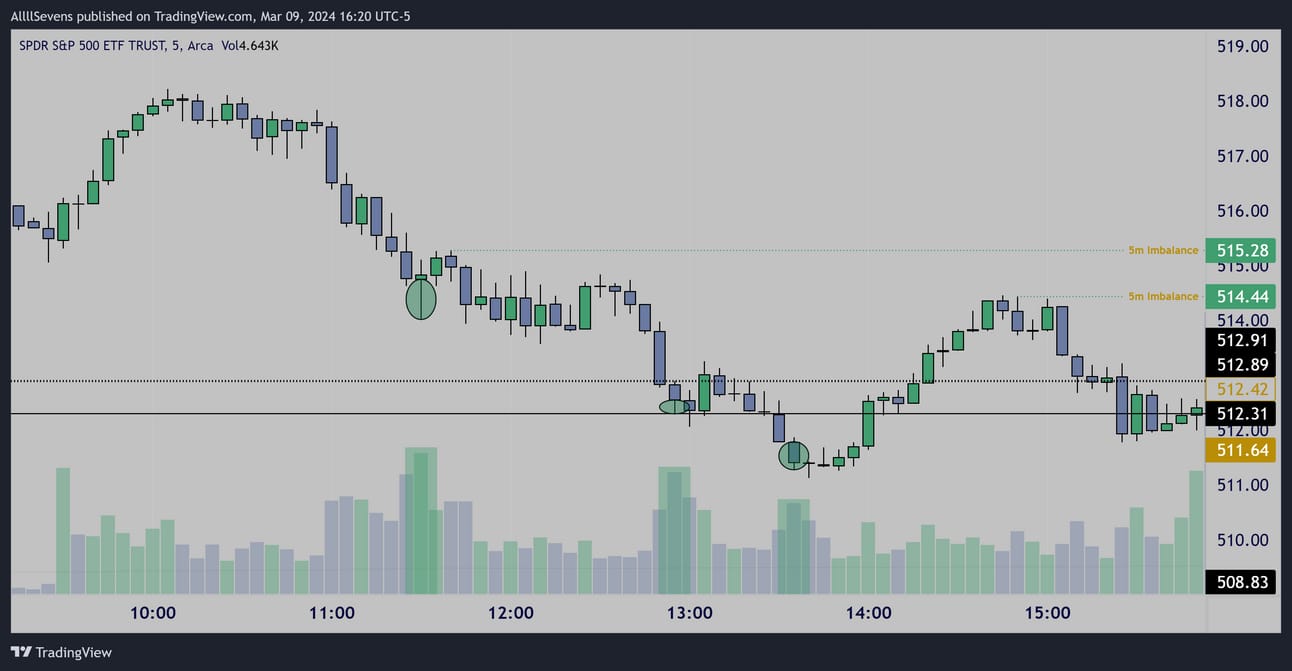
5m Friday 3/08
Upon lifting up the hood, this appears to be a major bear trap.
No volume came in at highs to form the the upper wick on Friday’s candle. This confirms without a doubt no distribution occurred.
All that Daily volume came in as accumulation into the lows.
It’s always a major anomaly when higher volume than the open comes in mid-day. Institutions bought on Friday.
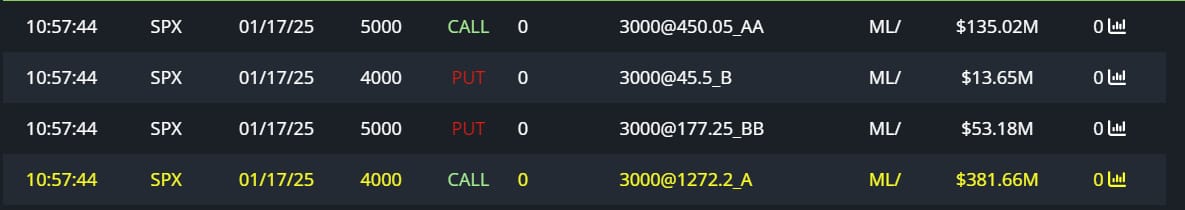
Unusual Options Flow

$3.32M 1/17 384.78p’s Sold
$2.21M 1/17 524.78c’s Bought
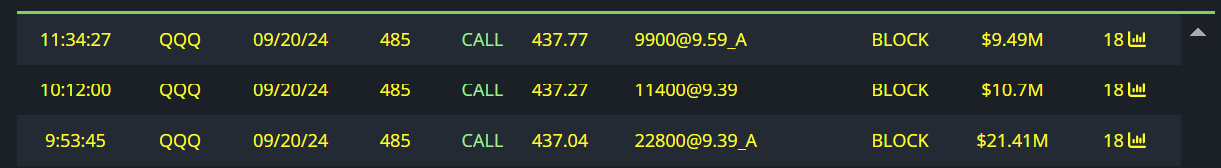
$40M+ 9/20 485c’s Bought

$2.93M 1/16/26 440p’s Sold
$4.72M 1/16/26 440c’s Bought

$3M 12/20 510c’s Bought

$2M 7/19 450p’s Sold
$1.49M 7/19 450c’s Bought

$1.3M 3/15 61p’s Sold
Conclusion
Long-term:
Bullish.
This is a historic time for the QQQ
It’s largest volume in over 10+ years bought the 2022 dip.
There’s no doubting the bigger picture here.
I want to HOLD shares and make small contributions on a daily and weekly basis alongside institutional investors.
As for making large contributions: now is not the time.
Institutions only make larger than normal contributions on monthly pullbacks. That’s not here. The nearest strong Dark Pool demand on a monthly time frame is $392.10-$403.27
Short-Term:
Bullish - Bear trap has been set.
I am calling bullshit on the current highs -
Looking for the current uptrend to continue as long as $435.24 continues to hold on the weekly and monthly candles.
Begin to close below this level, and I will discuss the potential for a short-term top being placed. Until then- The market is bullish short-term and I’m extremely interested in these September 485c’s
SPY
3 Month
Institutional accumulation as soon as the 2022 dip began.
The fact that increasing bullish volumes have appeared not just on the initial accumulation, but after as well, is notable because they don’t appear on the QQQ. Why?
I believe this further supports the idea that while the QQQ saw historic accumulation in 2022 relative to the SPY and will likely continue to outperform with larger % gains-
If and when a pullback occurs, the QQQ will be more volatile.
Institutions are prepared for this by not being as aggressive on their adds since their initial accumulation. They’d prefer to only be aggressive on substantial dips - for their safety. With SPY, it’s easier for them to be aggressive because pullbacks will be less severe.
SPY is currently trading at a -5.56% discount below $541.85
From there, I see minimum upside potential of +34.91% to $731
Where am I getting this $451.85 discount level?
Daily
The SPXL is a 3x leverage ETF tracking the SPY
It displays imbalances between price and volume @ $141.21 & $147.98
That will be approximately $532.65 & $541.85 on the SPY itself.
Same concepts used to determine the QQQ discount level-
And the same concepts I will use throughout this newsletter.
Monthly
Textbook accumulation patterns.
Before I move on, I want to talk about the fact that retail participants move price in the short-term. After almost every large institutional accumulation, a much lower volume candle moved price substantially further down! In the moment, those false moves can be extremely unsettling if you do not understand that i’s normal and short-term fluctuations are meant to scare you out.
Due to the somewhat unpredictable nature of these false moves, it’s why long-term investors will beat 99% of short-term traders.
Short-term fluctuations do NOT follow volumes at all times, and when you don’t accept this, and you don’t work around it, the market makes no sense! You’re always chasing price rather than stalking patiently for imbalances between price and volume to be created and then taking calculated risks betting on a rebalance.
That’s my edge in the market.
Inefficiencies or “imbalances” between price and volume.
The same accumulation patterns seen on the monthly chart above-
They display themselves on all time frames.
On the monthly example, it has took two tears for the “trade” to play out.
When 5m or 15m accumulation patterns are visible intraday, like on Friday last week, it’s important to remember that it sometimes it takes a considerable amount of time for them to play out
Let’s talk more short-term:
Weekly
No big levels nearby like the QQQ with it’s pivot at $435.24
An increased volume inside candle favors a potential downside reversal.
Not actionable of course, with no resistance to play off of, plus, just like QQQ the overall sequence here is bullish. It’s something to be aware of.
It gives off the same bear trap vibe as the QQQ
A dip to $494.38 would be incredible.
That would mean QQQ really shaking aggressively to the downside…
A dip would need to get ate on extremely high volume in order to maintain the current short-term trend.
We’ll see if we get that lucky…
It would really be something if there is no substantial dip next week and trend just continues. It’s definitely possible given both indices are over their main pivots $435.24 & $494.38. That’s why you aren’t hearing me humor the idea of a short-term top unless I see more.
Daily
I immediately notice the imbalance created on Friday’s ATH rejection.
That candle is much larger than the 2/13 accumulation…
Yet, is has less volume. That’s a retail sell-off.
1m Friday (3/08)
The 1 minute tape on Friday confirms.
Accumulations & imbalances created before & after the sell-off.
Friday’s movement was not as bearish as it seems. People sold. But not institutional investors. Not smart money. Only retail participants.
5m Friday (3/08)
The 5m tape shows it best- just like on the QQQ
No volume came in at the highs of the session, it was all on the dips.
Unusual Options Flow
$583M Full Risk Bull
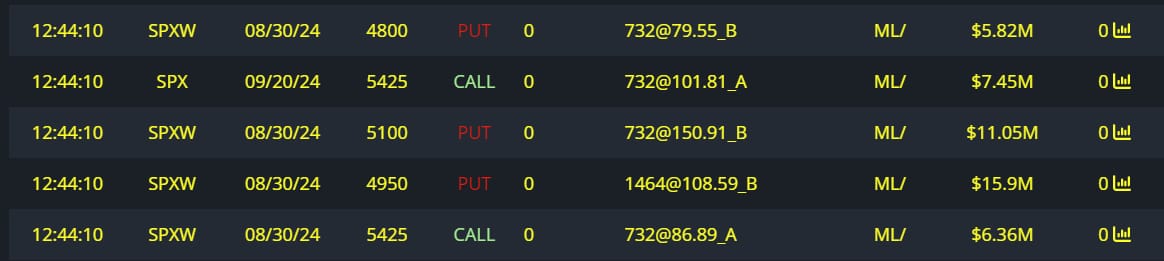
$46M Full Risk Bull

$1.6M Full Risk Bull

$1.2M Calls Bought

$970K Calls Bought

$600K Calls Bought
Conclusion
Long-Term:
Bullish.
This is clearly not the time to be selling out of the market.
It’s also clearly not the time to make SIZABLE contributions.
I want to to do that on monthly pullbacks.
I do want to make small daily & weekly contributions.
Short-Term:
Bullish - a bear trap has been set.
I’m looking for trend to continue up as long as $494.38 is respected on the weekly and monthly time frames. While the weekly candle shows a potential downside reversal patter, no volume actually points down-
Friday’s rejection is a hoax, so I am looking to go long.
I don’t know if there will be a big drop- or a little drop.
A small drop to the $506.16 support or above would be best case scenario. That would line up perfectly with the QQQ at it’s MAJOR pivot $435.24. If trend wants to remain STRONG this week, these levels get respected.
If they get lost, large volume gaps open up below.
In that case, the downwards momentum could lead to the perfect HIGH VOLUME climax that would be needed to recover into EOW and hold the $435.34 on the QQQ.
If this second scenario occurs and no climax occurs, short-term may be in some trouble which I’d discuss in the next newsletter.
Till that actually happens, I do fully expect this hyper bullish scenario on both indices.
IWM
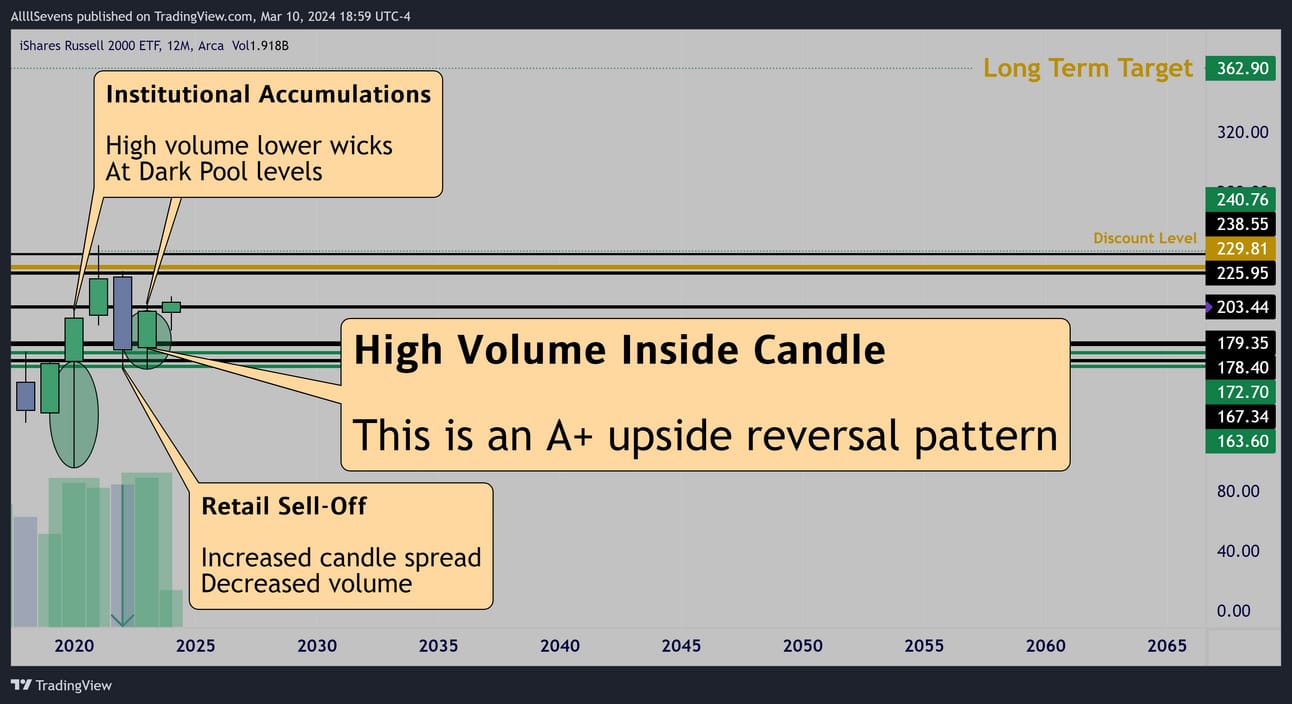
Yearly
This is as A+ as a yearly sequence can get.
High probability of upside continuation over the next few years.
$172.70-$179.35 nearest strong Dark Pool demand.
$203.44 is the pivot for a breakout.
IWM is currently trading at a -14.09% discount below $240.76
From there, I see minimum upside potential of +50.72% to $362.90
P.S.
You can find this same yearly reversal pattern on a lot of small-cap names…
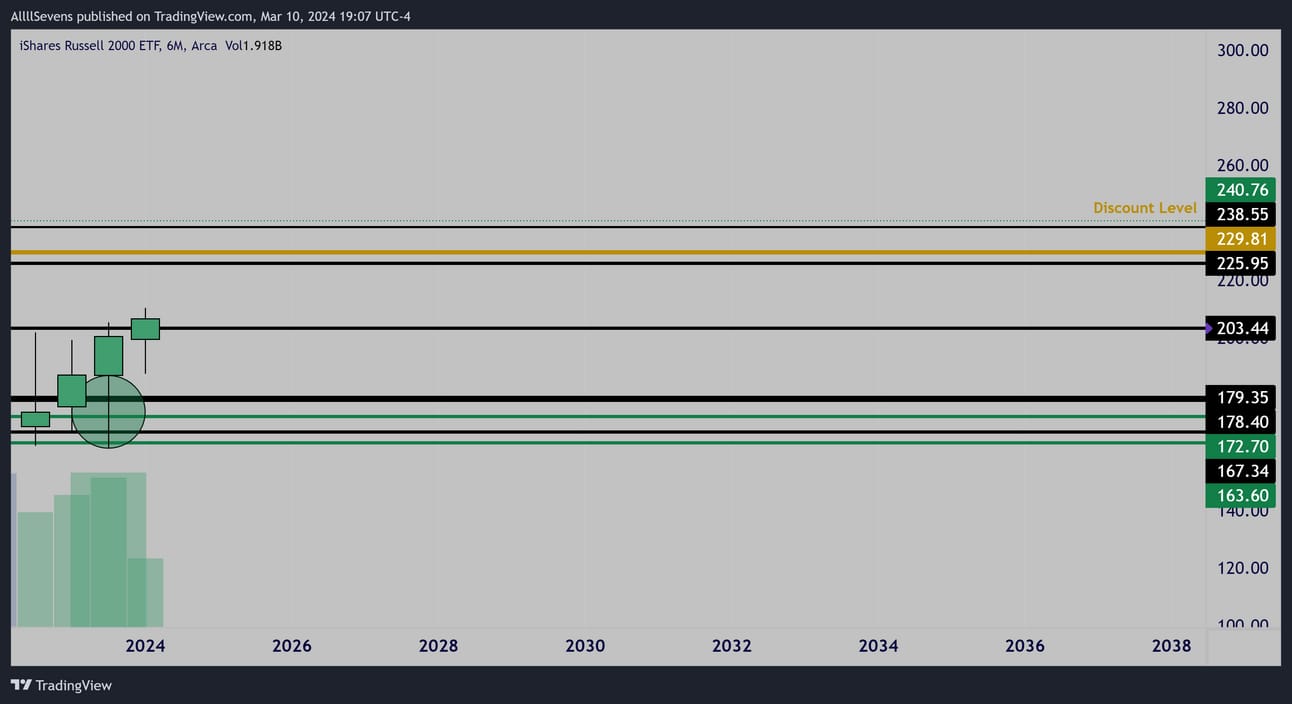
6 Month Bullish Engulfing With Volume
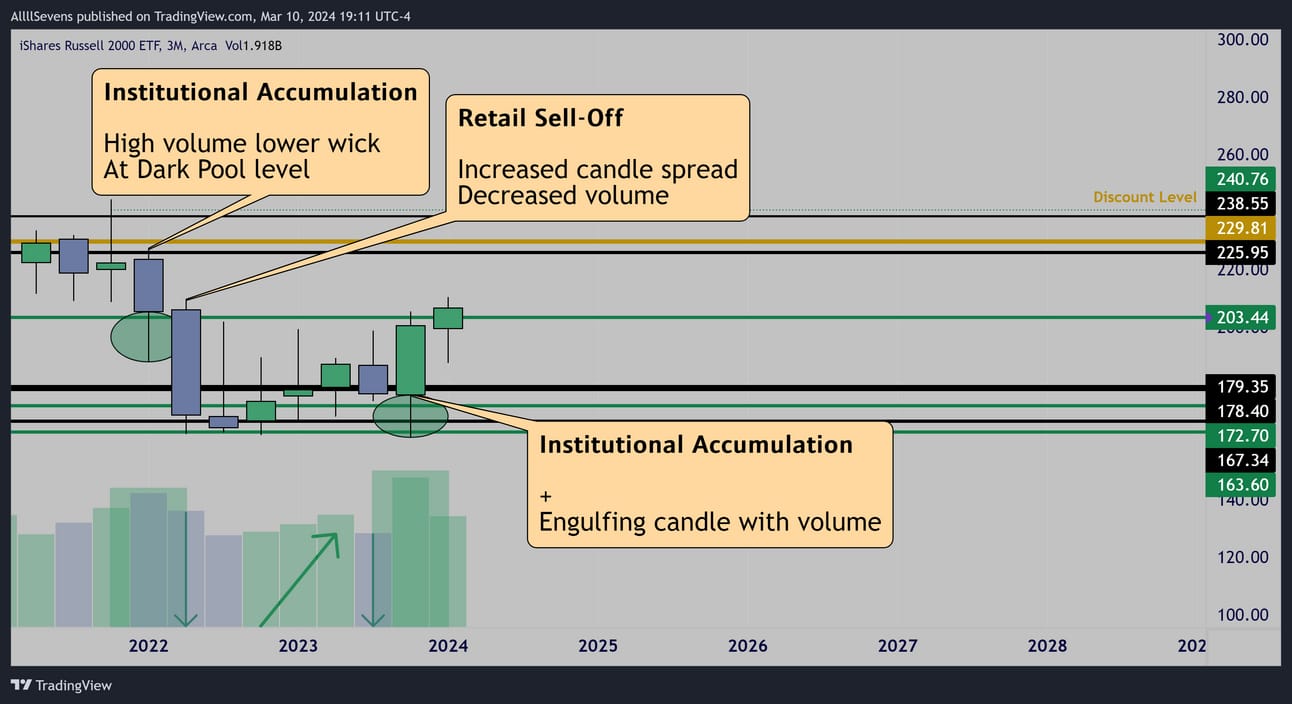
3 Month
Just like SPY and QQQ - huge accumulation at the start of 2022
Price now attempting to reclaim this previously accumulated level with literally the most volume-price-momentum it could possibly have.
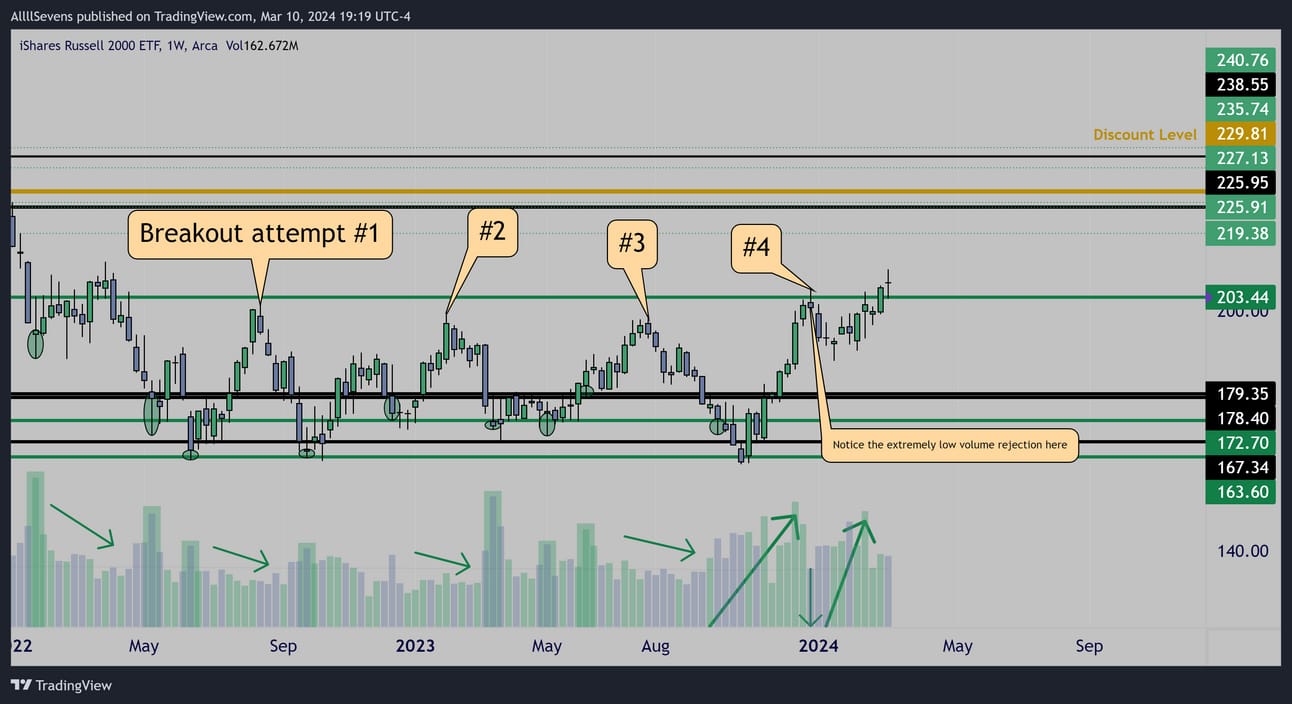
Weekly
Price has attempted to break out from $300 3x already. Failed each time.
Notice the difference this time around?
previous attempts all had low volume.
This one has extremely high volume.
Every time frame is lined up for this to make a serious breakout this year.
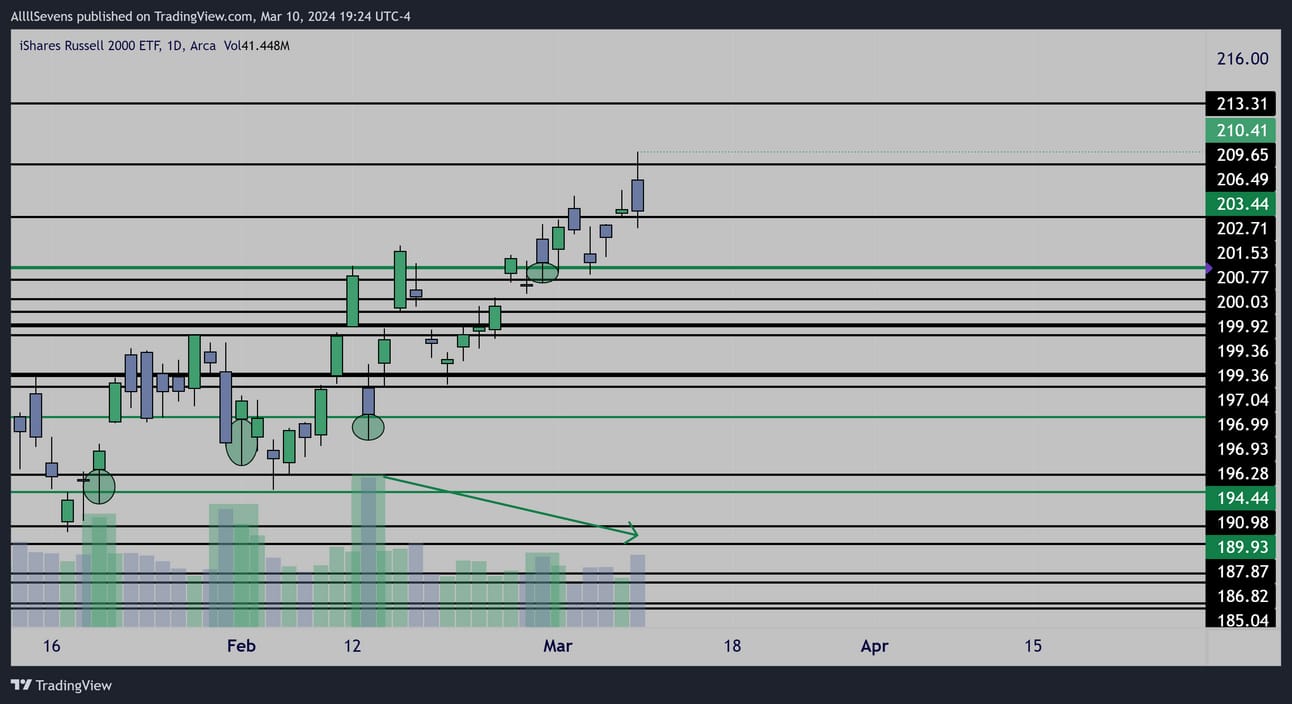
Daily
Just like on SPY -
Friday’s rejection is a clear imbalance being created.
Unusual Options Flow

$3.38M 12/18/26 275c’s Bought

$5.9M 12/20 214c’s Bought
Conclusion
Long-Term:
Bullish.
Wow, what a setup we have here.
Same exact story as the SPY and QQQ , during uptrends isn’t the time me or institutions are adding SIZABLE longs. It’s a time when we are looking to make regular contributions on pullbacks.
Short-Term:
A yearly, 6 month, & quarterly breakout is in progress.
$203.44 is the level that needs held on the monthly and weekly for momentum to remain strong.
I think worst case scenario is this level doesn’t get held into EOM for some reason and the quarterly candle forms an inside bar which will be a high probability upside continuation pattern into July.
KRE
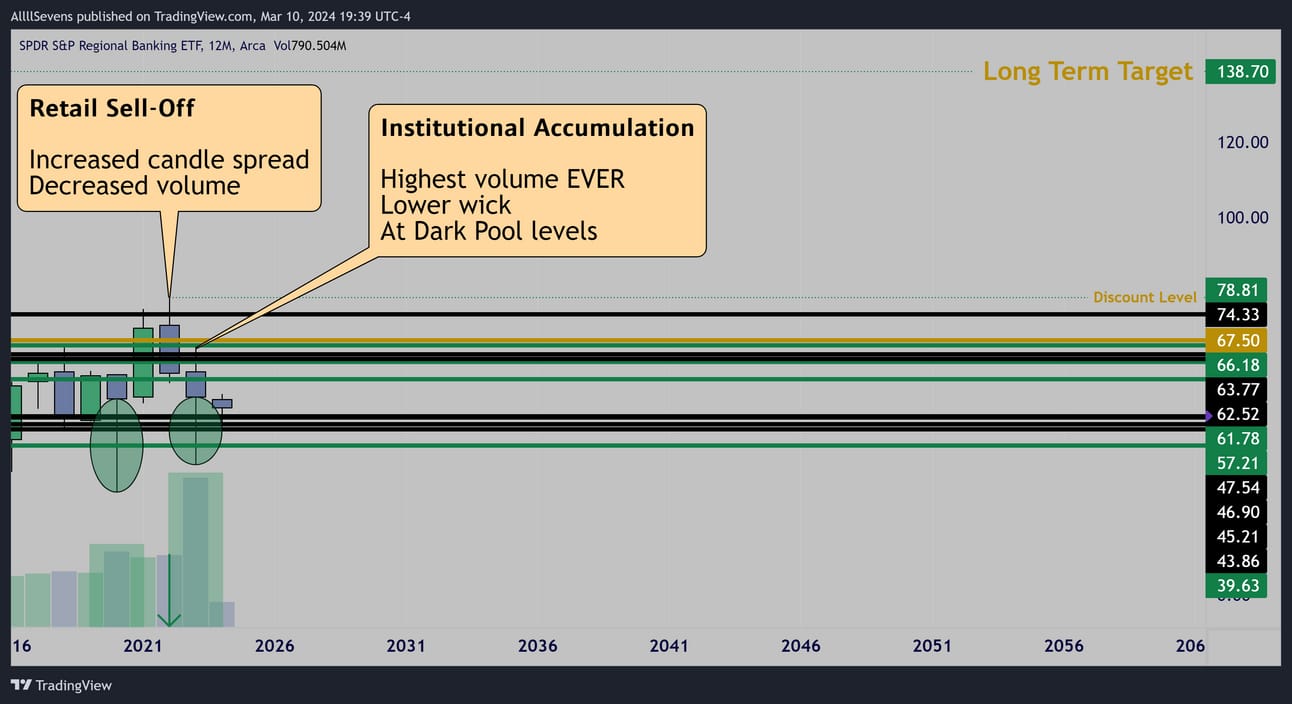
Yearly
The highest volume EVER for this ETF coming in as a blatant accumulation at a previous area of accumulation -
Following a retail rejection in 2022
This chart. Is insane.
KRE is currently trading at a -37.10% discount below $78.81
From there, I see minimum upside potential of +75.99% to $138.70
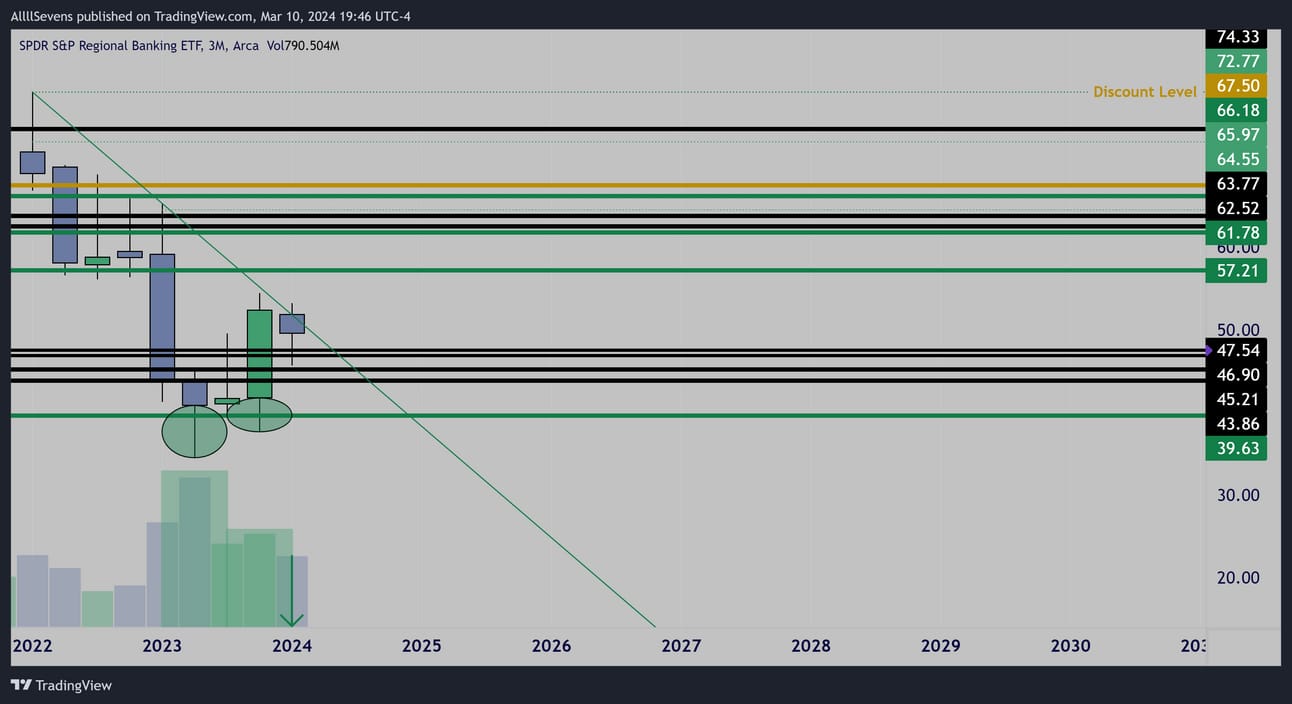
Quarterly
We’re working with the highest volume ever reversing price at lows-
Solid volume breaking over resistance and now facing a downtrend…
A low volume inside candle consolidation is A+ for this to see a breakout into this July as long as support is held.
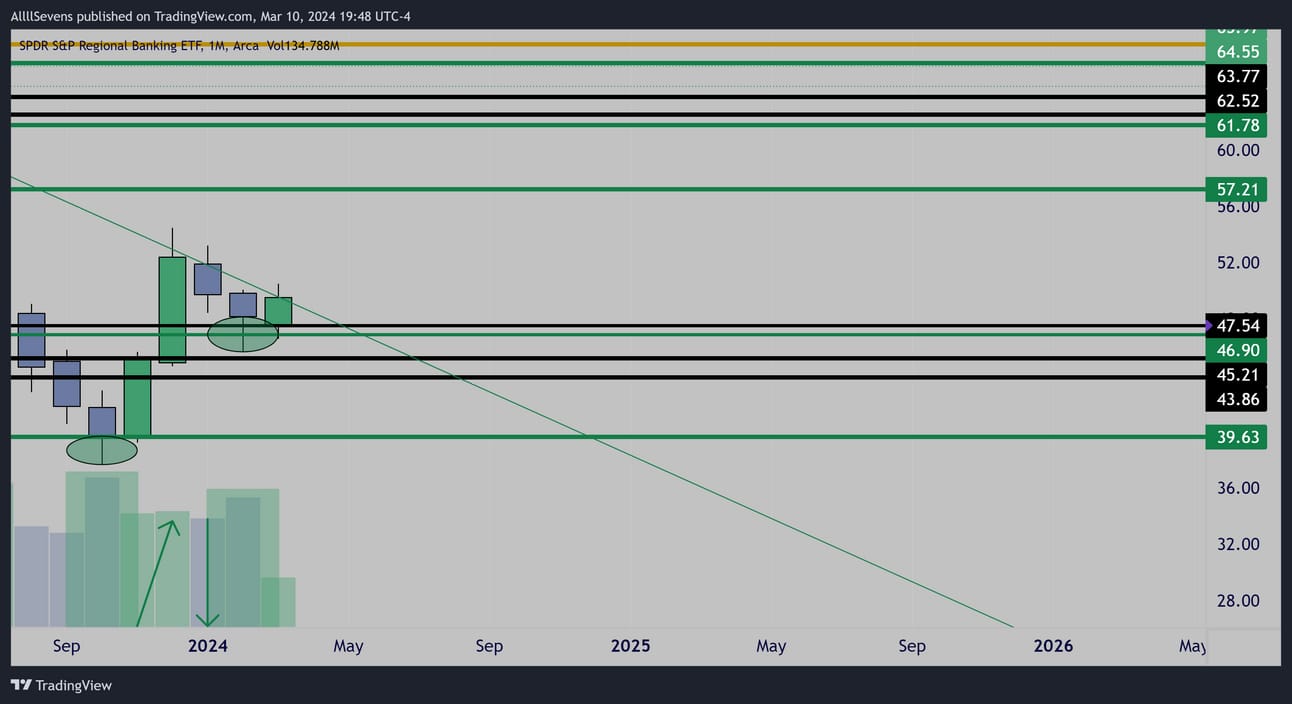
Monthly
Active SIZABLE contributions by institutions last month!
Extremely notable.
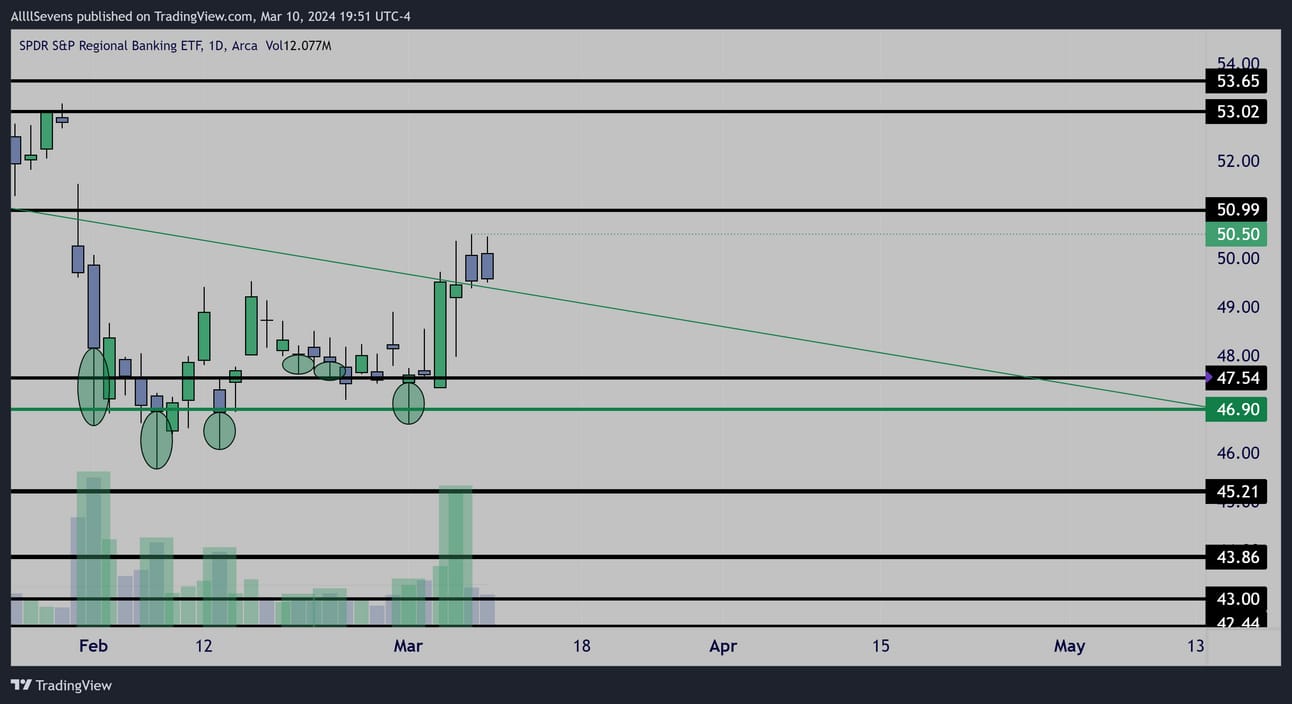
Daily
Active Daily accumulations.
Strong Dark Pool demand below if this pullback and wants to make an inside quarter / month rather than going for the breakout.
Imbalance created on the recent rejection.
Unusual Options Flow

$5.76M 1/16/26 55c’s Bought

$3.24M 12/18/26 50p’s Sold

$1M 9/20 54c’s Bought

$1M 5/17 52’s Bought
Conclusion
Long-Term:
Bullish.
Unlike the ETF’s above, this experienced a pullback over the last month and institutions made sizable long-term contributions.
I’d like to do the same. I see a lot of long-term opportunity here with the highest volume EVER coming in on the yearly candle.
Short-Term:
This is looking perfect for a breakout into July as long as the support below is held.
XBI
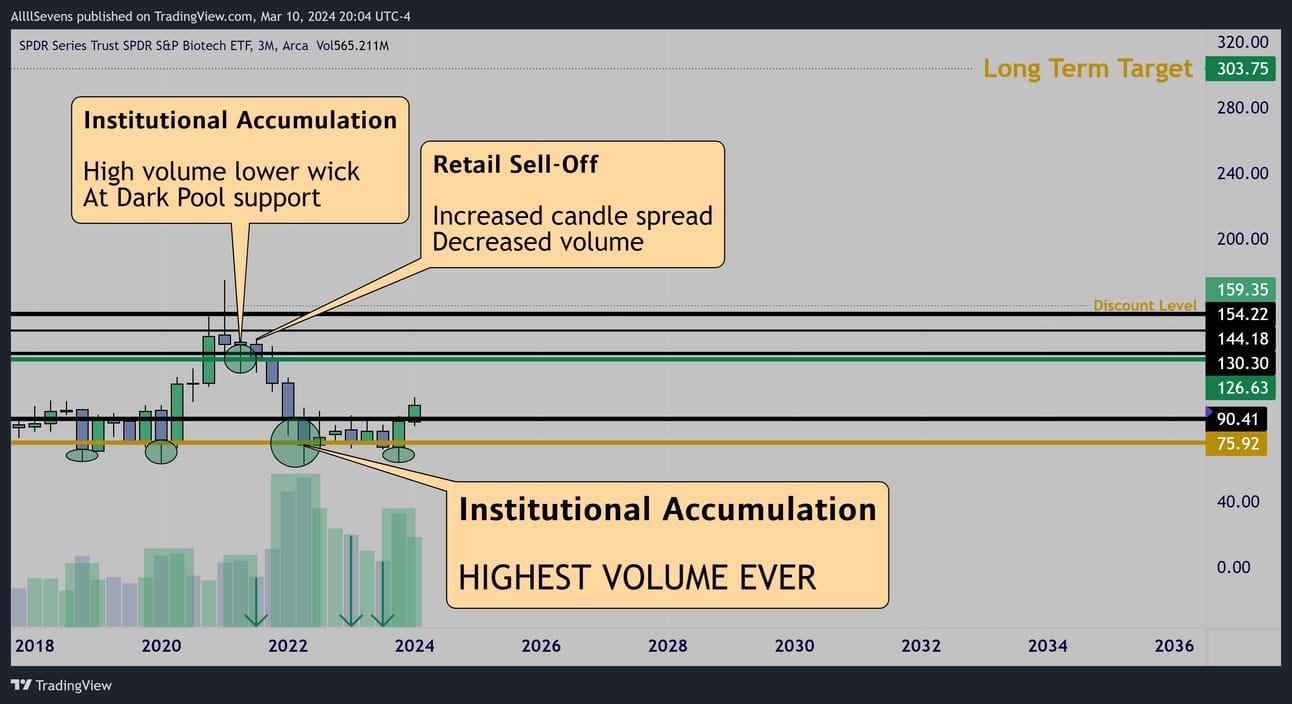
3 Month
The XBI began it’s correction in 2021
When everything else collapsed in 2022, this saw it’s bottom-
On it’s highest volume EVER
If IWM can maintain it’s momentum on this yearly reversal patter, I bet the XBI is an absolute monster and will lead to the upside.
XBI is currently trading at a -37.90% discount below $159.35
From there, I see minimum upside potential of +90.62% to $303.75
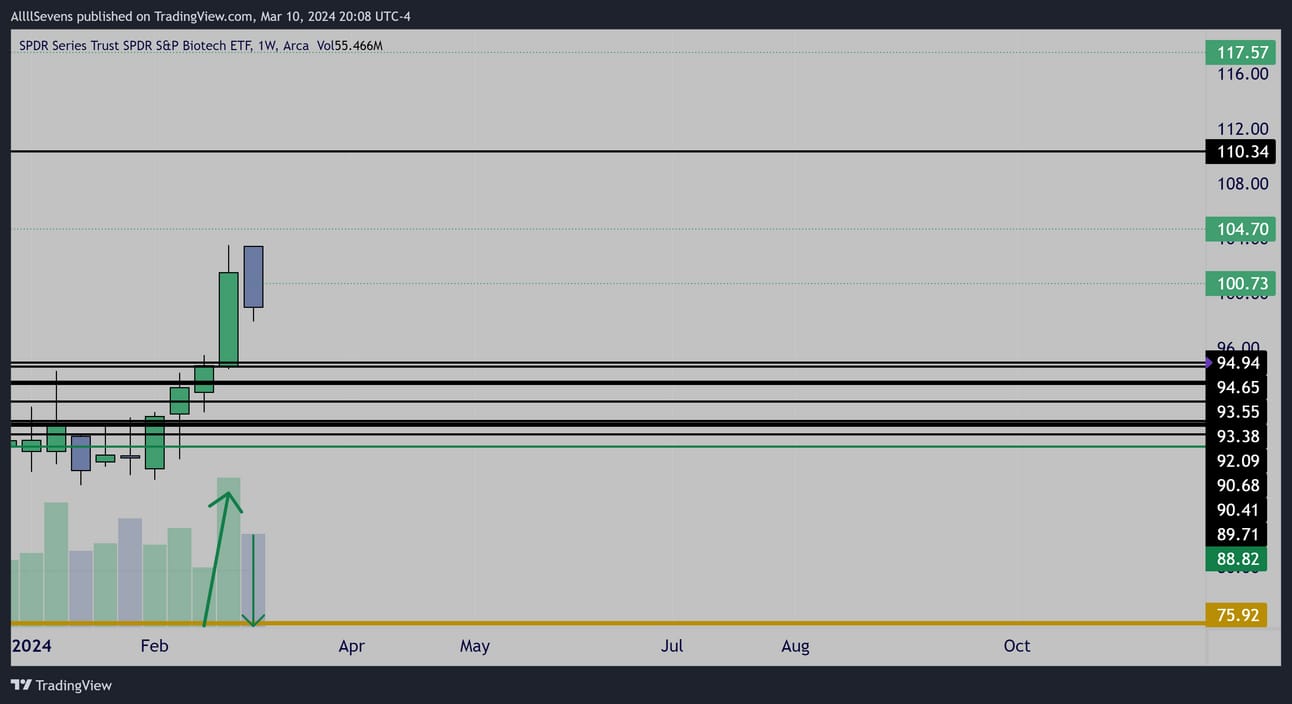
Weekly
The weekly is going for a breakout over $88.83-$94.94 which is a STRONG demand. I watched the tape on the XBI for the last two months and there was HEAVY accumulation all throughout that range.
Before I conclude on this one-
I need to give further conviction on how serious the long-term upside potential is here.
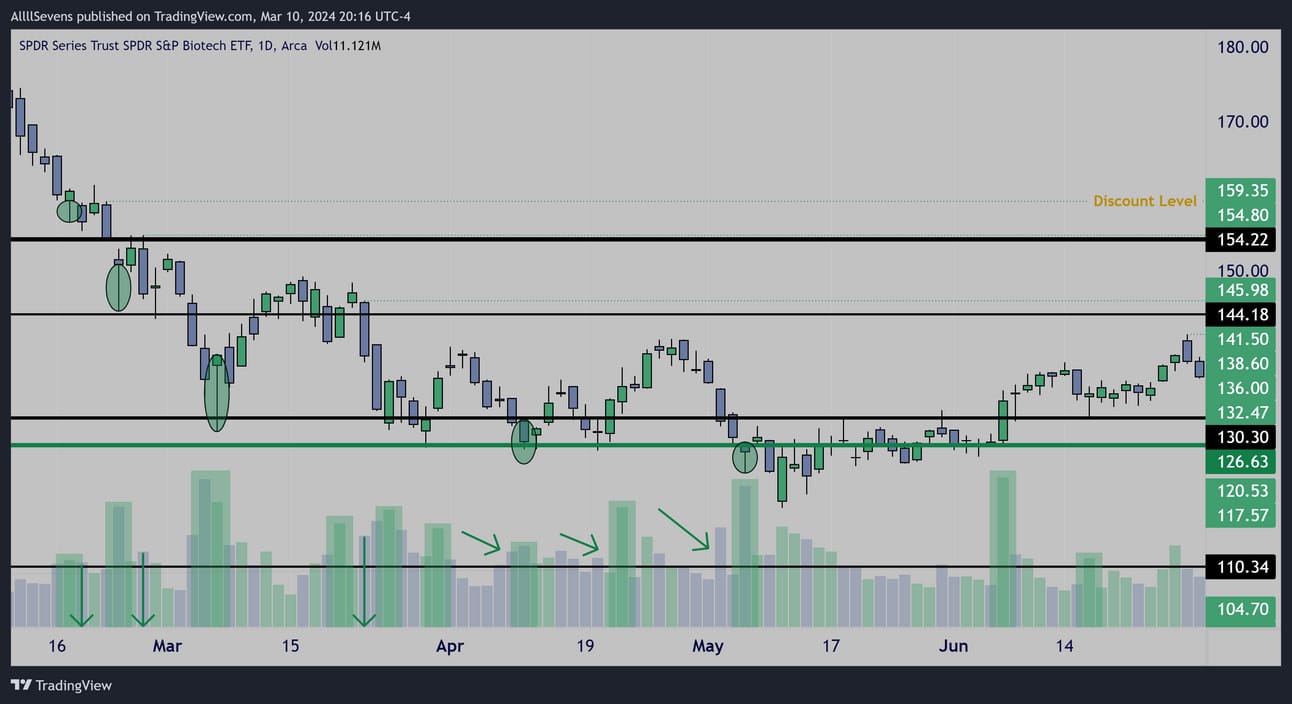
This was LOADED in the $130’s shown here on the Daily re-enforcing the quarterly accumulation candle up at these levels.
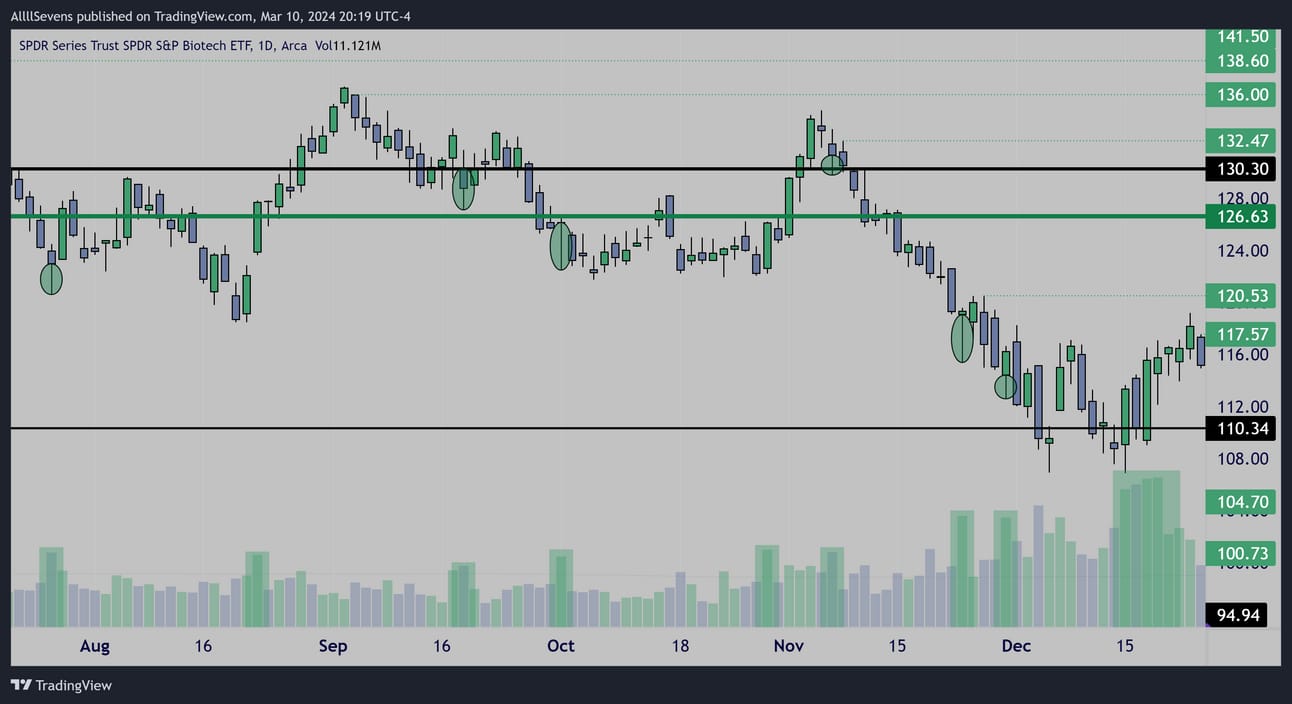
Daily
It was also loaded at $110
Conclusion
Long-Term:
Bullish.
This is trading at a major discount and has extremely high upside potential. Being in the process of a potential breakout, this isn’t where I want to add sizable longs - just regular contributions.
Short-Term:
I expect the $88.80→$95 area to act a support for a strong breakout here over the next year.
XLK
The Technology Sector - 30.20% weight in the SPY
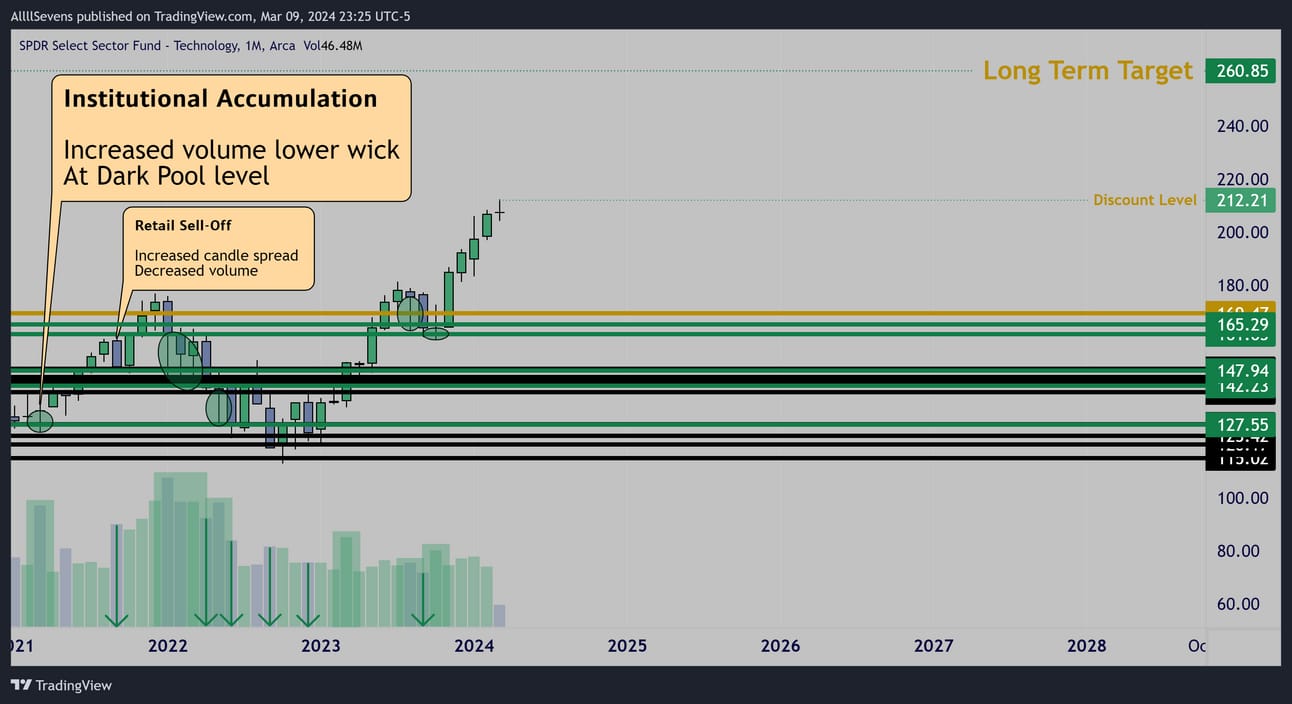
Monthly
Incredible accumulation during took place here prior to the current rally.
I wish I was writing this newsletter back then!
Currently trading at a -2.29% discount below $212.21
From there, I see minimum upside potential of +22.92% to $260.85
Strong Dark Pool demand @ $161.65-$169.47
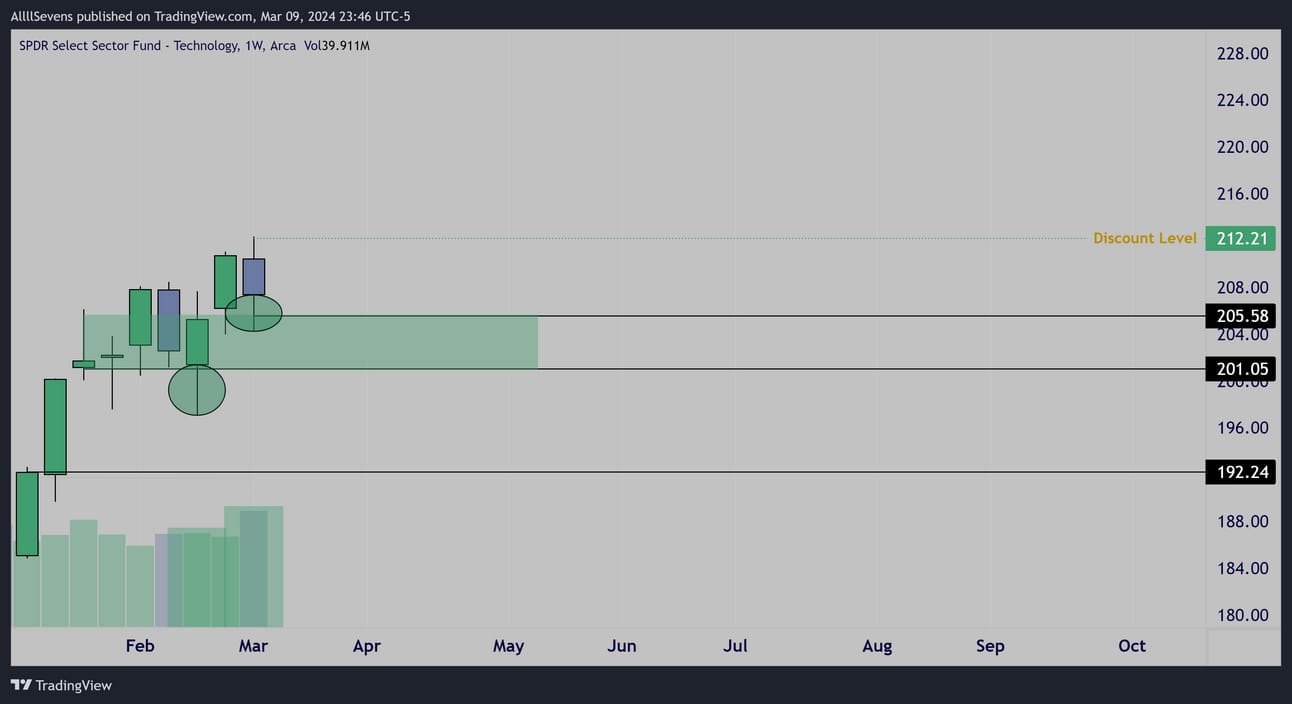
Weekly
Demand zone @ $201.05-$205.58
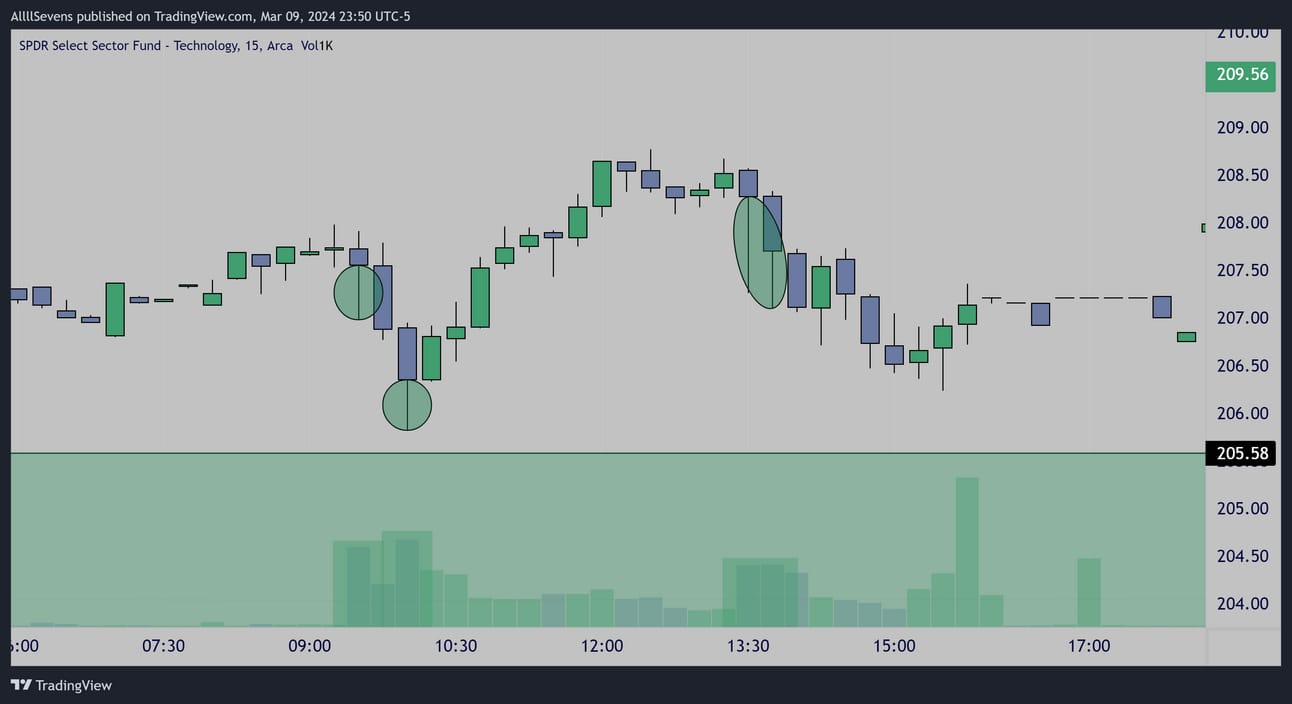
15m Wednesday 3/06
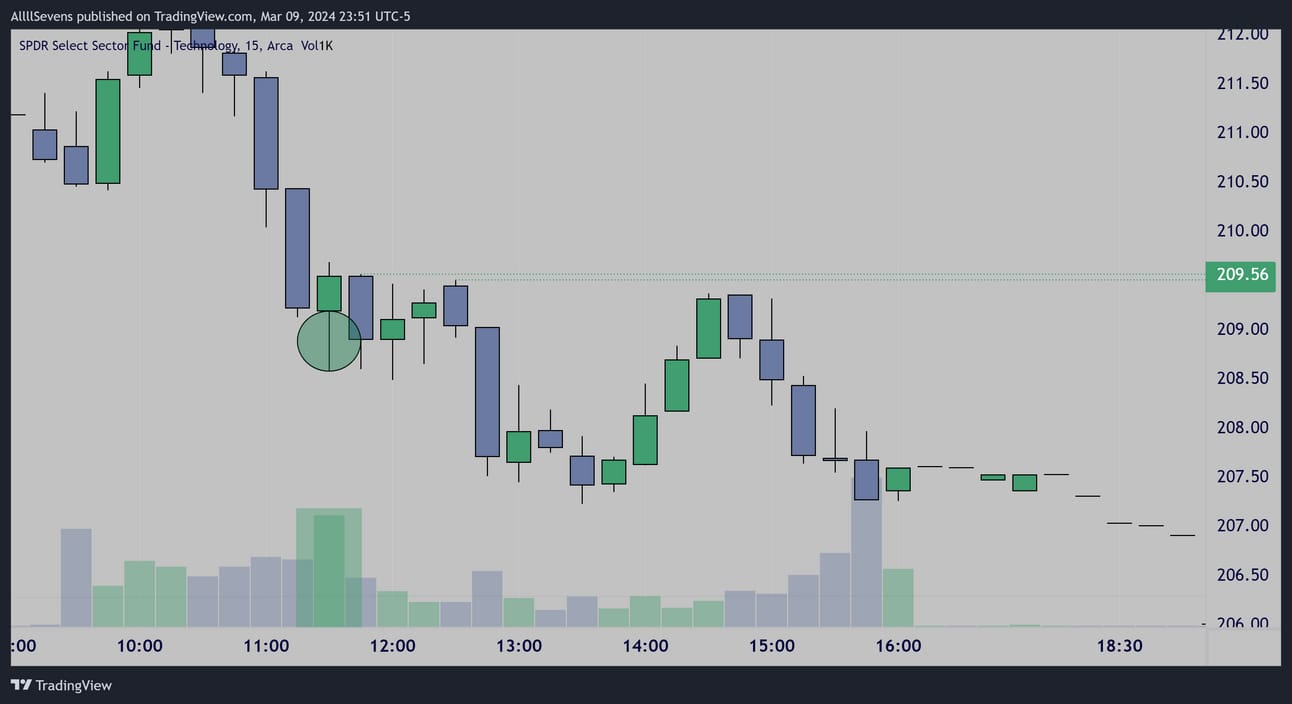
15m Friday 3/08
Intraday tapes during these two sessions last week confirm the weekly accumulation wick out of this demand. Institutions are NOT selling here.
Conclusion
Long-Term:
This clearly still has more upside potential, but it’s not very discounted and it’s pretty extended from any major levels.
Not my focus for sizable long-term adds.
Short-term:
A market leader and if the demand formed @ $201.05-$205.58 can hold thus can continue to be lucrative to the upside.
Below, and hopefully we’d get monthly pullback.
XLF
The Financial Sector - 12.89% weight in the SPY
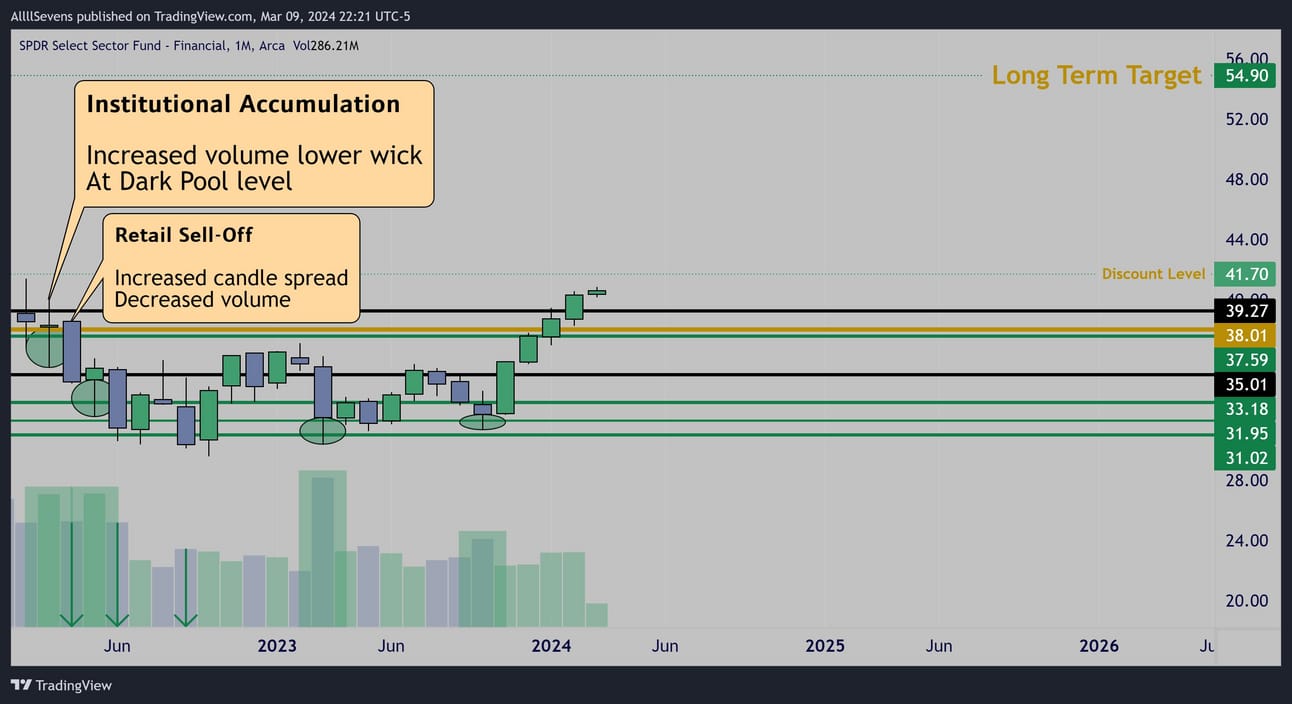
Monthly
This is one of the most textbook institutional accumulations in the history of the stock market. Currently trying to catch up to the SPY and breakout to ATH’s, finally reclaiming it’s final Dark Pool levels.
Currently trading at a -2.59% discount below $41.70
From there, I see minimum upside potential of +31.65% to $54.90
Strong Dark Pool demand @ $37.59-$38.01
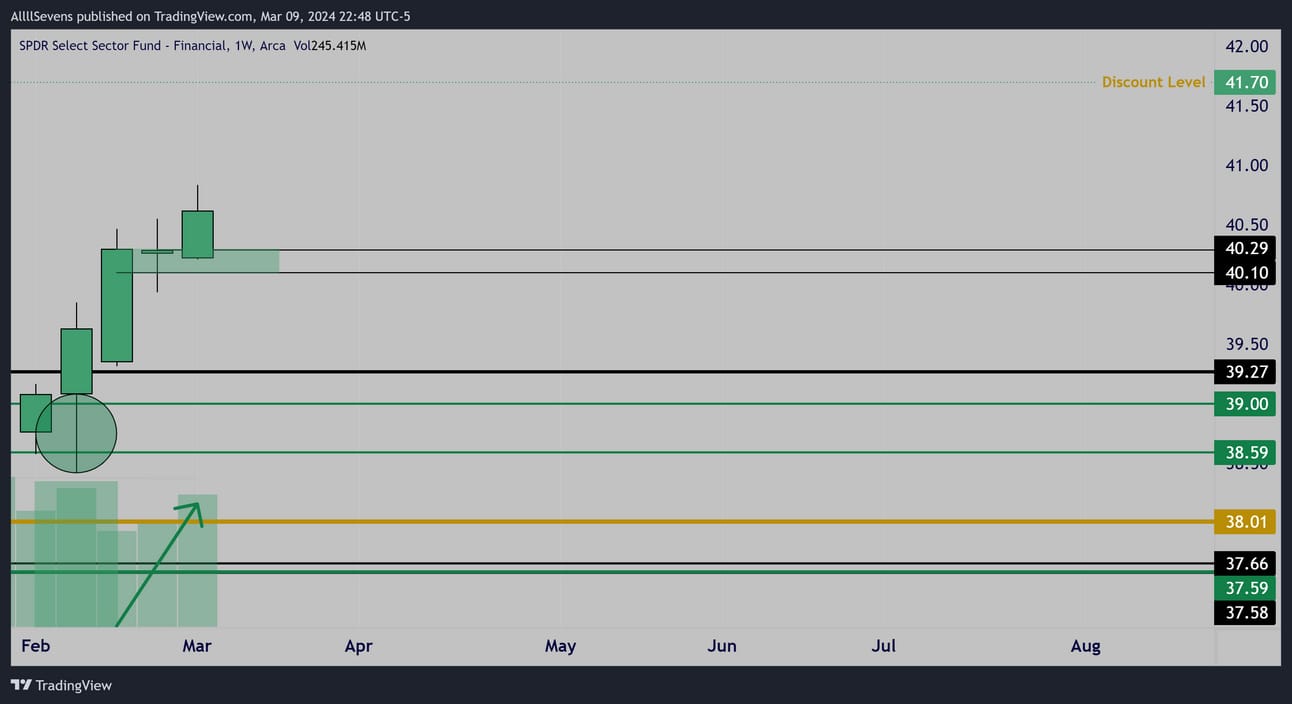
Weekly
Strong Dark Pool demand @ $38.59-$39.00
Breaking over Daily zone $40.10-$40.29 with a bullish engulfing candle.
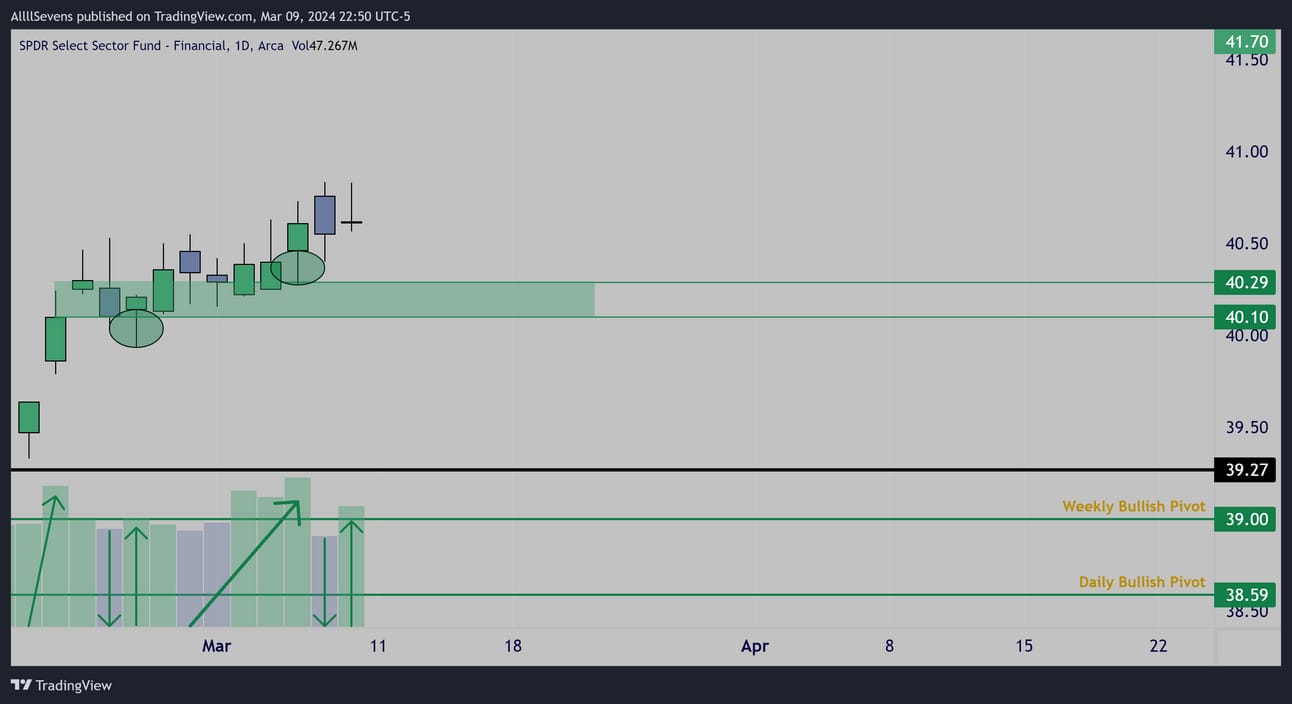
Daily
Demand formed @ $40.10-$40.29
Unusual Options Flow

$12.73M 12/19/25 37c’s Bought

$5.25M 6/20/25 37c’s Bought
Conclusion
Long-Term:
Currently going for a breakout and not on a large discount so not my #1 focus for any sizable contributions unless the breakout Dark Pools get retested- In that case, I’d love to add size here.
Short-Term:
A multi-year accumulation phase breakout in progress.
This could be HUGE and emerge as a major market leader.
Will it retest the breakout? I have no idea.
I think it’s worth adding here in the case that it potentially does not-
Managing risk based on the current Daily demand zone that has formed.
If that gets lost- awesome.
A retest of the monthly breakout would be an amazing gift.
XLV
The Healthcare Sector - 12.53% weight in the SPY
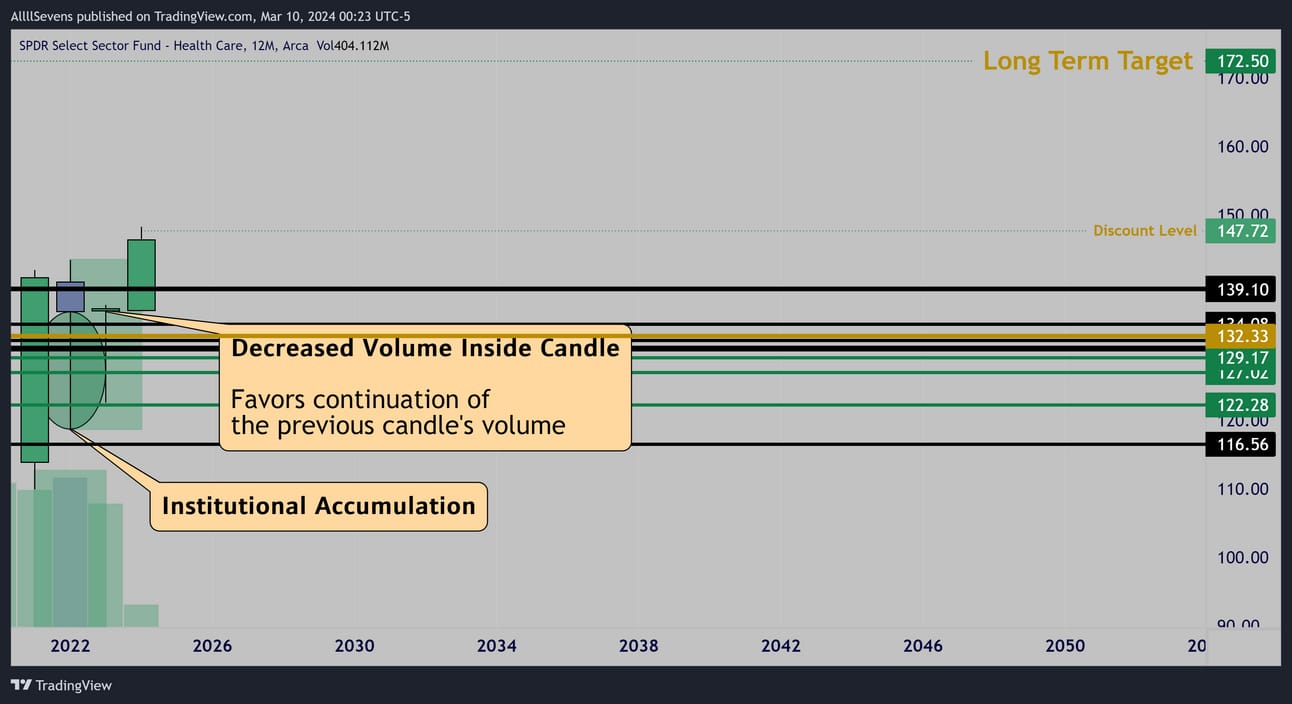
The only sector with a yearly pattern setup.
I have a gut feeling this overshoots my long-term target big time.
Currently trading at a -0.87% discount below $147.72
From there, I see minimum upside potential of +16.77% to $172.50
Strong Dark Pool demand @ $122.28-$132.33
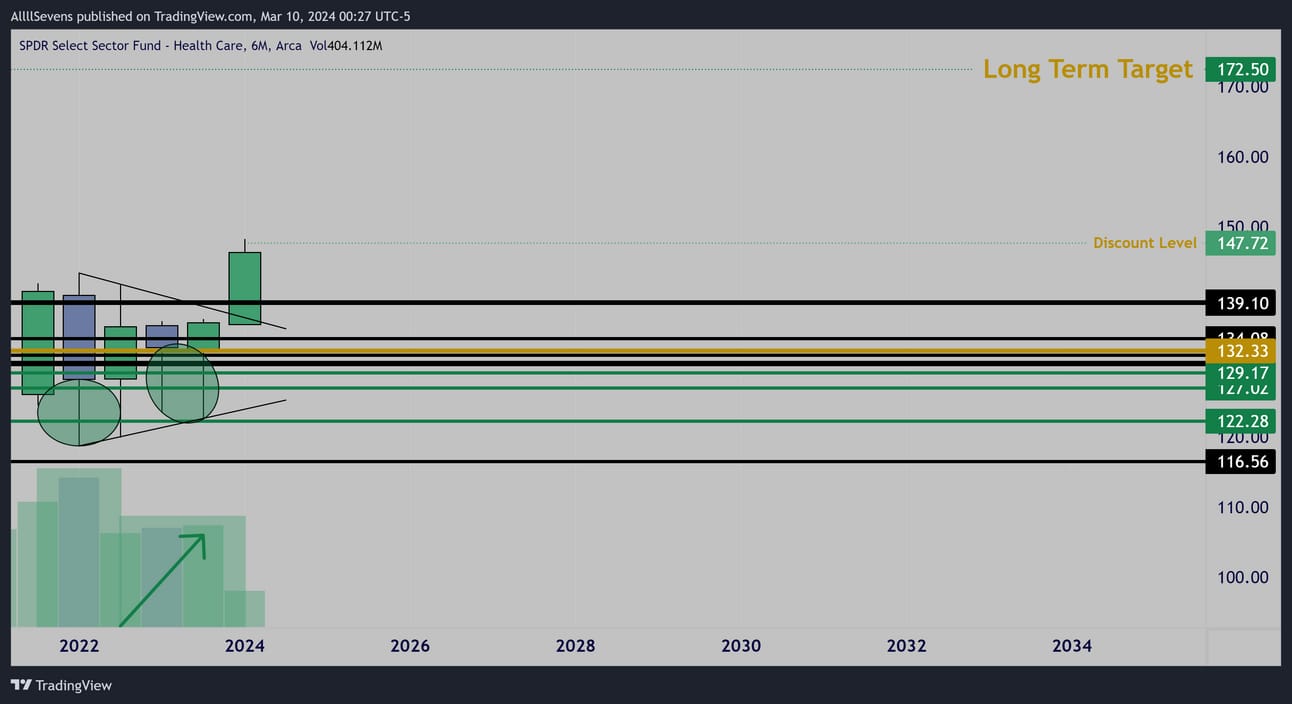
6 Month
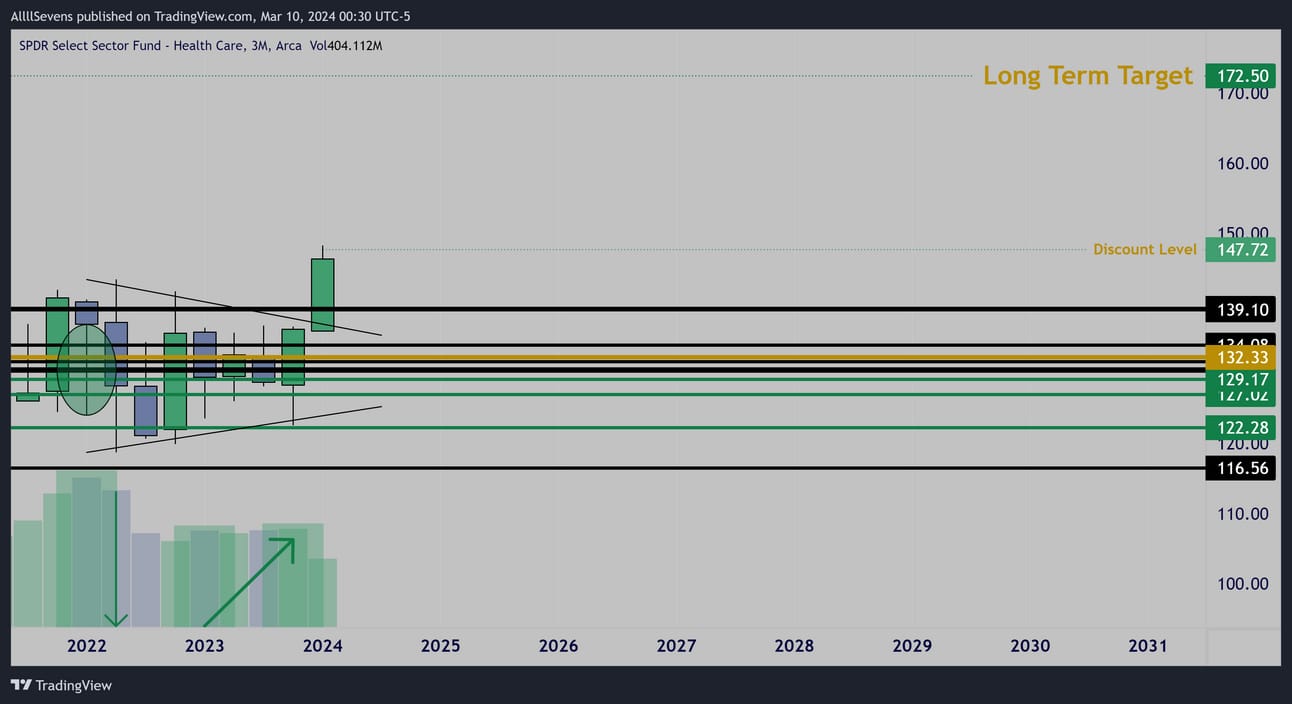
3 Month
Aesthetically pleasing breakout.
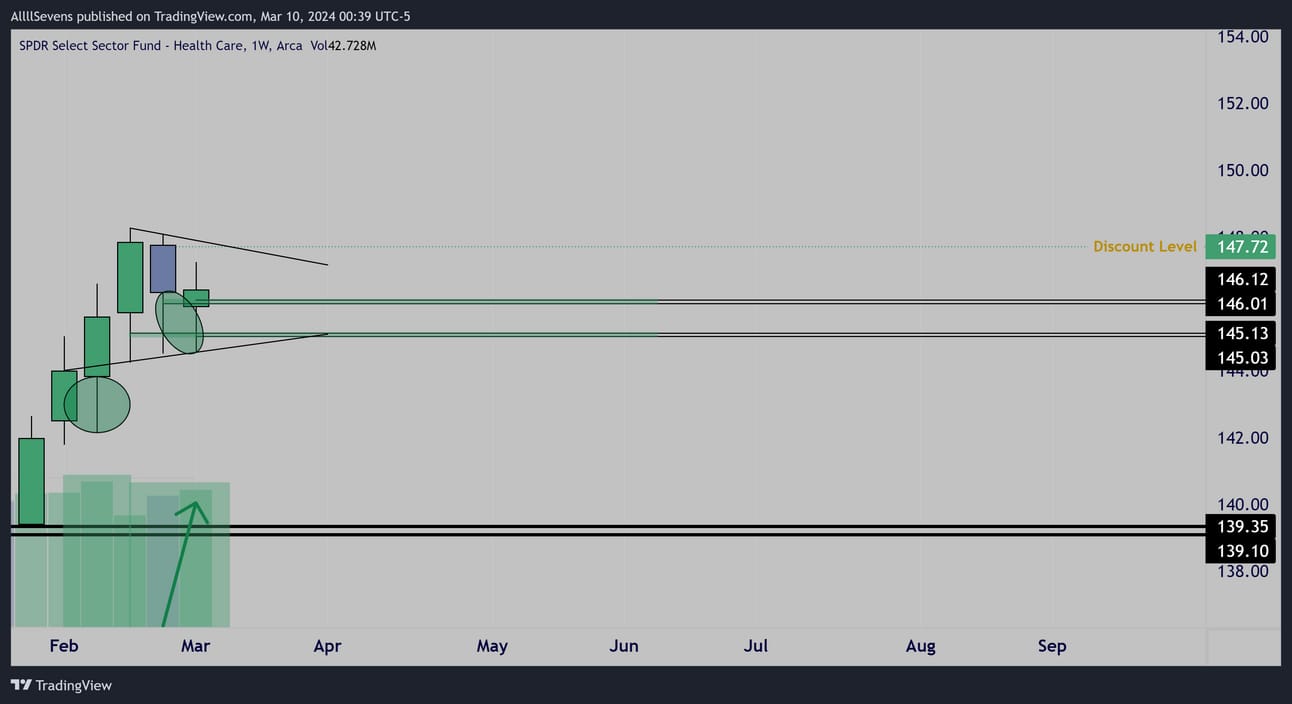
Weekly
Funny how the weekly chart is now forming the same pattern prepping for potential continuation.
Demand formed @ $145.03-$146.12
Conclusion
Long-Term:
Not trading at a notable discount so not my focus for sizable adds.
This has a TON of upside potential over the next few years though.
Short-Term:
I like this weekly setup a lot.
As long as the current demand zone holds, I think this pennant will break to the upside and this will be a market leader for years to come.
If it breaks down, will be watching if $139.10 wants to form a strong buy level, otherwise a retest of the strong Dark Pool demand deeper into the low $130’s high $120’s would be a gift.
XLY
The Consumer Discretionary Sector - 10.33% weight in the SPY
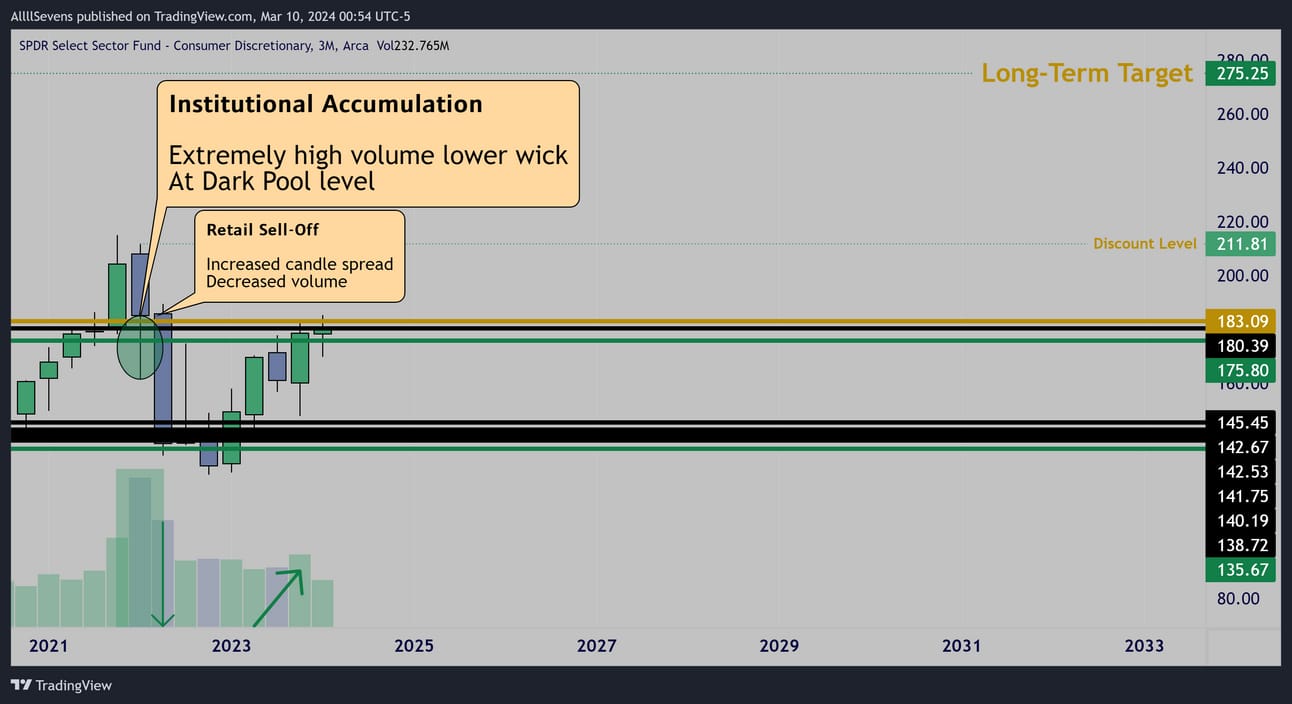
3 Month
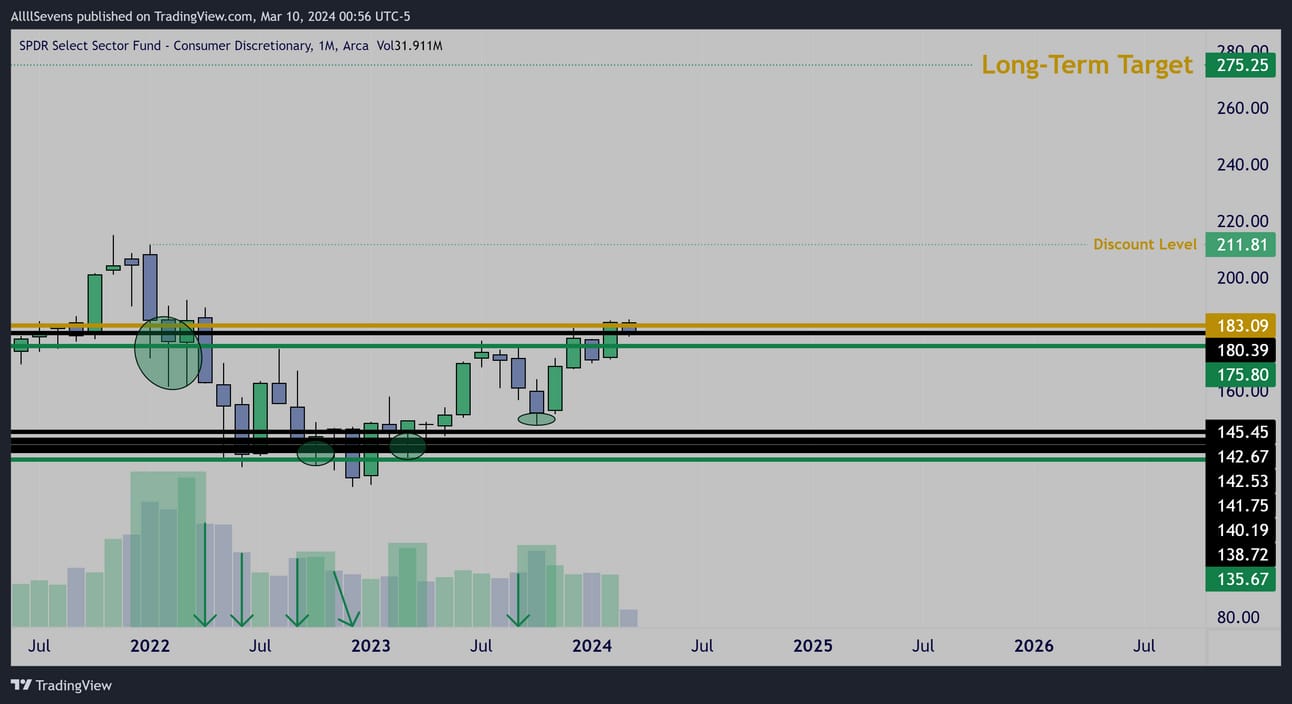
This sector ETF is extremely unique because the accumulation it saw in 2022 is historic. The volume on this accumulation candle is the ETF’s highest volume EVER
That’s EXTREMELY notable and tells me major relative strength could emerge in this sector over the next few years.
Price going for the reclaim of this demand zone right now, working with an increased volume engulfing candle increasing the odds of a successful breakout.
Currently trading at a -14.87% discount below $211.81
From there, I see minimum upside potential of +29.95%to $275.25
Strong Dark Pool demand @ $175.80
Monthly
Just for the visual. Nothing we can’t see on the quarterly chart.
Will go in my VPA textbook one day as a historic pattern.
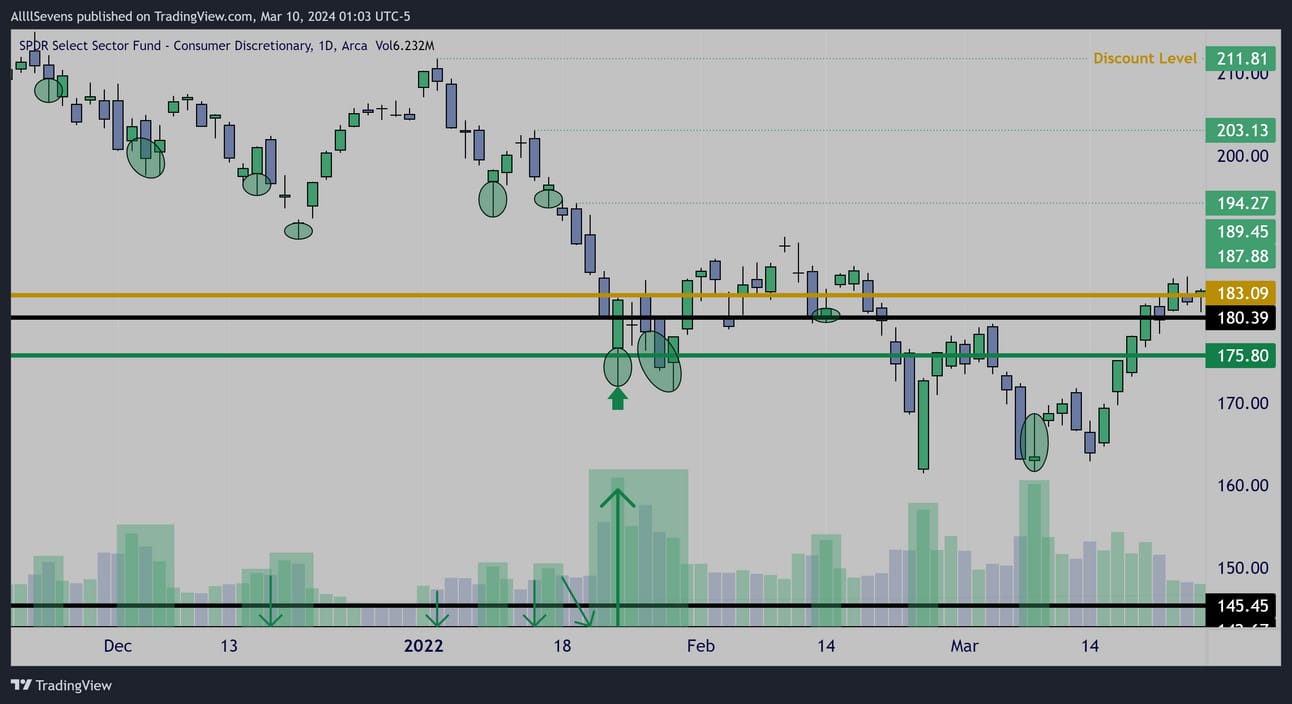
Daily
just to further display how insanely strong the accumulation was here when the bear market first began, I figured I’d show the Daily chart.
The highlighted daily candle was the highest volume in over three years.
The weekly candle that formed was the highest volume in over ten years.
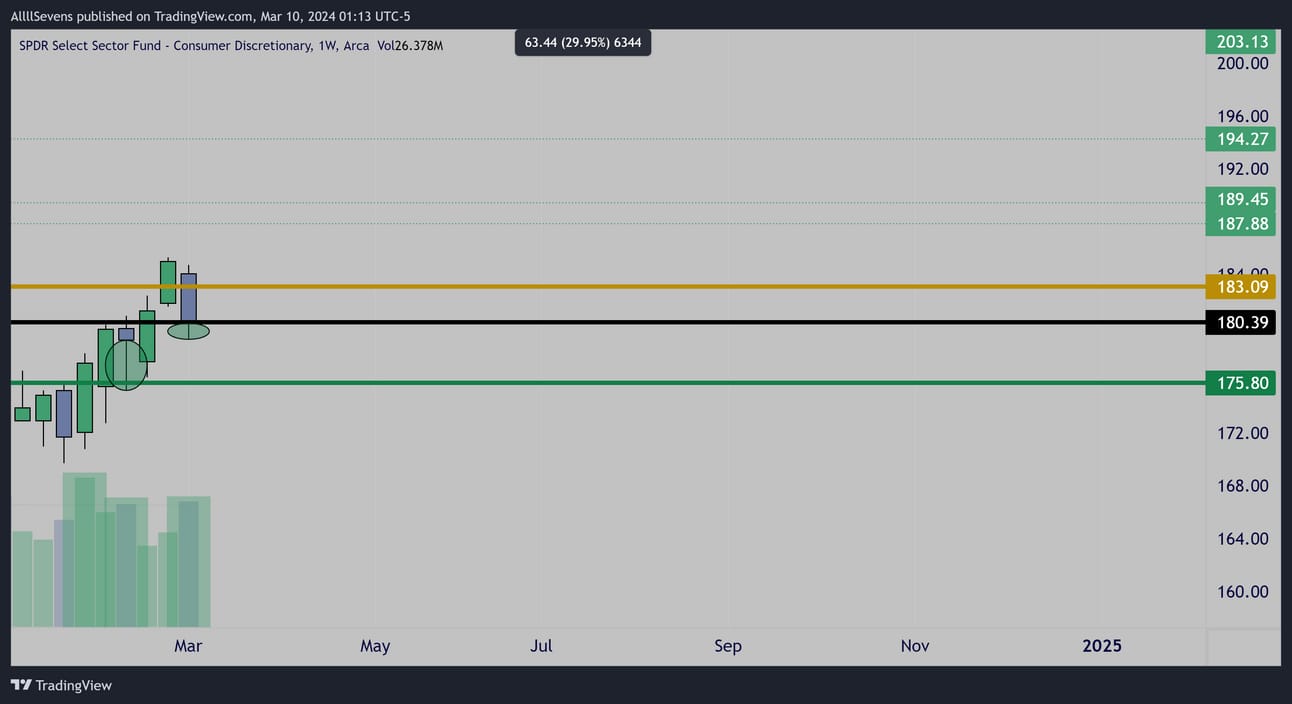
Weekly
Active accumulation seen in recent weeks.
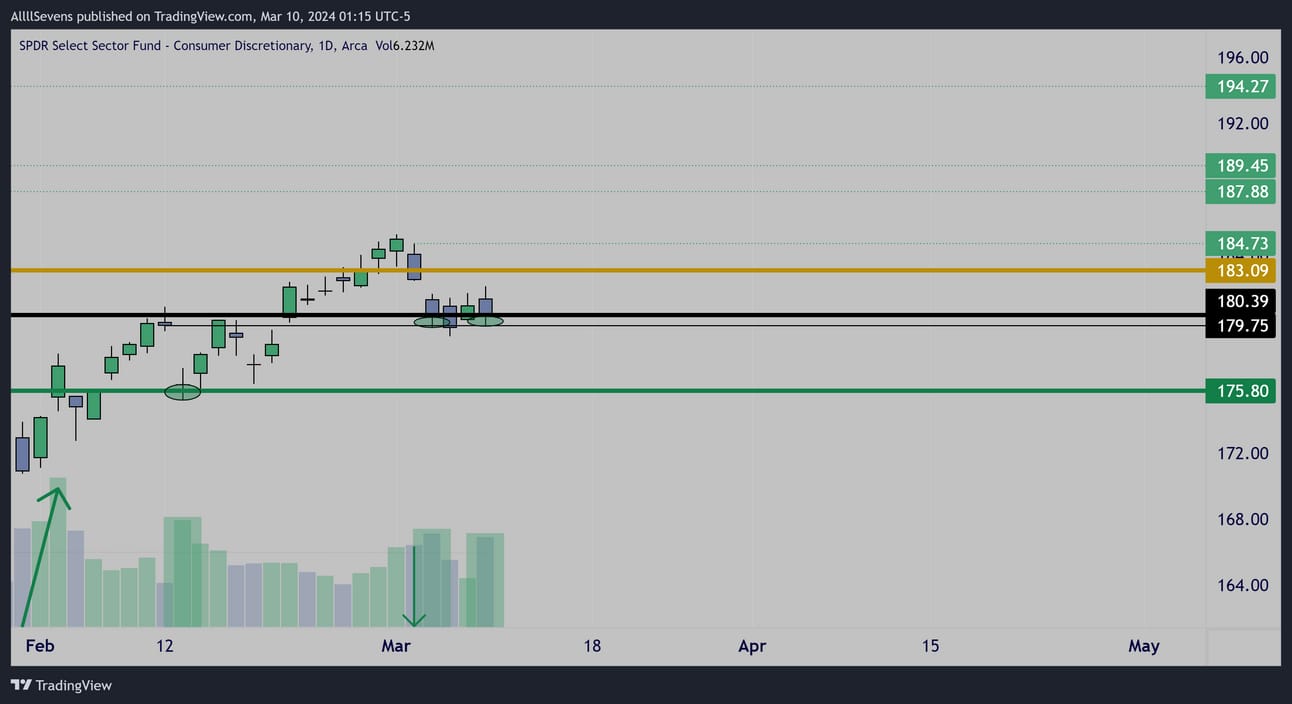
Daily
Active daily accumulations.
Unusual Options Flow

$1M 9/20 188c’s Bought
$1M 9/20 188p’s Sold

$880K 9/20 190c’s Bought

$228K 9/20 215c’s Bought
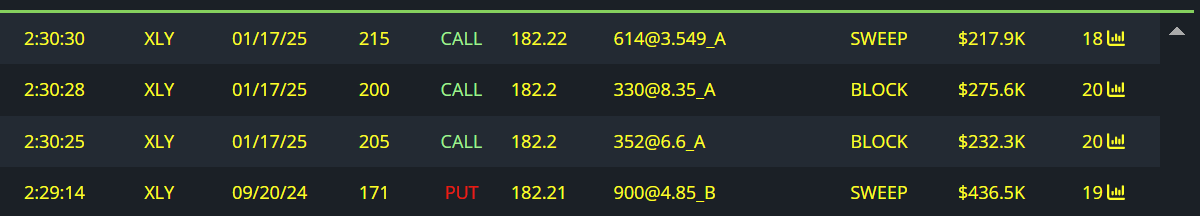
$217K 1/17 215c’s Bought
$275K 1/17 200c’s Bought
$232K 1/17 205c’s Bought
$436K 9/20 171p’s Sold
Conclusion
Long-Term:
There is a serious discount here as price is attempting to reclaim a major level that has already seen HISTORIC accumulation.
I want to make a sizable contribution to this.
I think this sector will outperform the market over the next few years.
Short-Term:
As long as $175.80 holds, this is looking absolutely explosive.
Very interested in the call options shared above.
XLC
The Consumer Services Sector - 8.78% weight in the SPY
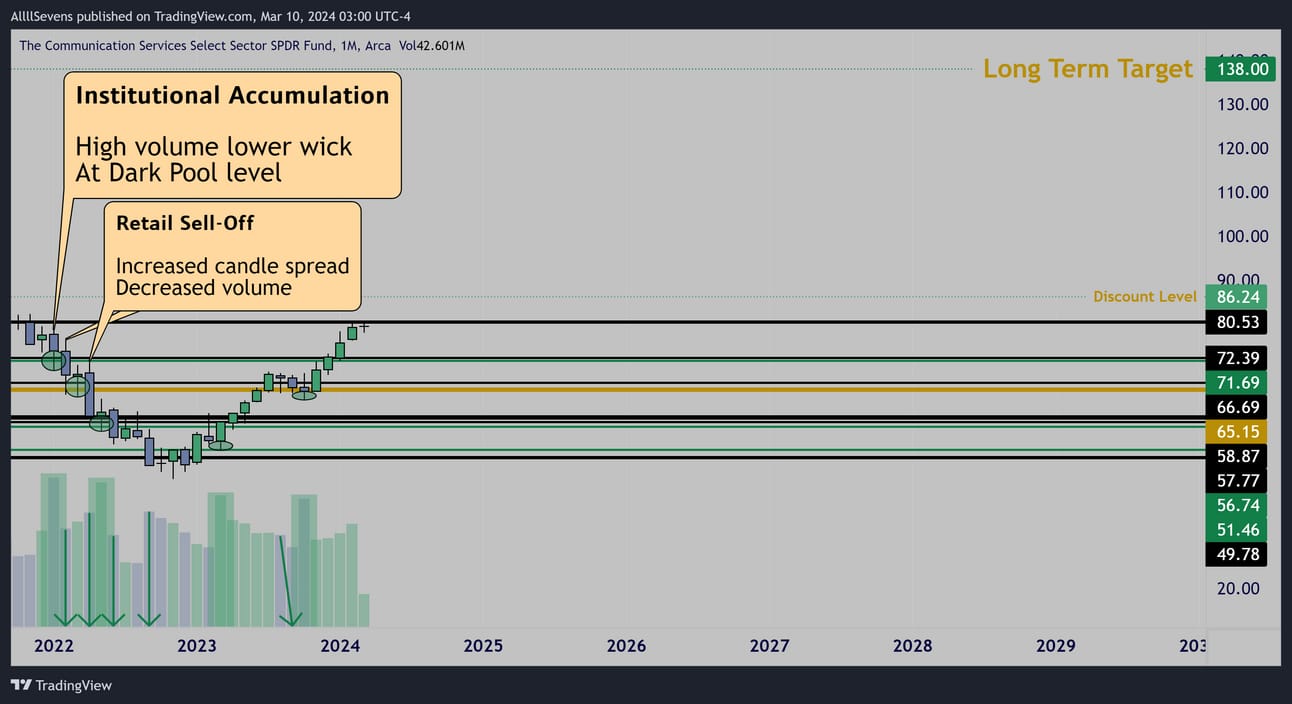
Monthly
Another sector that saw historic accumulation in 2022
It’s largest volume EVER was off the $71.69 Dark Pool accumulation.
Currently trading at a -8.36% discount below $86.24
From there, I see minimum upside potential of +60.02% to $138.00
Strong Dark Pool demand @ $71.69-$72.39
Facing it’s final Dark Pool resistance here at $80.53
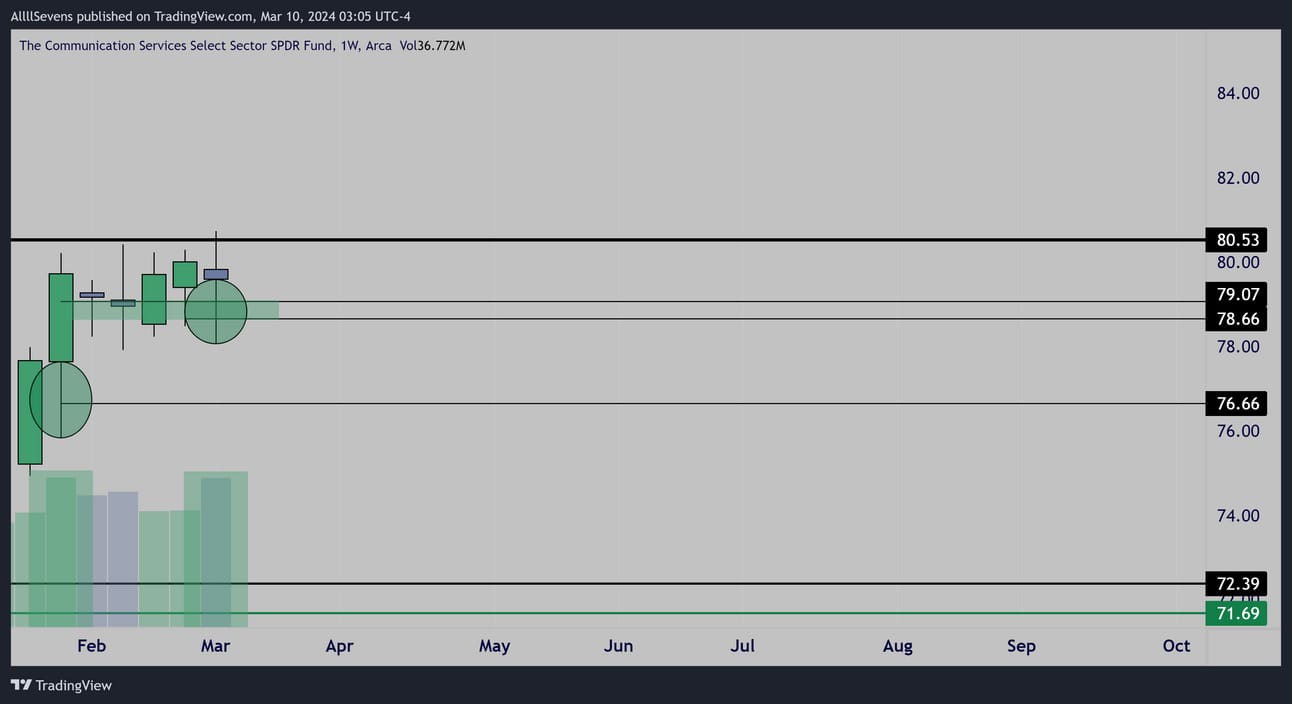
Weekly
No distribution occurring. Institutions actively buying, just like the SPY though making the bear trap candle.
Demand formed @ $78.66-$79.07
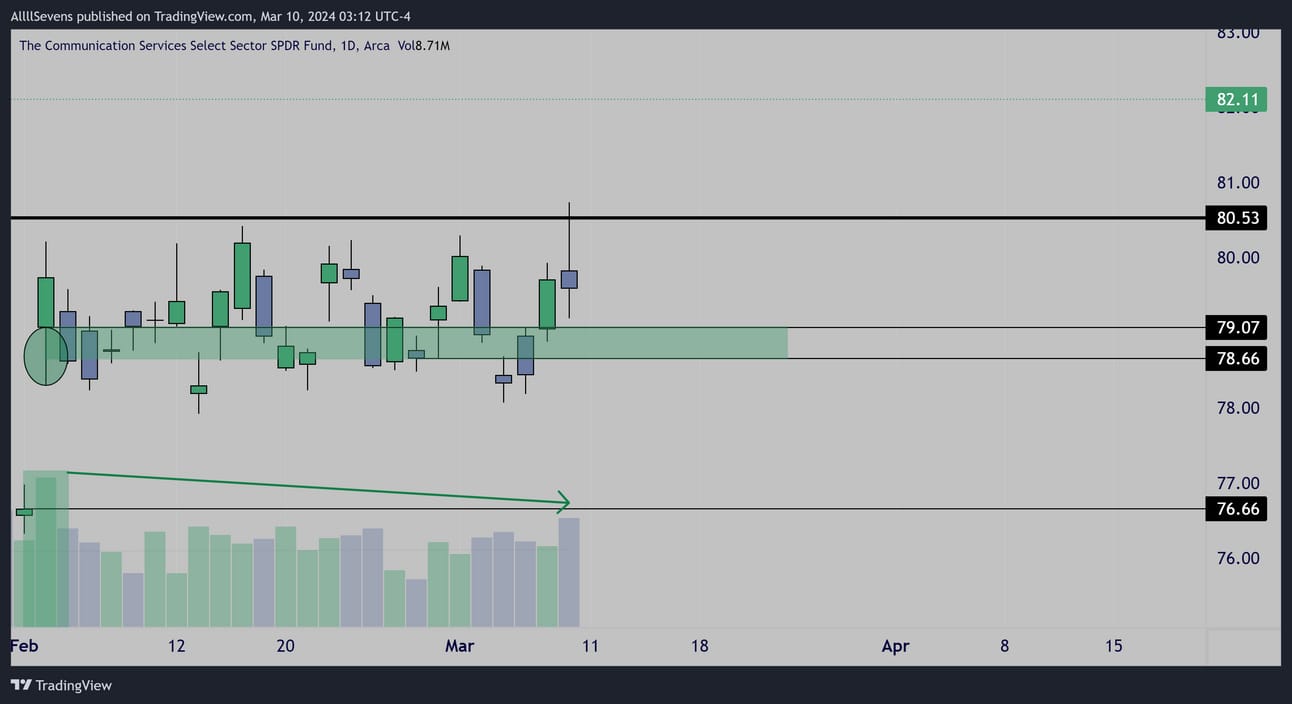
Daily
Extremely choppy range forming here below resistance.
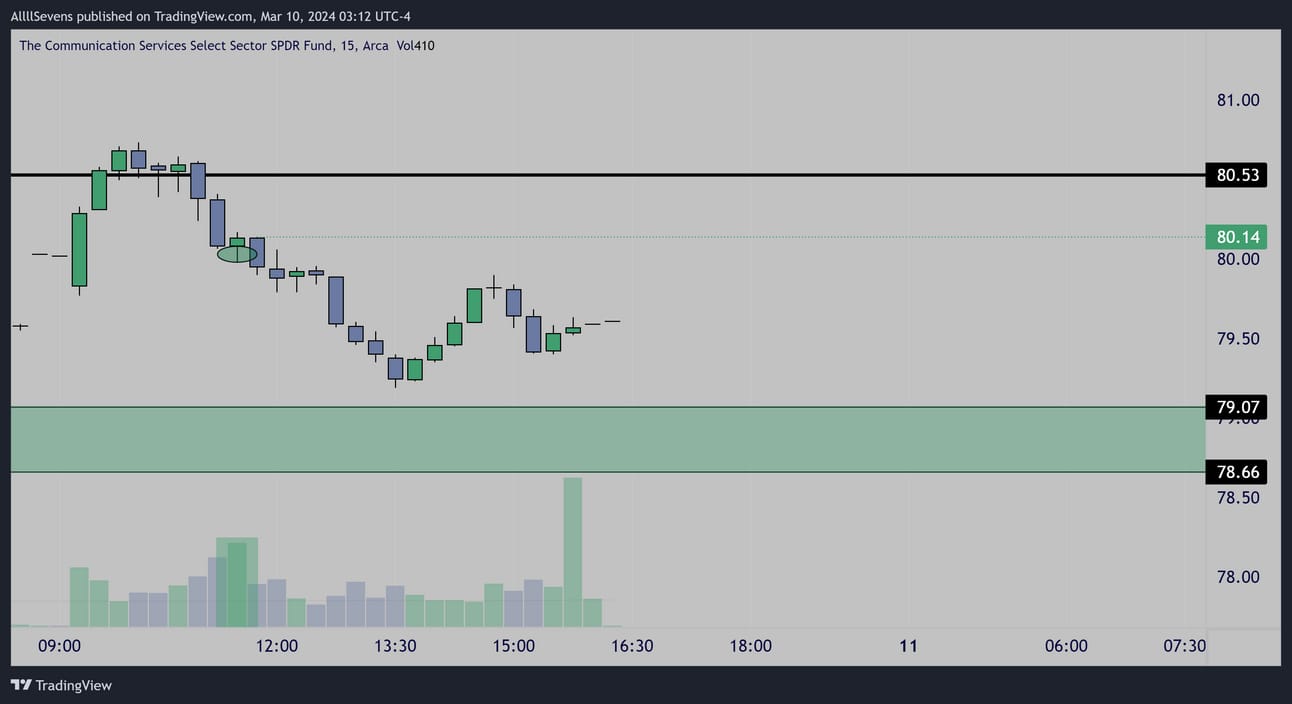
15m Friday 3/08
Friday’s intraday tape confirms the rejection of $80.53 was not backed by institutions. They loaded the dip.
Conclusion
Long-Term:
This is trading at a notable discount relative to the SPY but being below resistance, not a place I’m looking to make a sizable contribution.
Short-Term:
I think this is going to absolutely explode over this level-
But, with all the chop building up below, it would not surprise me to see a downside shakeout first.
So, I’ll wait for that, or for the breakout and retest to go long.
XLI
The Industrial Sector - 8.74% weight in the SPY
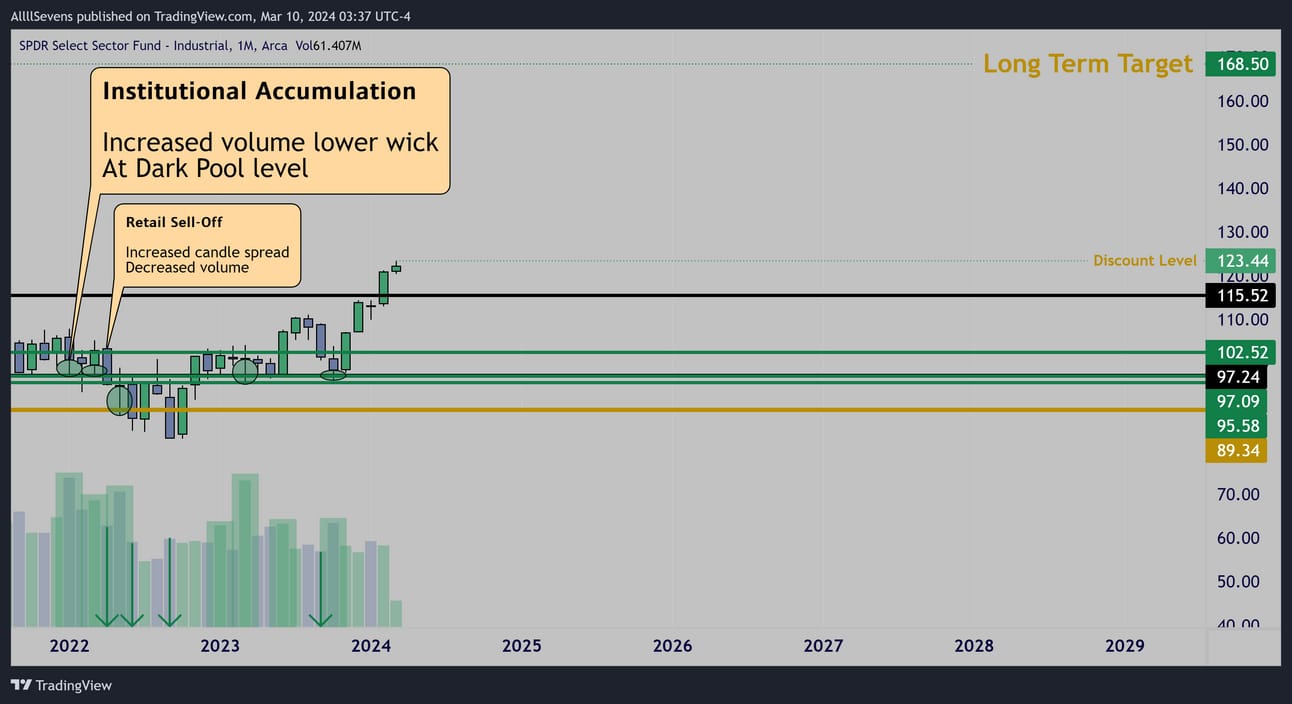
Monthly
Tons of institutional accumulation preceded the current rally.
Currently trading at a -0.92% discount below $123.44
From there, I see minimum upside potential of +36.50% to $168.50
Strong Dark Pool demand @ $102.50
Fresh Dark Pool below @ $115.22
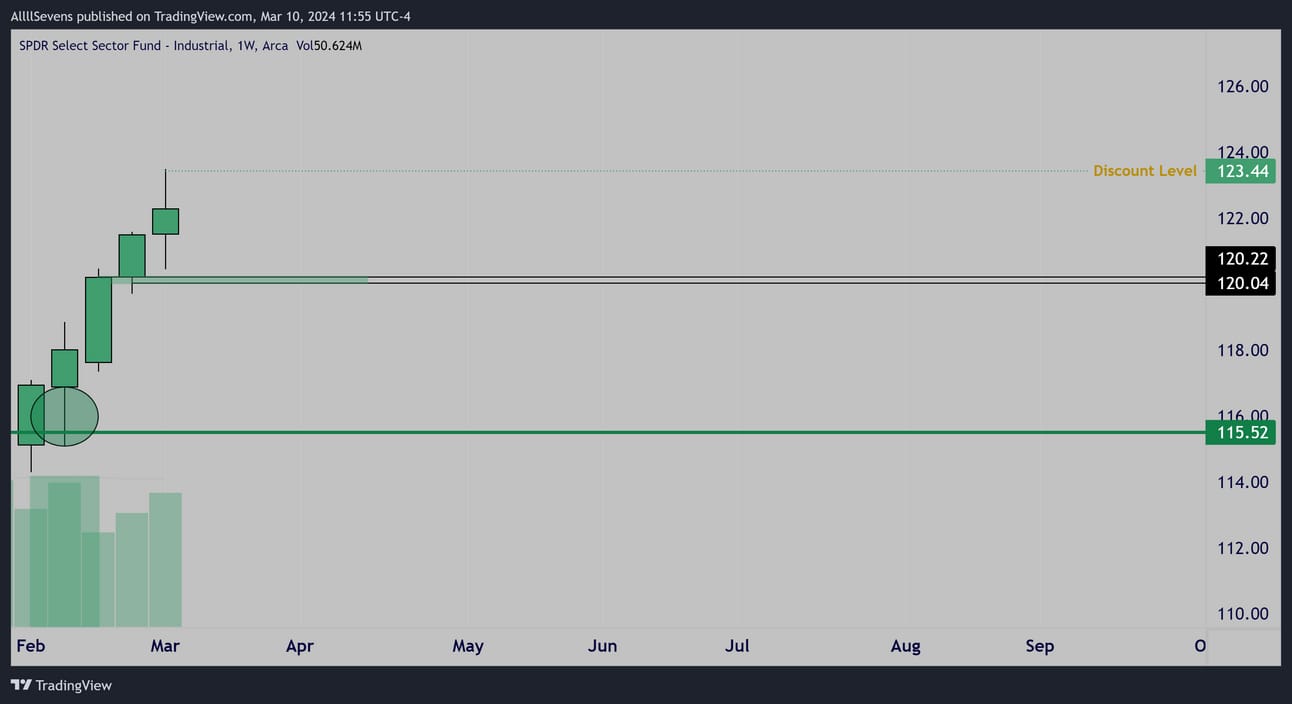
Weekly
Strong weekly accumulation from $115.52
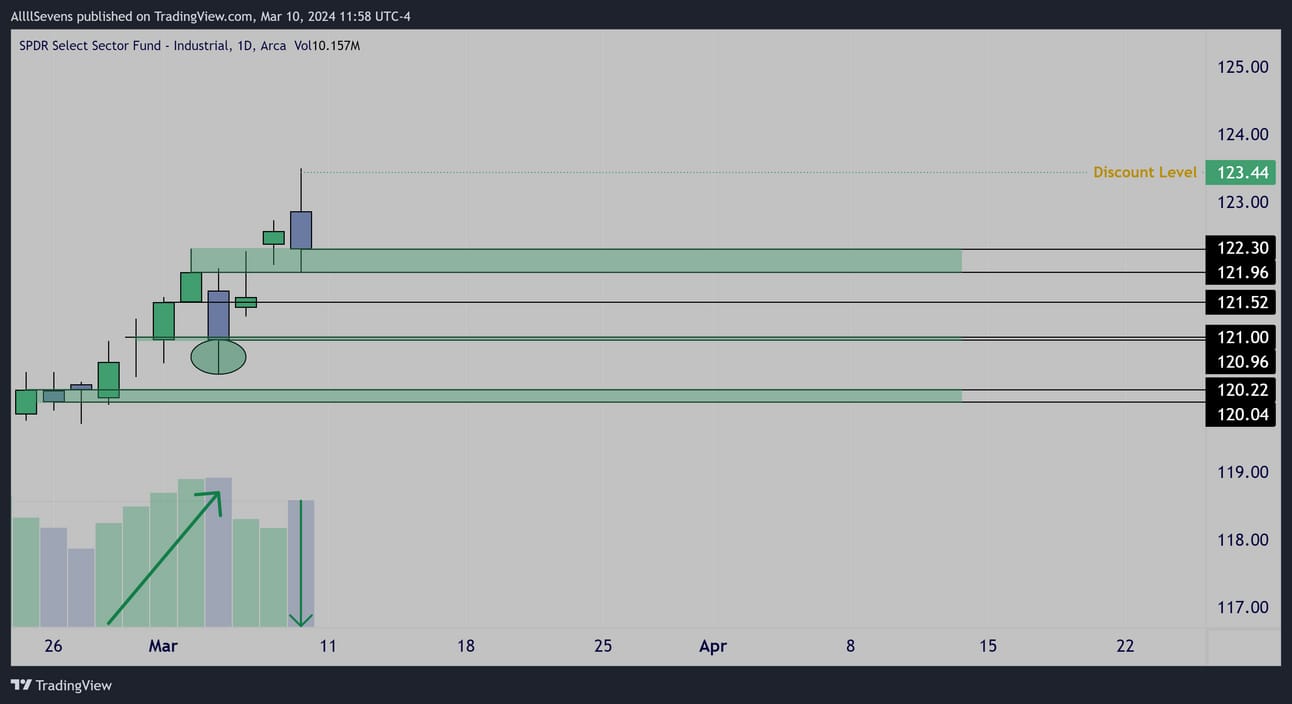
Daily
Demand formed @ $120.04-$120.22
Lesser demands formed above
Conclusion
Long-Term:
Not trading at any kind of discount so not interested in sizable adds
Still has a lot of upside potential. Solid sector.
A pullback would be great to add size. For now, may as well just do SPY
Short-Term:
Not seeing any kind of actionable setup here would love to see one of these demand zones get more flushed out.
If lost- will watch that $115 dark pool
XLP
The Consumer Staples Sector - 5.99% weight in the SPY
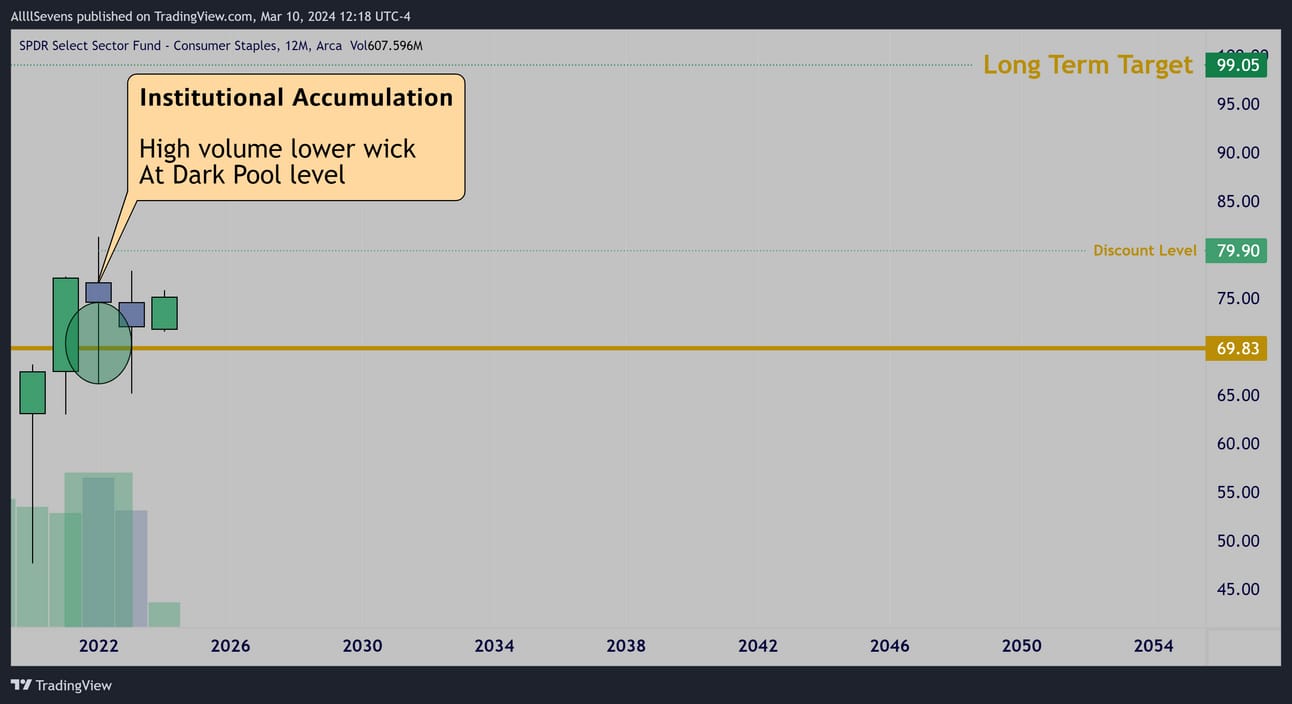
Yearly
Weekly
Historic accumulation in May of 2022 off $76.43
Currently trading at a -5.93% discount below $79.90
From there, I see minimum upside potential of +23.97% to $99.05
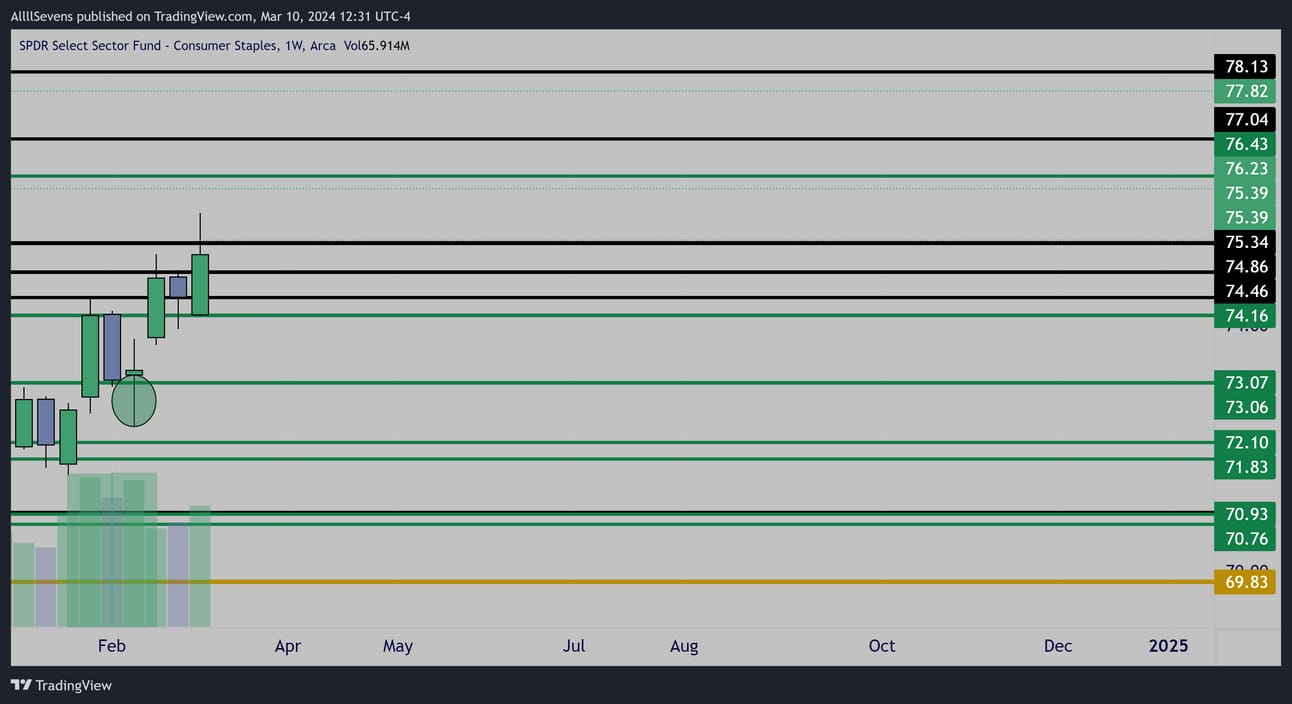
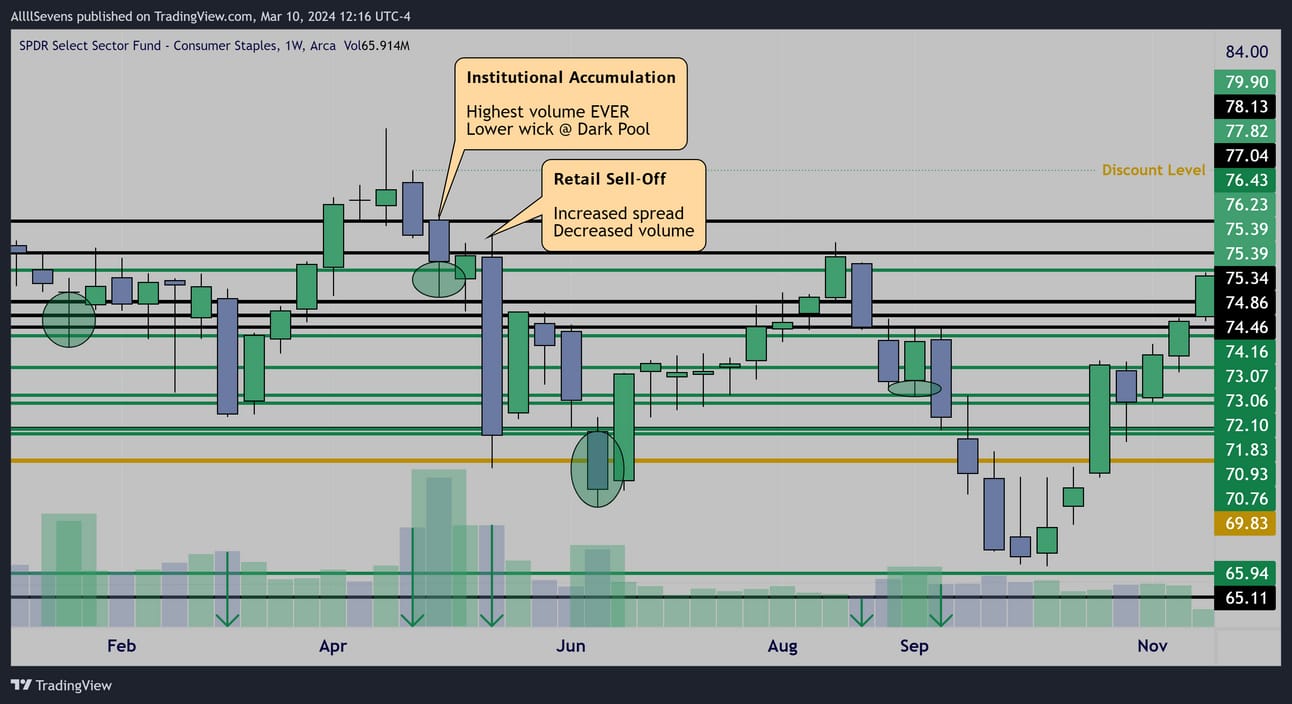
Weekly
Strong Dark Pool demands marked below in green.
Bullish engulfing candle as price hits resistance here-
This sector ETF is honestly extremely hard day-by-day, I think it’s clearly an amazing buy & hold that’s about it.
Every once in a while it will give an A+ long entry like the high volume IB hammer candle off $73.07 (a previously accumulated level) 4 weeks ago.
That was the most recent ideal entry for a trade.
Conclusion
Long-Term:
Not trading at an insane discount…
Not offering insane upside potential either…
but man, can’t deny the patters here are extremely solid and this did see HISTORIC accumulation off levels higher than what’s trading now.
Something to consider. Defensive sector, likely to hold up well in the case that the overall market does mark short-term top.
Short-term:
This gave an A++ entry a few weeks ago.
Hard to work with it here, not really my focus.
XLE
The Energy Sector - 3.74% weight in the SPY
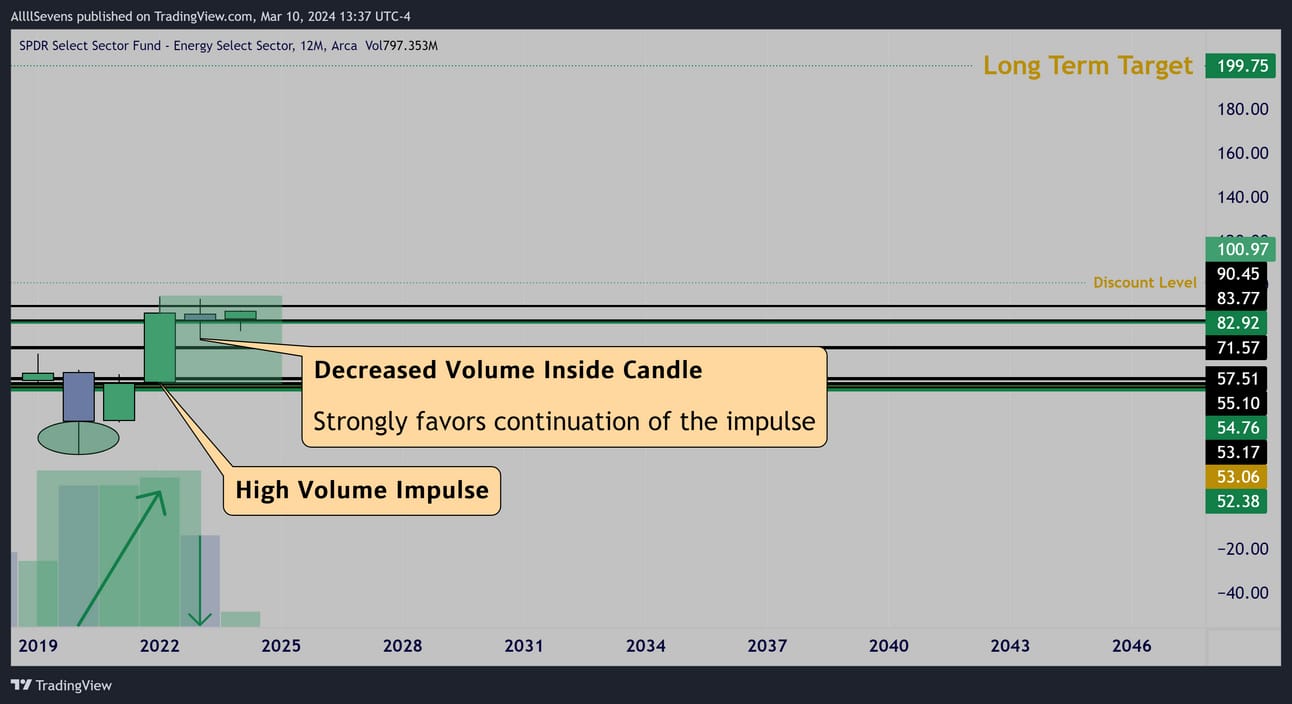
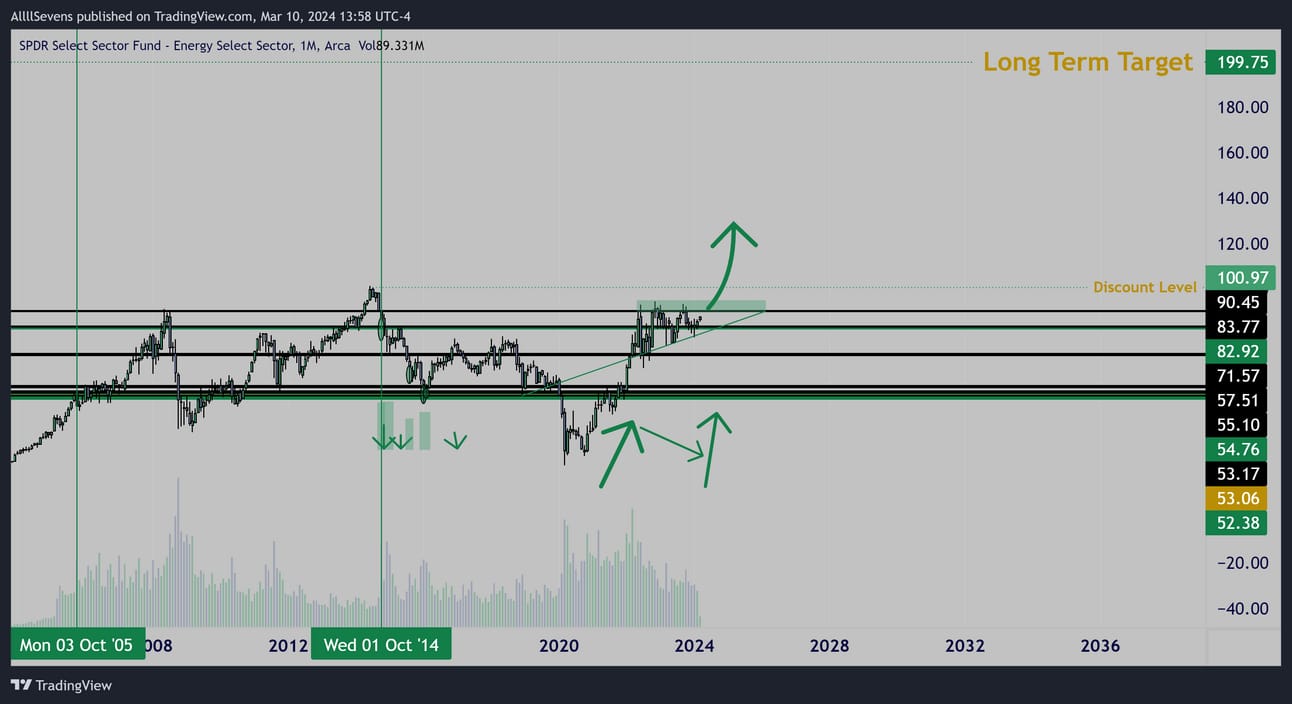
Yearly
An absolutely insane A+ setup here for the sector to double in value over the next few years.
This is SERIOUSLY NOTABLE
Currently trading at a -12.68% discount below $100.97
From there, I see minimum upside potential of +97.83% to $199.75
Monthly
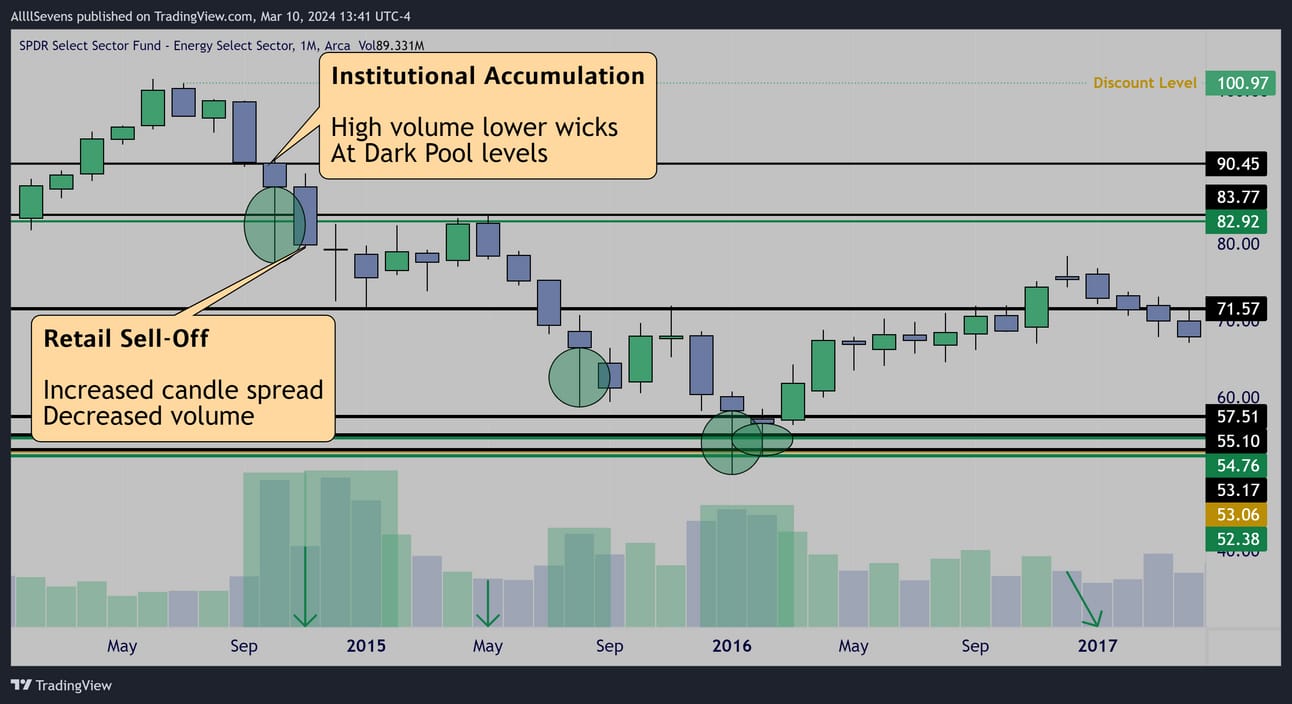
Back in 2014 the same levels price is trading at right now saw TEXTBOOK institutional accumulation patterns. In 2202 the sector collapsed.
It capitulated. MAJOR volumes as seen on the Yearly chart came in to buy the breakdown.
I believe an all-time-low was set. This is historic.
As price reclaims these levels from 2014 and displays this yearly upside continuation setup, this could be the cheapest that energy stocks will EVER be. I can only imagine what the next 50 years will look like.
My current long-term target will no doubt get blown through.
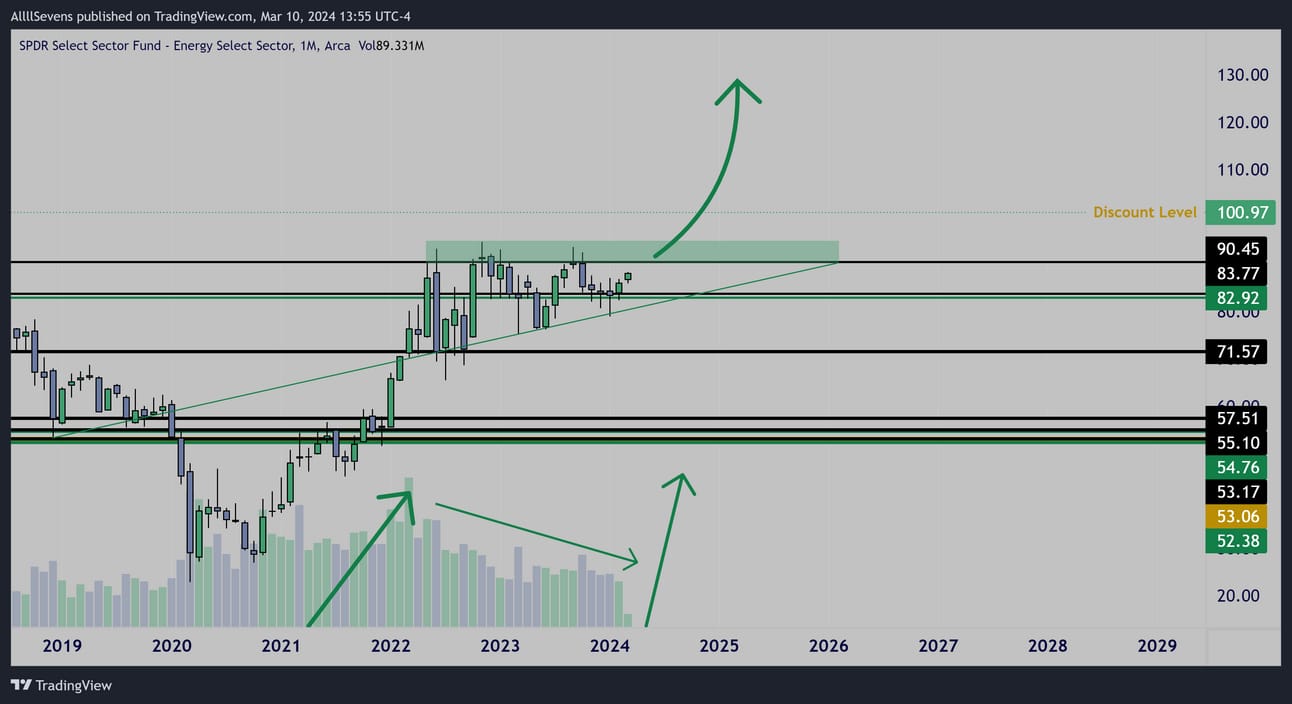
Monthly
Alongside the yearly upside continuation pattern-
I am sure you’re familiar with an ascending triangle?
This is also a high probability upside continuation pattern.
Unusual Options Flow

$579K 12/19/25 85p’s Sold
$620K 12/19/25 85c’s Bought

$457K 9/20 87c’s Bought
$341K 9/20 81p’s Sold
Conclusion
I can’t express how convicted I am here.
Energy stocks may never trade at these prices again.
We could be looking at a historic run starting over the next few years.
Keep in mind the XLE has traded sideways for coming up on 20 years.
Compression leads to expansion.
A 20 year compression could lead to… historic expansion.
I think this is looking great in the short-term to head for that breakout over the next few months, want to position myself in shares long dated calls though, nothing shorter dated. The move here is much bigger than a simple one or two month swing. Energy stocks can move parabolic with the right breakout and potentially the right catalyst.
XLB
The Materials Sector - 2.33% weight in the SPY
3 Month
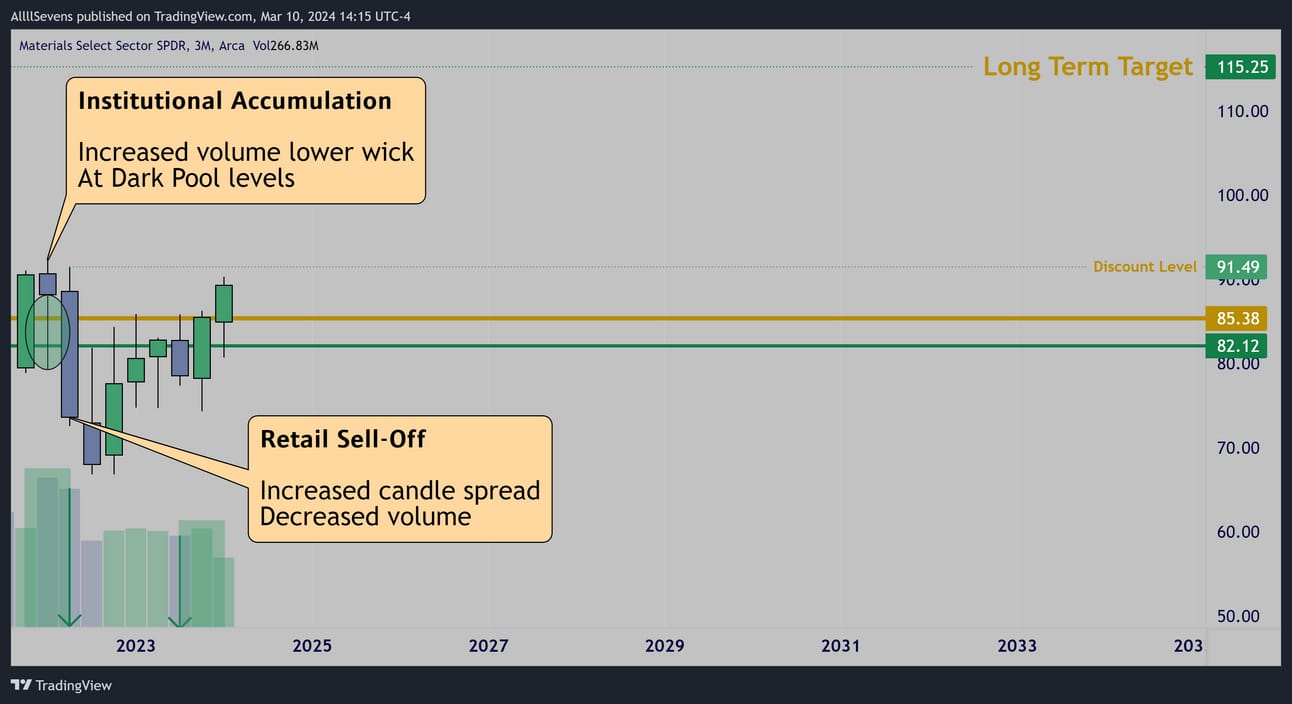
The same A+ accumulation in 2022 as many of the other sectors.
Strong Dark Pool demand @ $82.12-$85.38
Currently trading at a -2.34% discount below $91.49
From there, I see minimum upside potential of +25.97% to $115.25
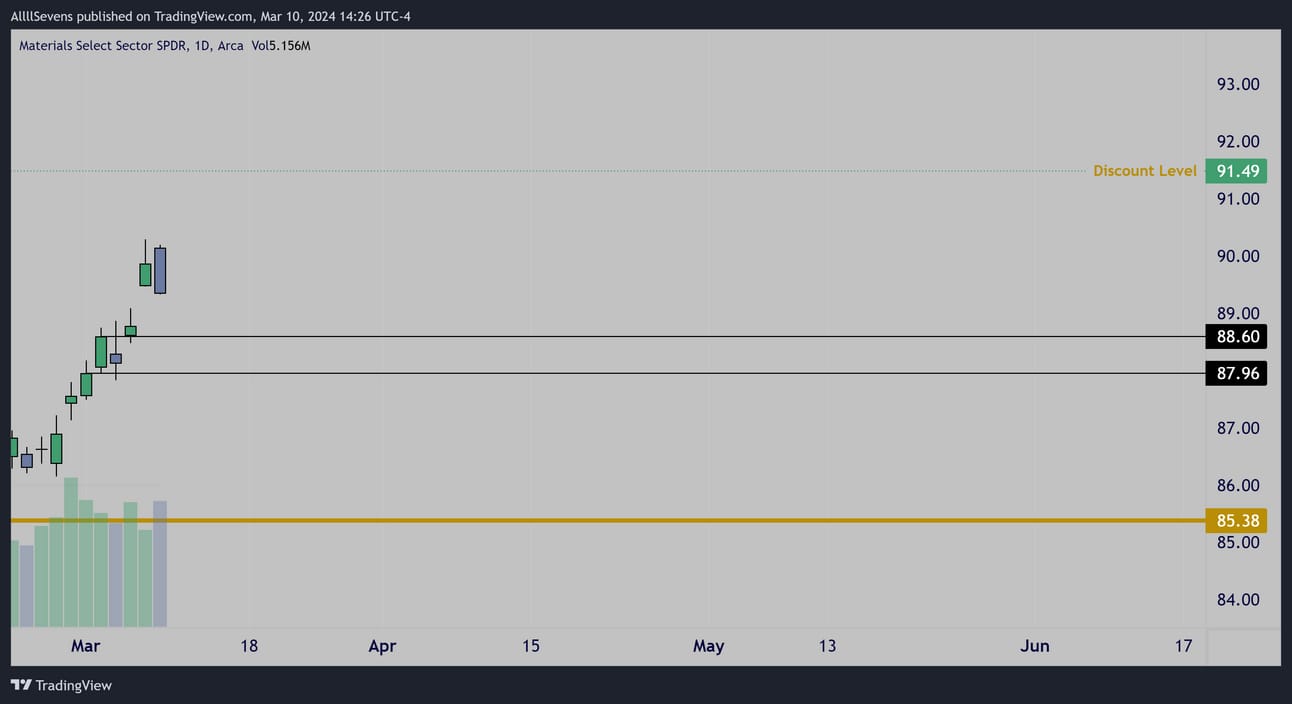
Daily
I don’t see any demand formed but some levels to watch to gauge current momentum and whether or not this will retest the breakout.
Unusual Options Flow

$227K 6/21 87p’s Sold
$213K 90c’s Bought
Conclusion
Long-Term:
Clearly some great long-term potential here.
Not at a crazy discount and not offering any crazy upside, but it’s solid patterns. If this gets a retest I’ll definitely be looking to add size.
Short-Term:
This has an overall theme working around it. You’ve probably heard talk of metals catching bids recently. Almost seems like the perfect reason for this to retest the breakout… We’ll see.
I think this could hold a good trend if it can see buyers at the levels marked on my Daily chart. Good flow here too.
XLRE
The Real Estate Sector - 2.32% weight in the SPY
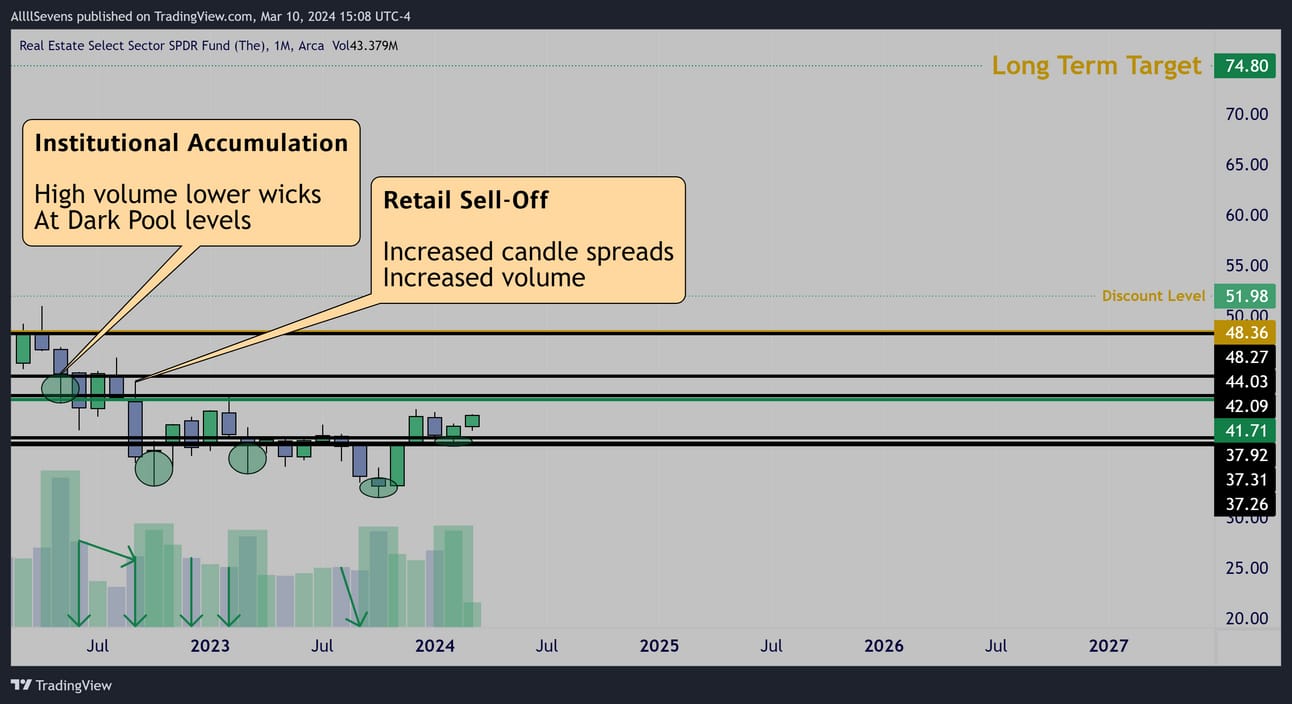
Monthly
Incredible institutional accumulation!
This is the most undervalued sector in the market.
Currently trading at a -22.72% discount below $51.98
From there, I see minimum upside potential of +43.90% to $74.80
Conclusion
Long-Term
One of the most undervalued sectors in the market. No clue why.
The patterns are absolutely incredible and I believe this will see a MASSIVE recovery.
With large accumulation taking place just last month i want to make a sizable contribution here.
I like a few individual names here a LOT. Seeing historic volumes at the lows with the most textbook accumulations I have genuinely ever seen over the last two years. I’ve shared analysis on these for AllllSevens+ members.
Short-Term
An A+ reversal patter last month. I wrote a stand-alone newsletter (free) on this sector a few weeks back and am holding April calls up 100% so far.
XLU
The Utilities Sector - 2.15% weight in the SPY
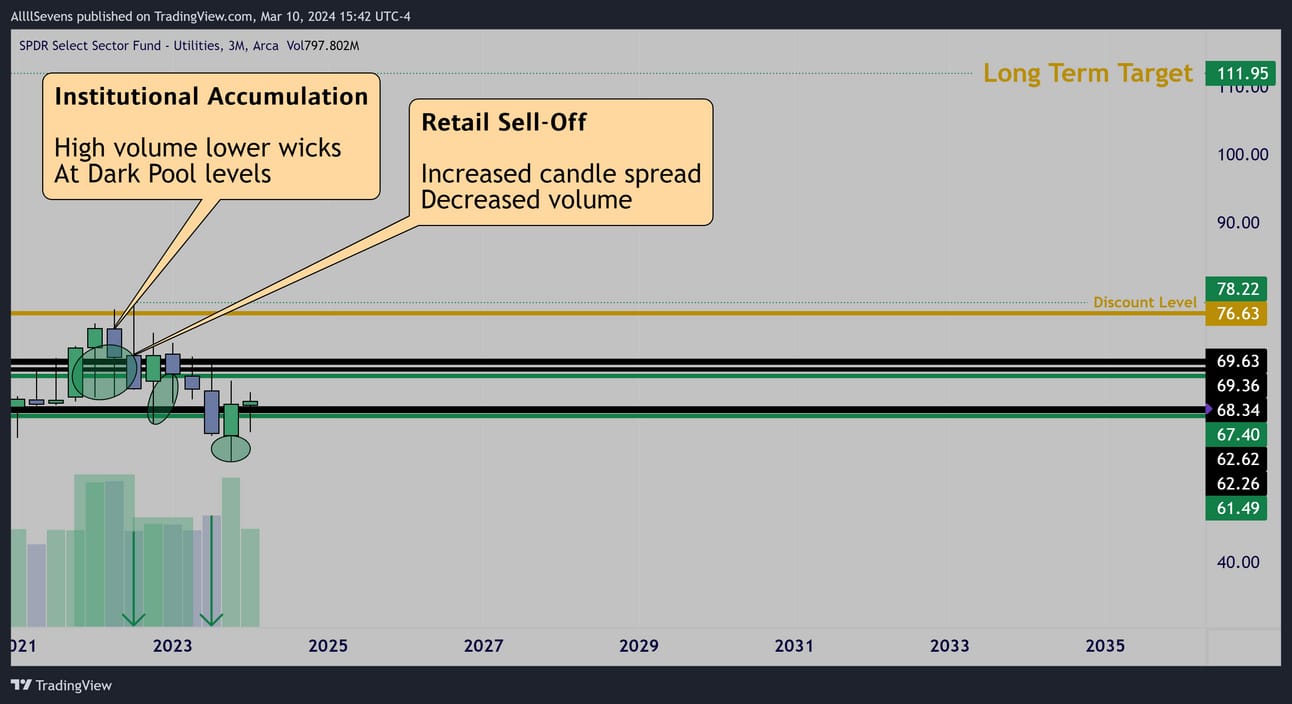
3 Month
Extremely powerful accumulation patterns.
Currently trading at a -18.50% discount below $78.22
From there, I see minimum upside potential of +43.90% to $111.95
Conclusion
Long-Term
Also one of the most extremely undervalued sectors in the market.
Again, for seemingly no reason as institutional investors have LOADED this thing to the teeth. I think this is a strong buy down here and I’d like to make a decent contribution. Nothing BIG as it is still in such a heavy downtrend and my gut tells me it will chop at this demand a while longer. If it doesn’t, oh well, over $67.40 will be another strong opportunity to add
Short-Term
My gut just screams to let this chop more-
But, there is a major 6 month and quarterly climax so I wouldn’t be surprised if my gut is wrong. it’s a great long term buy to me no doubt.
But for calls, I’d like to see more.
Thank you for your time.
I spent my entire weekend working on this, I hope you found value and stick around for future newsletters.
This style of analysis is a MOVEMENT.
VOLUME is the truth!
AllllSevens+ $7.77/Month
Upgrade your subscription & gain access to my PREMIUM newsletters.
If you see the value and the work put into the data I shared above, you will truly appreciate the newsletters I put out to paid subscribers.
Over the next few weeks I will be sending out newsletters on INDIVUDUAL names fitting the themes of the ETF’s above.
You will NOT want to miss that…
Some of the sectors with historic accumulation patterns have a few individual names with even crazier patterns.
And some of the sectors that aren’t trading at a large discount have individual names inside with the same patterns, still at notable discounts.
Also get access to my Discord when you upgrade.
Great community in there.
It’s only $7.77 per month. Try it out!
https://allllsevensnewsletter.beehiiv.com/upgrade
We-Bull Referral
https://a.webull.com/Tfjp9cTCDSzfJtjPDr

BlackBoxStocks
The Ultimate Tool For Traders
Dark Pool
Options Platform
Stocks Platform
Proprietary Indicators
Live Community & Members Chat
Education Program Courses
Mobile App
News
I collect all my Unusual Options Flow and Dark Pools through BBS
BlackBoxStocks offers a 20% discount to first time members!
Use my referral link >http://staygreen.blackboxstocks.com/aff_c?offer_id=5&aff_id=2544
BBS also offers a military discount!
See in detail what all BBS has to offer by reading this guide linked just below!
https://docs.blackboxstocks.com
Reply