- AllllSevens
- Posts
- Buy the dip? S&P500
Disclaimer
I am not a legal professional.
The content shared in this newsletter is purely my personal opinion and for information purposes only.
You should not interpret any of this as investment or financial advice.
The statements I make are not solicitations, recommendations, or endorsements to buy or sell a security or financial instrument.
I am not a fiduciary on account of your viewing of this information.
You are solely responsible for the risks involved with the use of any information shared in this newsletter.
By using this site and reading this newsletter, you agree to not hold me, my affiliates, or any third party liable for decisions you might make based of information shared in this newsletter.
Preface
It’s been four weeks since I wrote my last newsletter where I claimed the push to new highs following FOMC was a bull trap.
“A pause in trend or even a pullback is beginning to shape up”
Price ended up breaking range and pulled back.
Now what?
I do believe a short-term top may have been set…
BUT, I am not calling to swing shorts. In fact, I’m pretty opposed to this.
Price is at support, so R/R is heavily in favor of longs over shorts.
Even more notable, is there are clear bullish anomalies suggesting the recent sell-off is not backed by aggressive sellers and so letting price bounce before even thinking about a potential short-swing is the best move.
So, I don’t want to swing short at support. Makes sense.
I also don’t want to swing long this support because IF we are ready to bounce, I am extremely doubtful of it’s strength, and I’ll be more focused on shorting the pop. I can trade the pop, don’t want to swing it.
I’d rather preserve both my monetary and mental capital for that A+ swing opportunity, than trying to make something out of nothing swinging long here betting on the dead cat that may or may not happen now rather than later. It will come, but it’s something that’s hard to time for a swing. I’d rather day trade with absolutely 0 bias.
I share day trade ideas on my 𝕏 (Twitter) account so make sure you are following me with notifications on for market updates!
Last week’s trade ideas were very lucrative, you can check them out here.
SPY
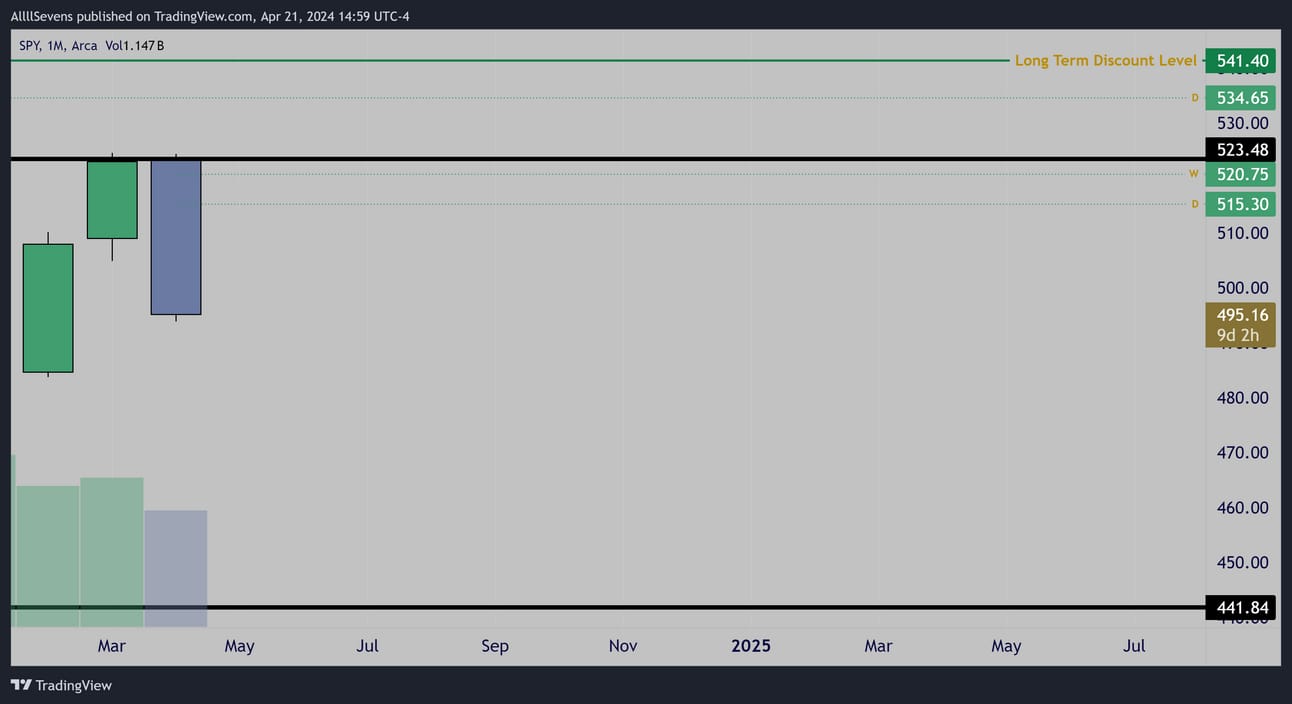
Monthly
$523.48 resistance
$441.84 support
This month’s candle will have increasing volume.
The question is:
Will it bearish engulf?
Will buyers step in into close and form a hanging man reversal pattern?
One of these seems most likely to me.
I will explain more on why below.
OR, buyers could REALLY step in, reclaim $523.48 into the end of month and prolong the current bullish trend. This is the only scenario I see for the current trend to remain in-tact.
Otherwise, I believe a short-term top has been set.
A candle open below $523.48 to start May officially marks this level as a resistance… This would lead to further range-bound price action or even a further pullback over the coming months.
The classic “Sell in May and go away” will be confirmed or denied depending on where this candle opens. Above or below $523.48
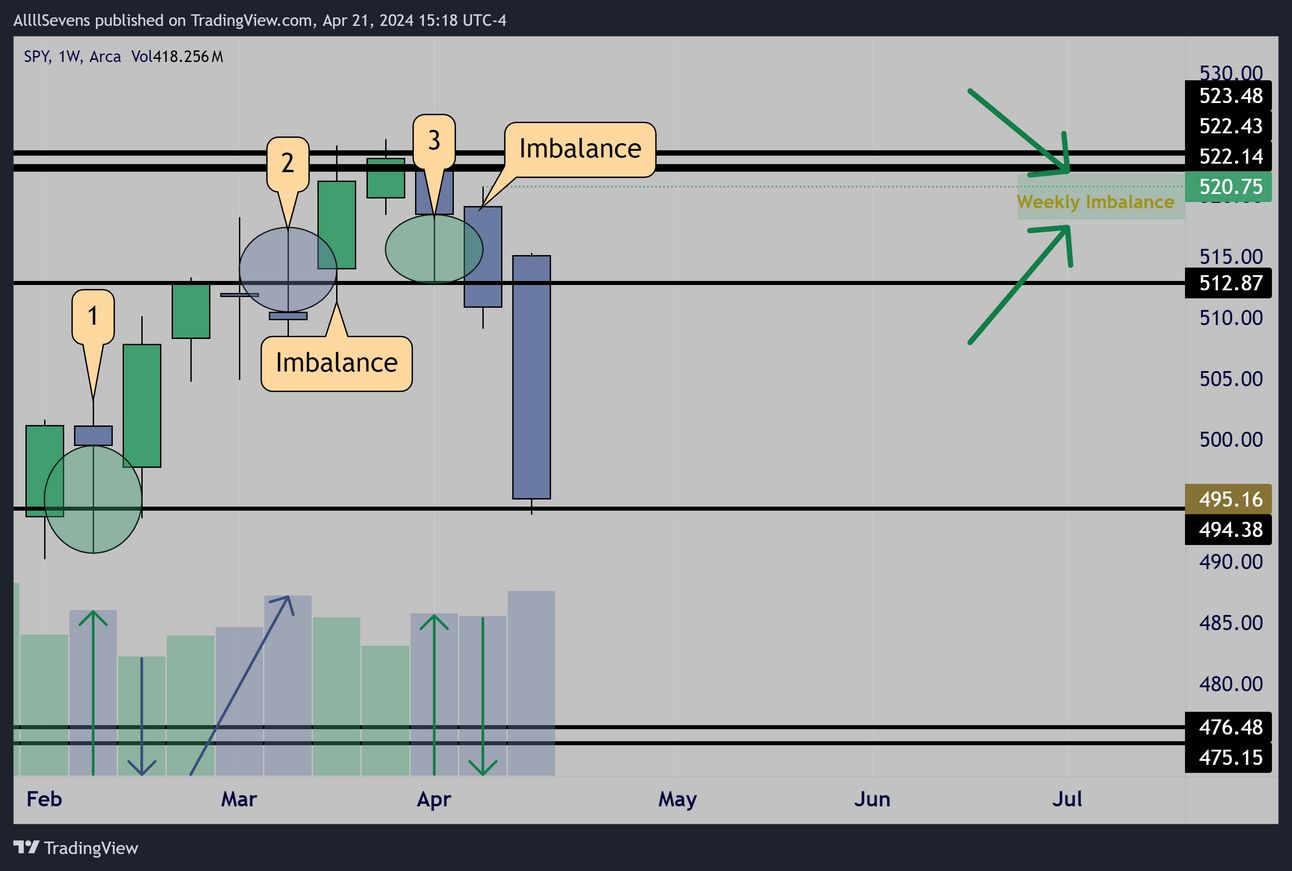
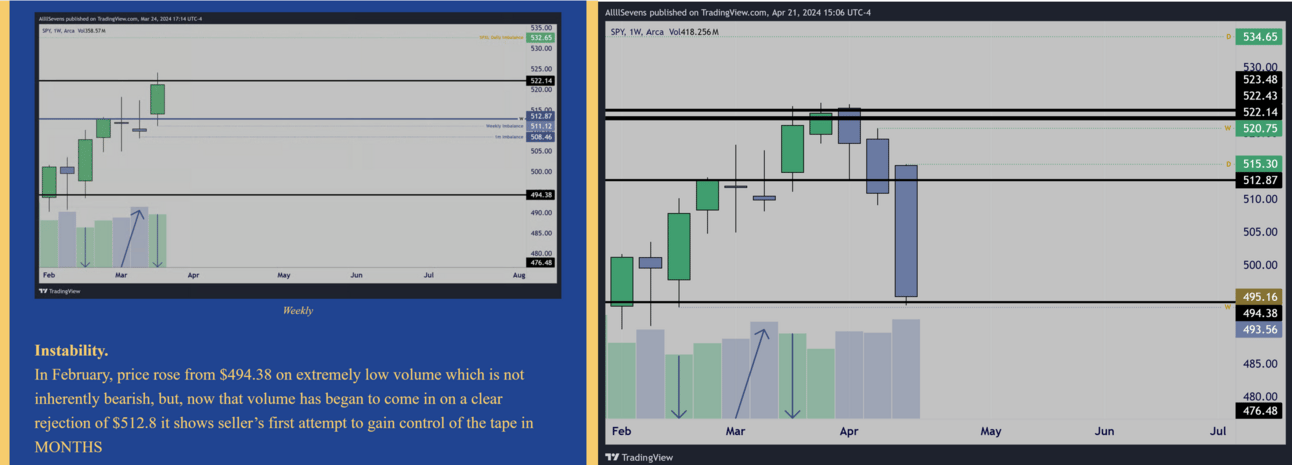
Weekly
1- Accumulation off $494.38
This lead to a low volume move higher, which isn’t inherently bearish until there is a distribution confirming the weak push…
2- Distribution off $512.87
The next week, price gaps over this resistance and FOMC places a bull trap, pushing price higher on low volume and creating an imbalance at the candle’s low. Over the following sessions, MASSIVE amounts of dark pool transactions came in at highs creating the $523.48 resistance and allowing price to roll over and rebalance.
3- Accumulation off $512.87
As price came to retest the previously distributed (weak) support…
We see re-accumulation.
The next week, price loses this support on an increased spread with decreased volume. An imbalance is created at this candle’s high.
Two accumulations & one distribution + a bullish imbalance.
Bulls have something here.
Notice though, the imbalance above does not support a full reclaim of the $523.48 dark pool, just a push back into resistance.
This is notable, and one reason why I refuse to look for a stable swing low here. I think a bounce here could easily reject resistance above.
$494.38 is THE level to hold on a weekly time frame if this monthly candle is going to be prevented from closing as a very bearish engulfing candle with volume. Hold this level, and the current pullback is at least halted for the time being. Price could chop, and/or potentially rally back into resistance.
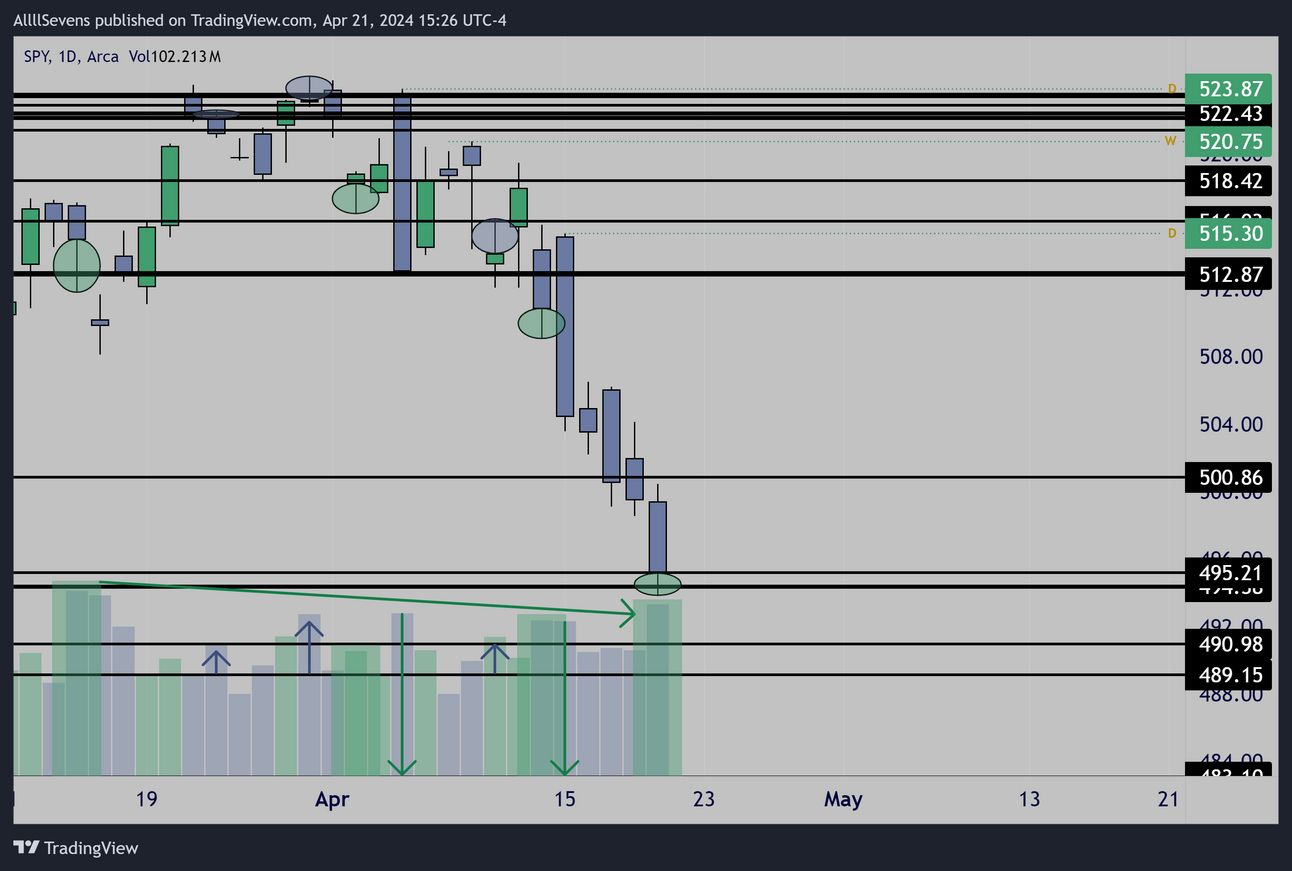
Daily
The daily chart shows with extreme clarity the lack of sellers on the recent sell-off. It is a giant bullish VOLUME consolidation and there is no denying this. Sellers are exhausted. Waiting for a bounce before even looking to open swing shorts is THE read here.
Why not swing long then? Because there’s really no strong reversal pattern present here… Just exhausted sellers.
And, what is most notable here is while sellers clearly have no merit, buyers are NOT being very aggressive on this dip.
In fact, it seems like they’re purposefully lacking aggression…
As price recently lost $512.97, it showed accumulation.
However, it could not hold support. This lead to the gap up the following day to be overpowered by retail sellers.
Price continued falling and spreads began to shrink as the next support was reached… but volume did not spike and signal accumulation.
Last Friday’s candle finally spiked in volume and shows some buyers…
But again, how aggressive are they really being? No hammer formed.
Support was held, but the lower wick on this candle is BARELY larger than the upper wick. Buyers, but not aggressive buyers.
So, price has been falling on blatantly inefficient volumes and opening short swings here is practically begging to get squeezed out on a pop…
Why are buyers being purposefully weak? If a bounce is likely going to come due to this seller exhaustion why aren’t institutions being aggressive buyers?
Well, I explained two reasons why using the monthly & weekly charts.
As for the daily,
Here’s my prediction:
We are going to see a very similar sequence as to what AAPL recently experienced. AAPL had been moving lower and lower on the Daily backed by very little volume… It finally exploded upwards… and volume poured in… not at the lows, but at the highs.
Retail fomo’d in on the “confirmation volume” as price finally rose, but institutions were actually selling out!
See this example in my tweets here : click here
SPY is in nearly the same exact environment.
Price is falling on low volume which could result in a high volume pop here soon… All of the people who are scared to buy the dip here at lows will surely feel comfortable once a high volume green candle forms…
Just like they did on AAPL
We will see institutions distribute the pop to confirm this thesis and a swing short will set up!
Conclusion
I am currently a DAY TRADER with absolutely 0 bias.
There’s no A+ swing edge for me here either direction.
I have laid out a few scenarios I believe we could see into the end of the month, all of which aren’t actionable until we see confirmation.
I will be trading and updating whatever happens DAILY on 𝕏 !!
Follow me here https://twitter.com/SevenParr
Overall, I am flat. I am willing to day trade either way here-
For me to want to swing short, I need a dead cat bounce very similar to what AAPL did two weeks ago.
For me to want to swing long and actually catch a dead cat bounce, I’m going to need to see a new low, and a strong daily hammer form otherwise, I will “miss out” and only day trade it.
Good luck this week and thank you for reading.
Reply