- AllllSevens
- Posts
- Fueling My Portfolio
Disclaimer
Before you read this newsletter, it is crucial to understand the following:
-Background: I am a 22 year old college dropout with no formal education or professional experience in the fields of finance, investing, or stock market operations.
-Content Nature: All information I share is purely speculative and represents my personal, abstract opinions.
-Take With Caution: Approach the ideas, concepts, and data presented with a healthy dose of skepticism. They should not be considered as definitive or accurate information.
-Not Financial Advice: This content should in no way be interpreted as financial or investment advice. It does not constitute a recommendation to buy, sell, or hold any securities or financial instruments.
-Investment Risk: Investing and trading the stock market involves significant risk, including the potential for substantial financial loss.
-Professional Consultation: Always consult with a licensed financial advisor or perform thorough personal research before making any financial decisions involving the market.
-Liability Disclaimer: I bear no liability for any financial losses that could result from actions taken based on the information provided.
Lastly,
Understand that while I speak in certainties, no such thing actually exists.
This is all speculation.
Preface:
This week, I am laying out my plan to allocate 20% of my portfolio towards a long position in the energy sector, leveraging the robust long-term uptrend I see potentially developing.
XLE
The core of my thesis is on much higher time frames, but the weekly chart is where I am seeing my A+ entry pattern, so we will start here and slowly zoom out to the bigger picture in play.
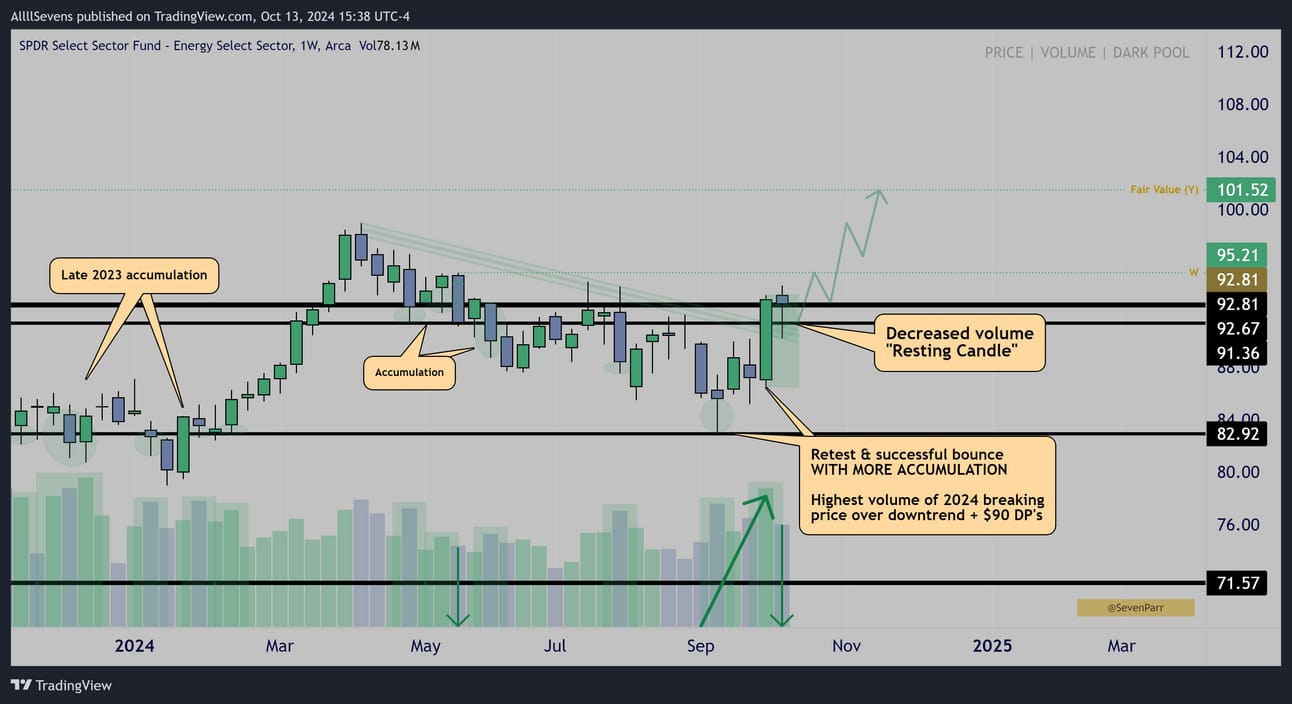
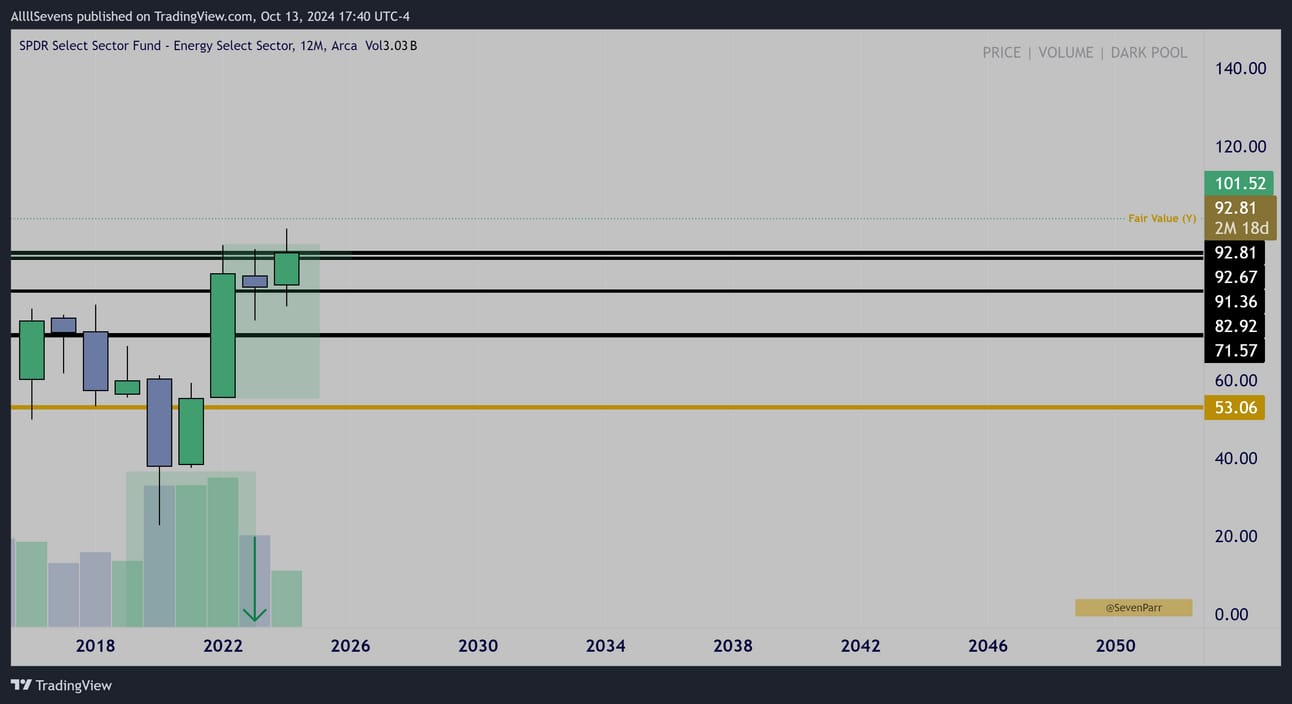
Weekly Interval
In late 2023, institutions ran a massive accumulation campaign on the XLE at the $82.93 Dark Pool, seen through the volume build up and lower wicks.
This lead to a significant price surge during the first quarter (Q1) of 2024.
Price stalled when Q2 began, and fell into a holding pattern, AKA a ‘bull flag.’
This bullish consolidation lasted the entirety of Q2 and Q4
Institutions used this as an opportunity to accumulate even more shares, this time off the $91.36-$92.81 Dark Pools
Eventually, price managed to slip all the way back down to where the accumulation first began…. Once again, major accumulation occurred.
Price quickly reversed from $82.93 and the highest weekly volume of the entire year reclaimed $91.36-$92.81 + broke downtrend resistance.
A statement to begin the Q4
Last week, price retested the breakout and held steady, forming what I call a ‘resting candle’ on decreased volume, which after a high volume impulse, often leads to continuation of the of the high volume move.
If $91.36-$92.81 continues to hold, I believe there is a very high probability that this is the start of a two-quarter long ‘bull flag’ breakout which could lead to a very large and elongated upside move.
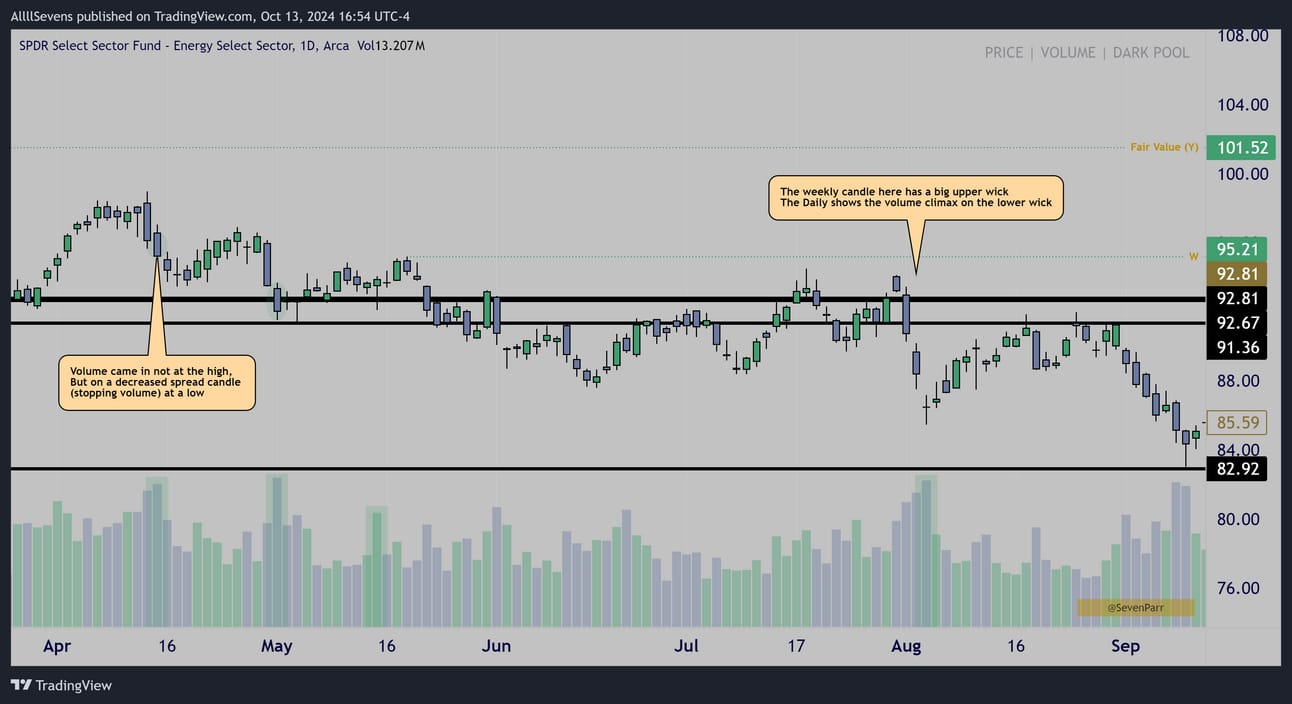
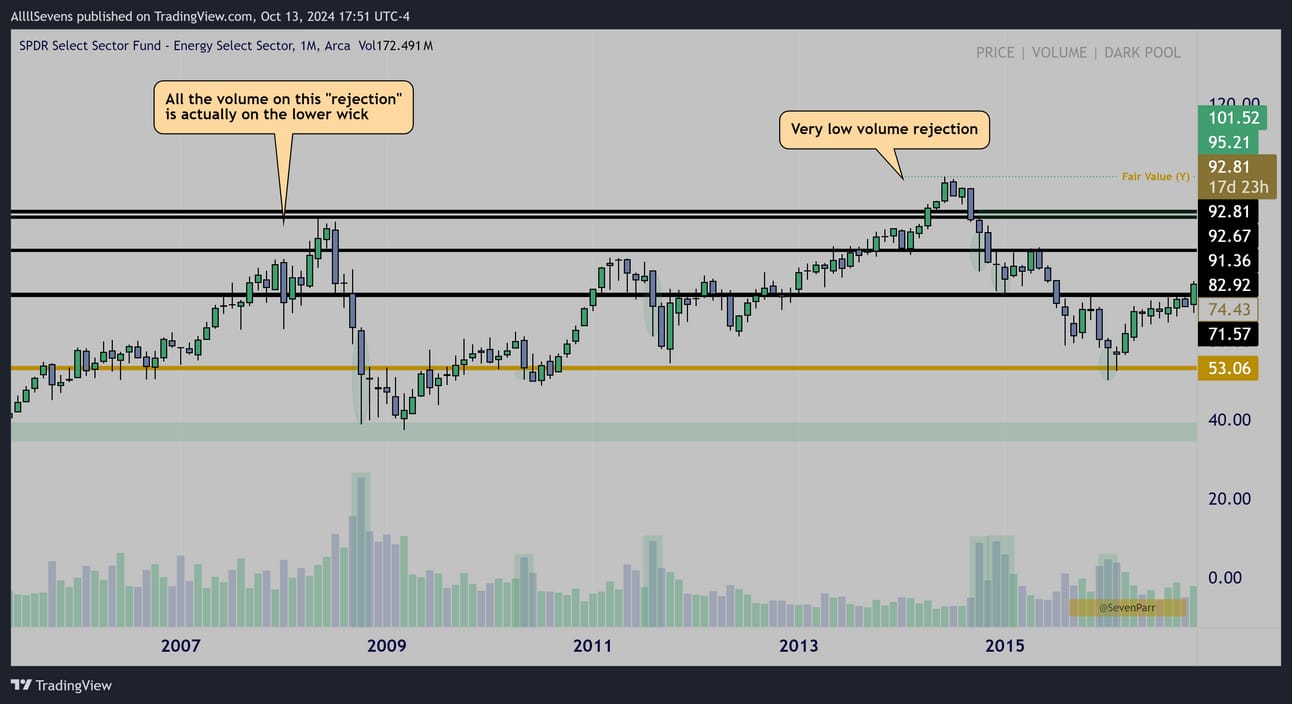
Daily Interval
Before I move forward, there are two large spikes in volume on the weekly chart that you may have questioned as bullish.
The daily chart shows it best for those two candles.
Next, I want to outline that not only is price potentially breaking out of a two-quarter bullish price compression, but price has been battling this $91.36-$92.81 Dark Pool cluster for quite some time now… This week’s bullish pattern could be THE time it finally gets successfully turned into support for a MAJOR breakout.
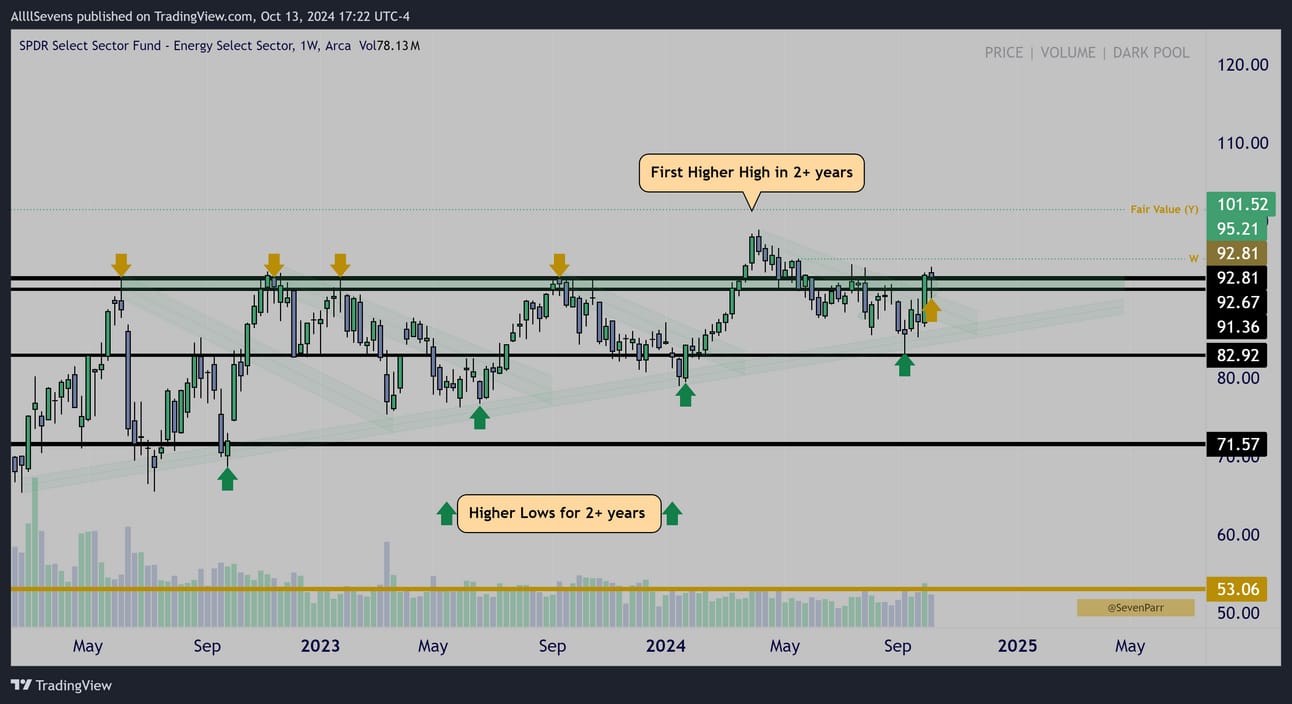
Weekly Interval
For over two years price has been pinned below $91.36-$92.81, rejecting multiple times, but always setting a higher low.
Q4 of this year marked the first higher high of the sequence, and as outlined previously, it is strongly supported by institutional investors.
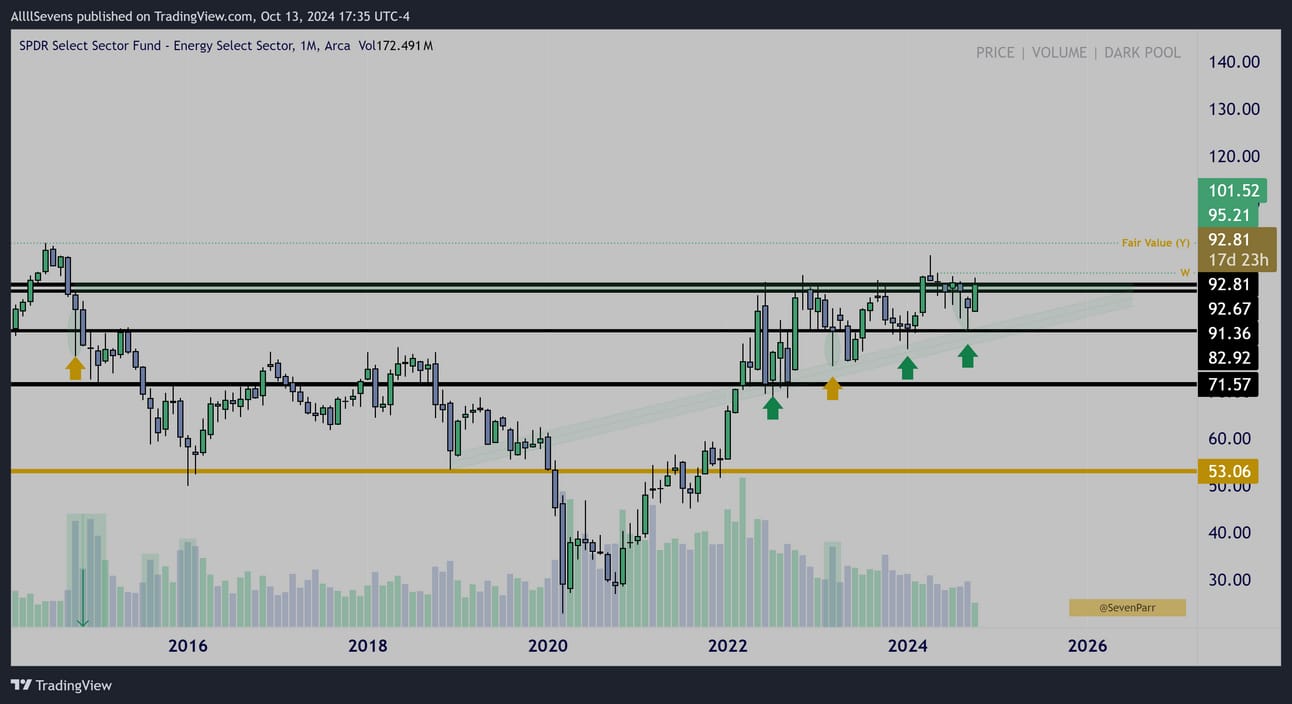
Monthly Interval
This time frame best displays the pattern here-
It’s a classic ‘ascending triangle’ upside continuation pattern.
We can also see here that this isn’t the first tie the $82.92 Dark Pool has been accumulated by institutional investors. They have been accumulating shares here for multiple years now- in anticipation of an eventual long-term breakout…
Yearly Interval
This is where things get crazy to me. We start to see a “fractal” on the yearly-
Our weekly and monthly patterns are patterns within a pattern.
The weekly low volume resting candle after a large volume impulse?
Same exact pattern on the yearly time frame.
And just like the weekly saw a very profound spike in volume - highest all year -
2022’s yearly volume was the highest since 08’
The monthly ascending triangle can also be considered a fractal since it’s another upside continuation pattern, within this yearly upside continuation pattern - it’s just not the same exact formation.
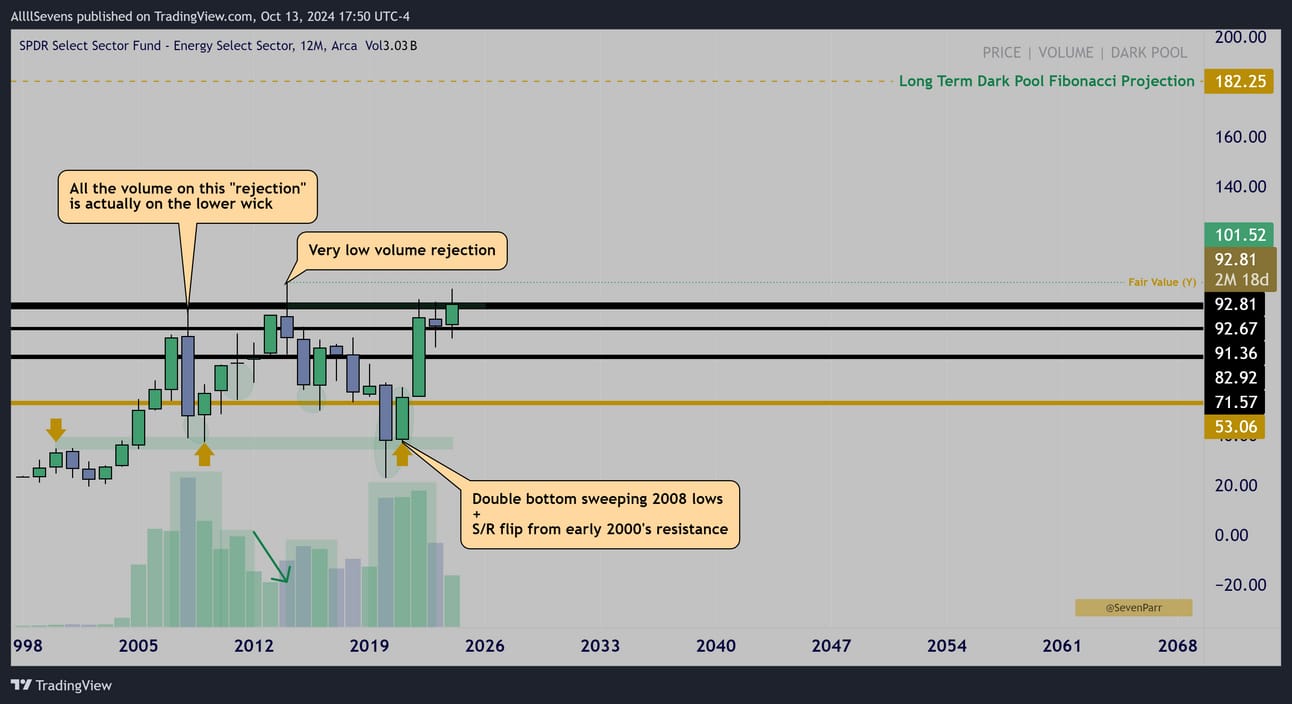
Yearly Interval
Monthly Interval
Truly zooming out, the XLE has been sideways for over two decades.
The whole time, being accumulated by institutions.
This upside continuation pattern we’re now seeing, right at ATH resistance, which we know is not a strong resistance (retail has sold it, institutions have bought it), is coming off of a double bottom / sweep of 2008 lows which feels like a major STATEMENT to me. Sound familiar?
Another ‘fractal’
It seems as though every single time frame is aligned perfectly for a long-awaited secular trend to emerge in this sector.
In a recent newsletter, I said the same about Financials.
These are the two “most-hated” long-term sectors in the entire world- shown by their extreme underperformance over the last twenty years.
Is it a coincidence that these are also the two most heavily concentrated sectors for Dark Pool activity?
XLK- $45B
XLF- $112B
XLV- $54B
XLY- $24B
XLC- $24B
XLI- $42B
XLP- $44B
XLE - $83B
XLU - $34B
XLRE-$11B
XLB- $19B
Perhaps while retail has been generally uncertain surrounding the future of these stocks, institutions have absorbed record amounts of shares for an eventual long-term outperformance.
I think sooner or later (sooner), retail money is going to flow into these. Big time.
If I am correct, and this is The Dawn of The Bull Market, I think these two sectors may offer the most “parabolic” move over the coming decades.
Here’s a fun fact:
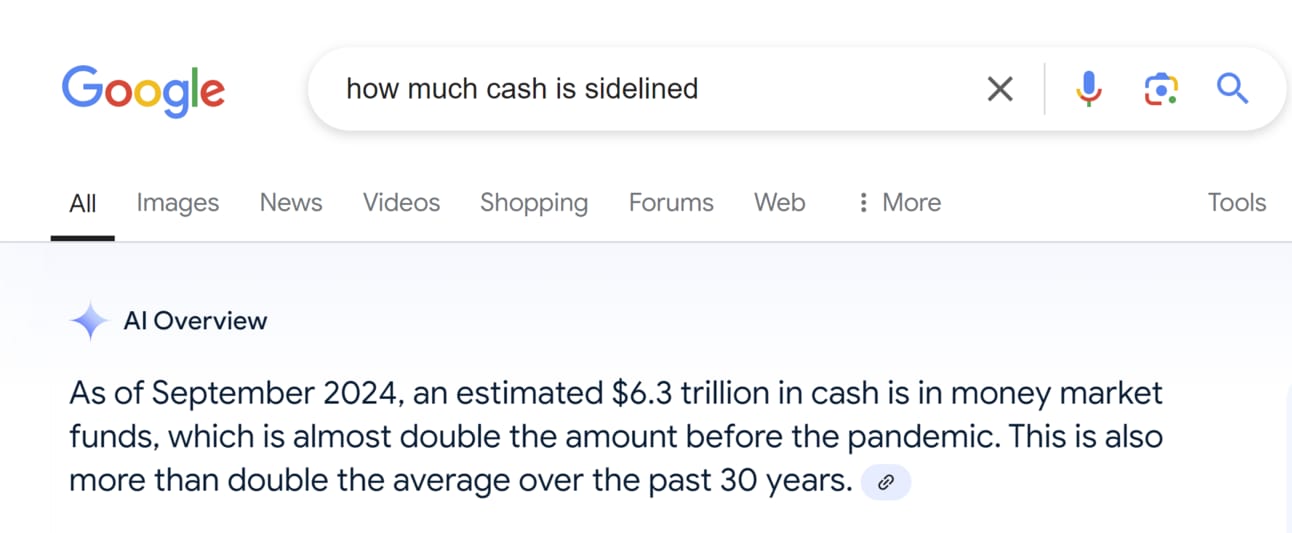
This is retail money. Sidelined.
And as we know, RETAIL participants are the primary drivers of price trend.
See this tweet.
The largest moves in stock market history are driven by retail.
The stat above, on top of all the institutional accumulations I’ve outlined on the SPY and every sector inside, shows we have FUEL for a prolonged bull market.
What happens when retail FINALLY starts to buy?
Sign up for my next newsletter here.
Click here to upgrade your subscription and gain access to my Discord as well as future premium newsletters. In Discord, I have highlighted each of the individual names in this sector that I am focusing on, as well as the leveraged XLE
If you’re interested in tracking dark pool data and unusual options flow yourself, here’s my affiliate link for BlackBoxStocks, the platform I use:
http://staygreen.blackboxstocks.com/SHQh
Find me on DUB! Here.
-Must read disclaimer.
(I will write a more official newsletter promoting what this is soon)
In short, you can view, and even copy my portfolio on this App.
Reply