- AllllSevens
- Posts
- $MARA- Trade Idea
Disclaimer
I am not a legal professional.
The content shared in this newsletter is purely my personal opinion and for information purposes only.
You should not interpret any of this as investment or financial advice.
The statements I make are not solicitations, recommendations, or endorsements to buy or sell a security or financial instrument.
I am not a fiduciary on account of your viewing of this information.
You are solely responsible for the risks involved with the use of any information shared in this newsletter.
By using this site and reading this newsletter, you agree to not hold me, my affiliates, or any third party liable for decisions you might make based of information shared in this newsletter.
MARA
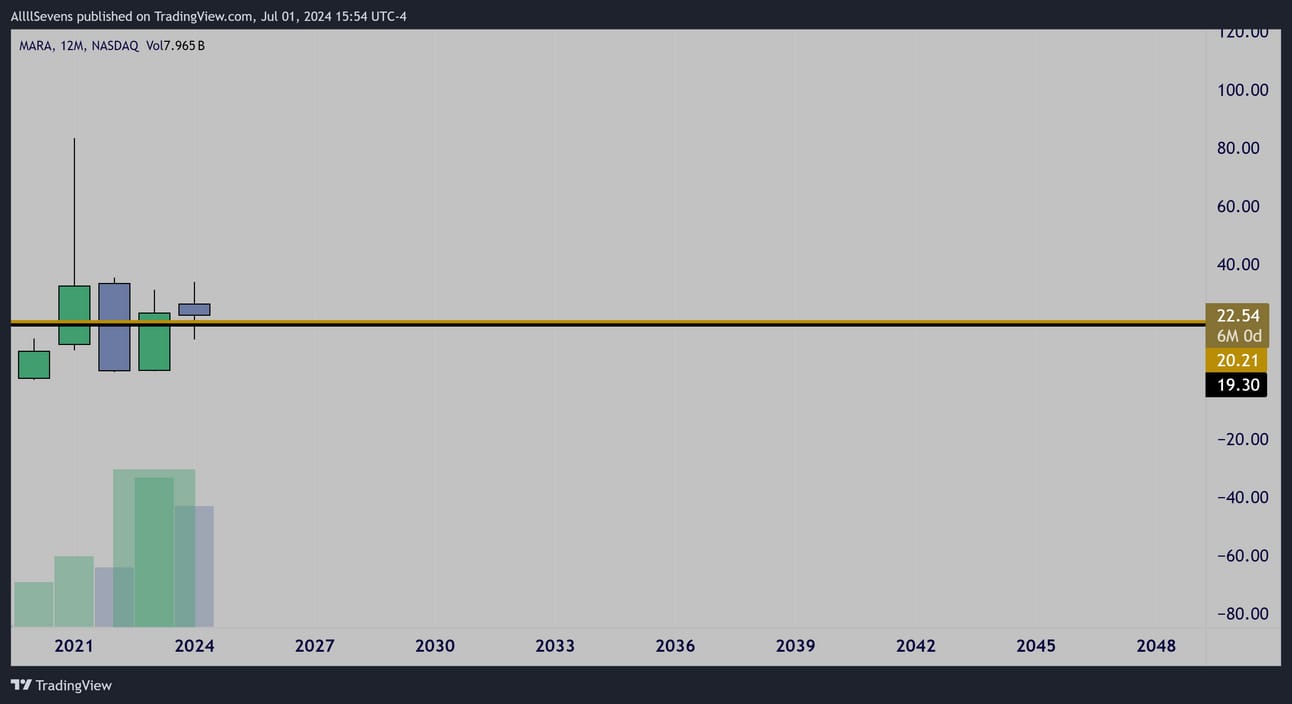
Yearly Interval
Last year, MARA formed an inside candle on it’s highest volume ever.
A high volume inside candle typically favors a reversal.
In this case, an upside reversal.
In 2024, price attempted to push to new yearly highs, failed, and is now retesting it’s largest dark pool (DP) on record @ $20.21
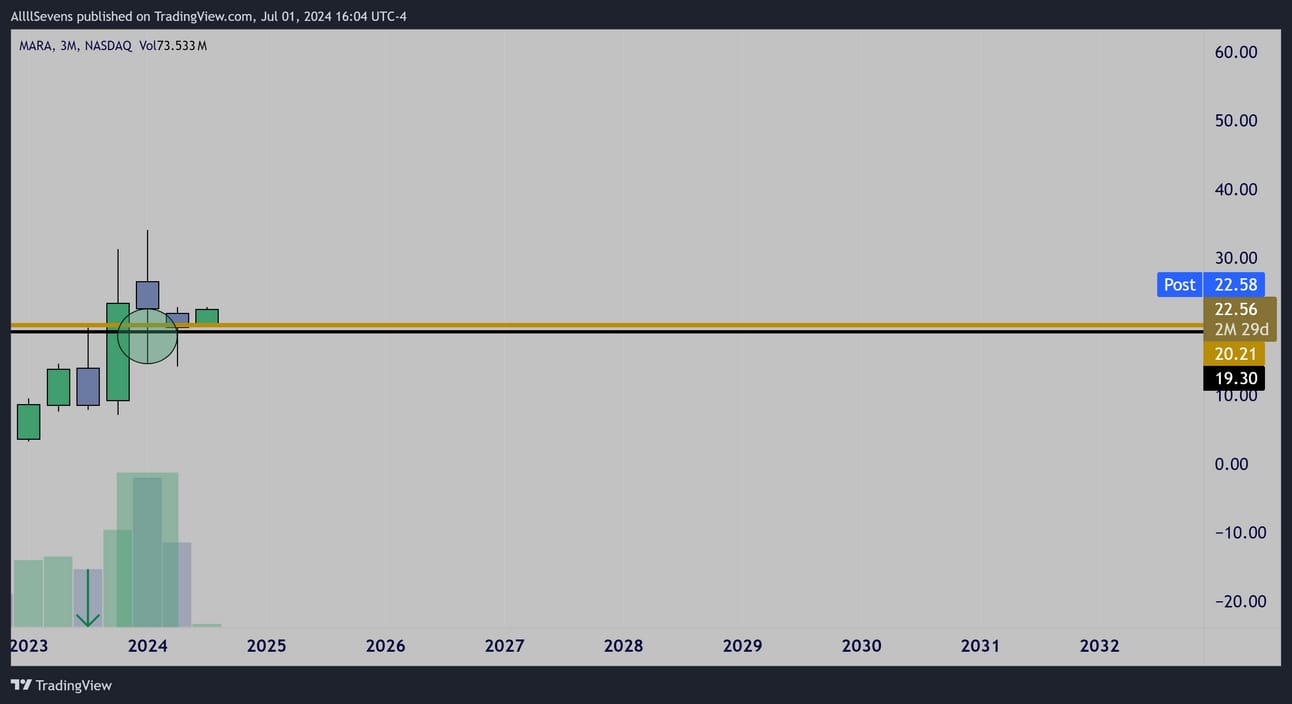
Quarterly Interval
In the second half of 2023 we saw a low volume rejection of this DP
which allowed for the increased volume breakout and yearly candle close over this level.
Then, in the first quarter of 2024 price retested and once again the stock saw it’s highest volume ever-
This time, forming high volume lower wick signaling buyers defending the breakout & retest.
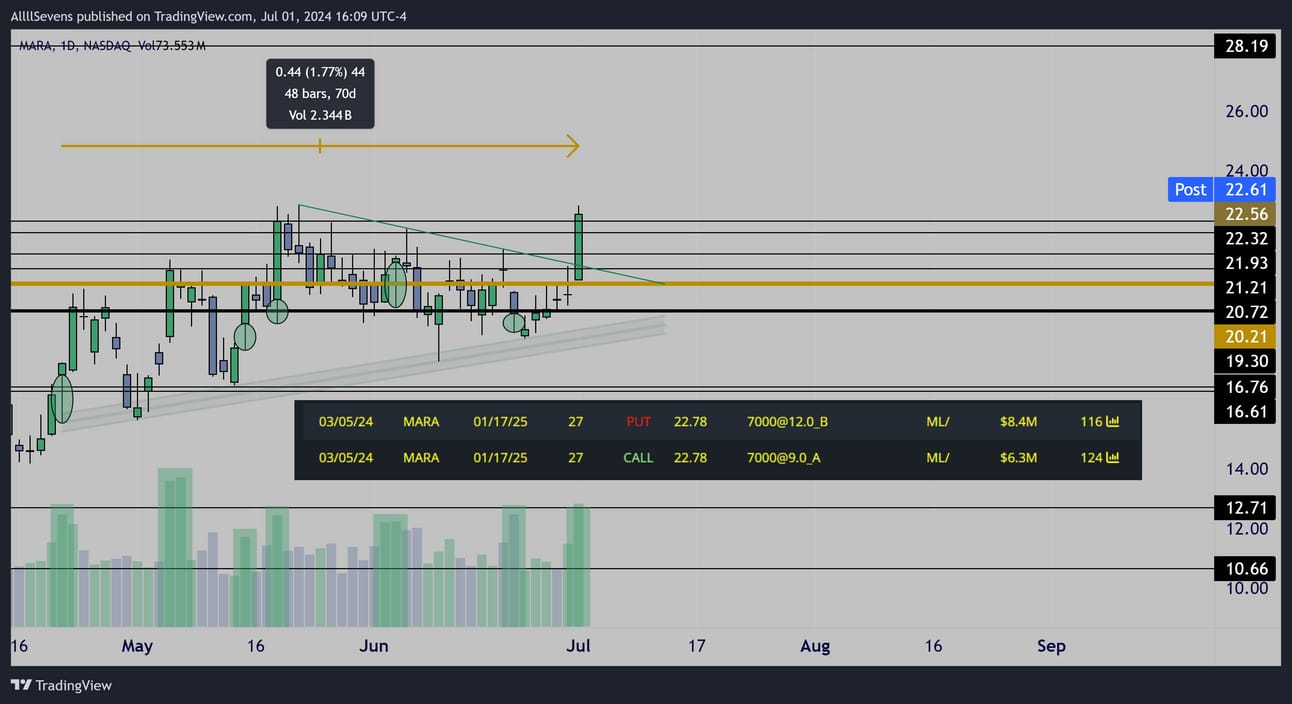
Daily Interval
For over two months price has been compression & accumulating.
Just today, a breakout is being attempted, on convincing volume.
Way before this compression began, a very unusual and notable piece of options flow came in… I’ve waited months to share this as the chart didn’t quite seem ready at the time (executed om 3/05)
With today’s potential breakout confirmation, I believe it’s an appropriate time to share this data.
A trader purchase $6.3M worth of 1/17/25 27c’s @ 9.00 per contract
They are currently trading 40% lower @ 5.45 per contract
An unrealized loss of about $2.5M
They also sold $8.4M worth of 1/17/25 27p’s @ 12.00 per contract
These are currently trading 25% lower @ 9.05 per contract
An unrealized gain of about $2M
As far as I can tell, this trader is still in their position, down about $500K and with today’s breakout they could be looking at a bigger profit by EOY
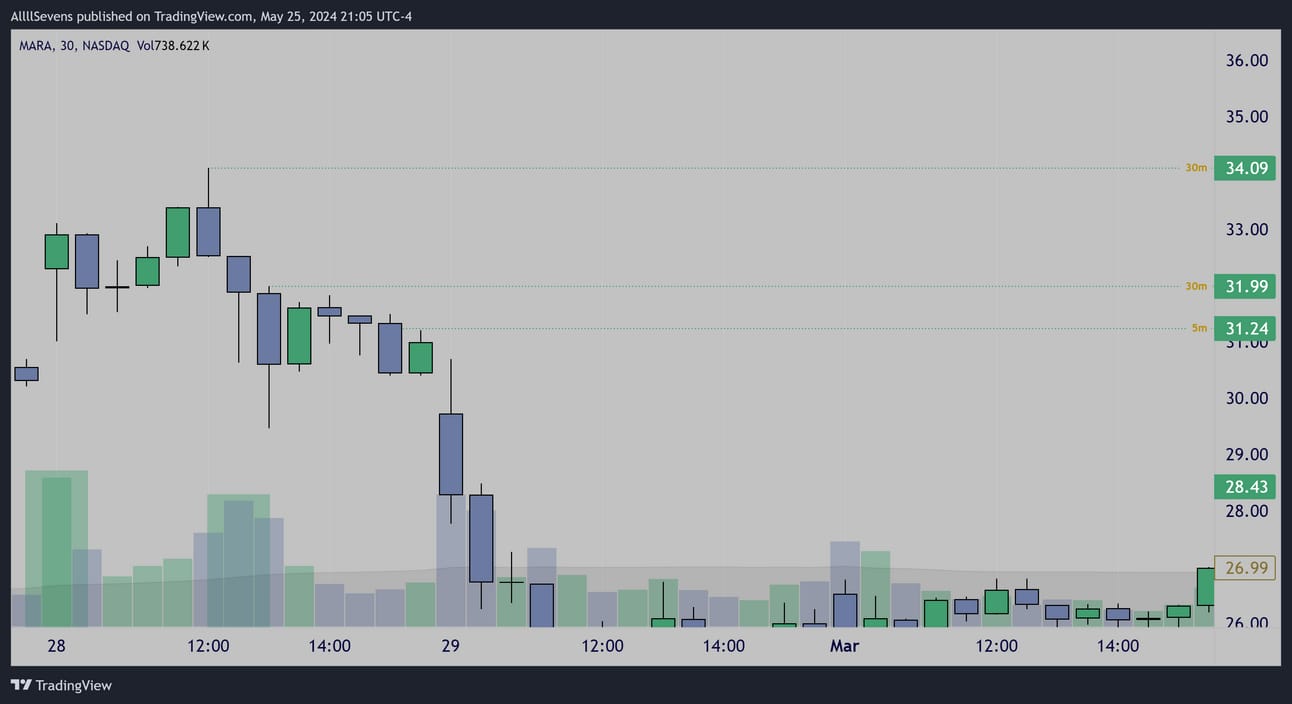
30m Interval
Going back to the intraday chart when MARA topped out earlier this year, some 30m accumulations suggest price can at least get back to $34
Conclusion
In simplest terms, MARA is a Yearly/Quarterly breakout and retest of it’s largest dark pool on record @ $20.21
This should theoretically get price back up to at least $34, and if the yearly pattern is going to fully play out, then potentially much higher.
If price fails this breakout and loses $20.21 my thesis is invalidated for the time being. Ideally, price doesn’t even retest this breakout.
The real “retest” was on the quarterly chart earlier this year…
So, after compressing for over two months and finally breaking out, I don’t see why another retest would occur, unless the breakout is actually failing…
The whale on the options flow here is extremely notable.
That is massive size for a “risk reversal”, buying calls AND writing puts.
I think this is more of a commons play, but those calls are definitely appealing, being down 40% from our whale’s entry and sitting at about the same price level they first executed.
Follow & engage with me on Twitter/X for updates on this thesis!
https://twitter.com/SevenParr
If you liked this newsletter and want more analysis & trade ideas make sure to subscribe for more, and consider upgrading to receive my premium newsletters as well for just $7.77 / month.
Free:
https://allllsevensnewsletter.beehiiv.com/
Premium:
https://allllsevensnewsletter.beehiiv.com/upgrade
To view whales on the options flow, I use BlackBoxStocks
Here is my referral link:
http://staygreen.blackboxstocks.com/aff_c?offer_id=5&aff_id=2544
Reply