- AllllSevens
- Posts
- Premium Newsletter
Disclaimer
This newsletter presents my technical analysis and insights for informational purposes only. It is not financial, investment, or trading advice, nor is it a recommendation to buy, sell, or hold any asset. I am not a licensed financial advisor.
All content reflects my own personal opinions and commentary based on publicly available data as of May 5th, 2025. I am not liable for any losses incurred by others.
Past performance is not guarantee of future results.
Preface:
Join the Discord:
Some very notable flows on a lot of names today, covered in no particular order.
I hope you find value.
$TXN ( ▼ 1.3% ) $ARM ( ▼ 2.53% ) $NOW ( ▼ 1.58% ) $HD ( ▼ 0.57% ) $UNH ( ▼ 1.78% ) $ASML ( ▲ 0.28% ) $AMD ( ▲ 0.24% ) $DDOG ( ▲ 0.02% ) $UVXY ( ▲ 2.23% ) $SBUX ( ▼ 0.52% ) $XYZ ( ▼ 3.67% ) $EWY ( ▼ 0.19% ) $TSLA ( ▼ 4.38% ) $NVDA ( ▲ 0.41% ) $CARR ( ▼ 0.41% ) $TSM ( ▼ 1.44% ) $TEM ( ▼ 2.4% ) $TOST ( ▼ 1.81% )
TXN
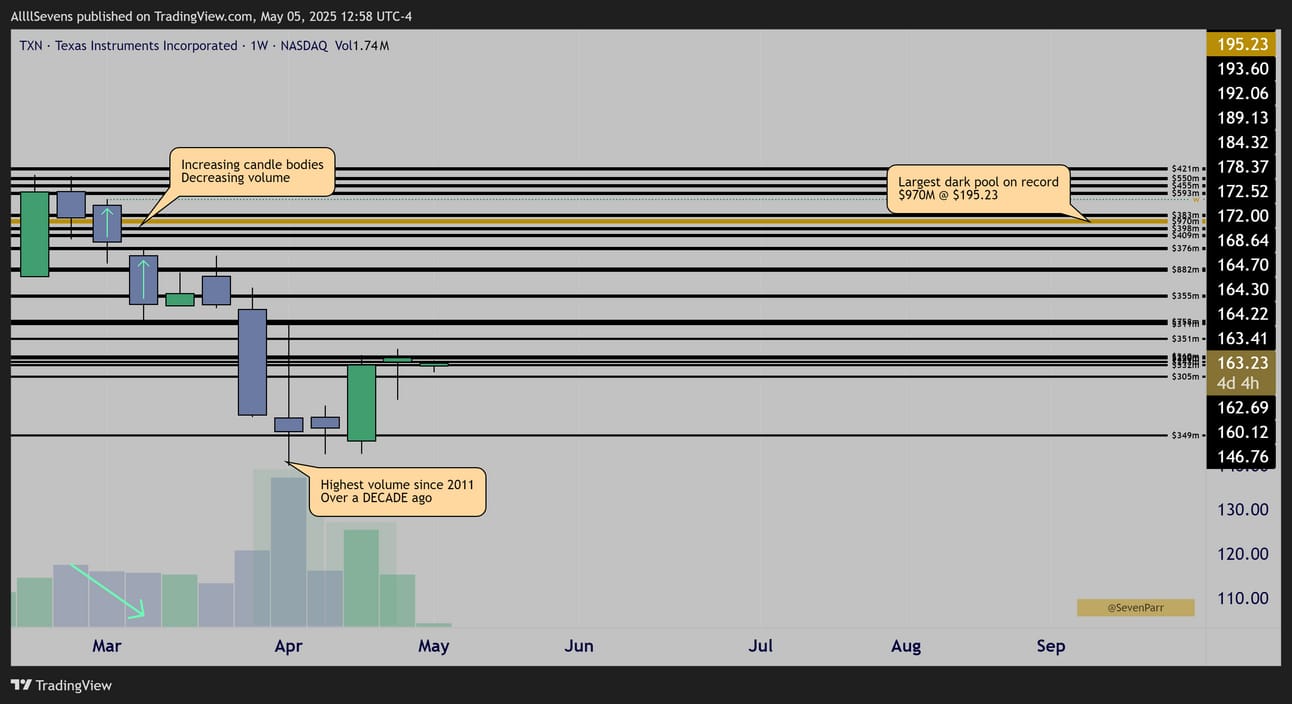
$TXN Weekly Candles
Extremely notable volume anomaly visible directly off the stock’s largest dark pool print on record. Institutions did NOT participate on the recent correction…
In fact, just a few weeks ago they executed the largest accumulation the stock has seen in over ten years… Unprecedented.
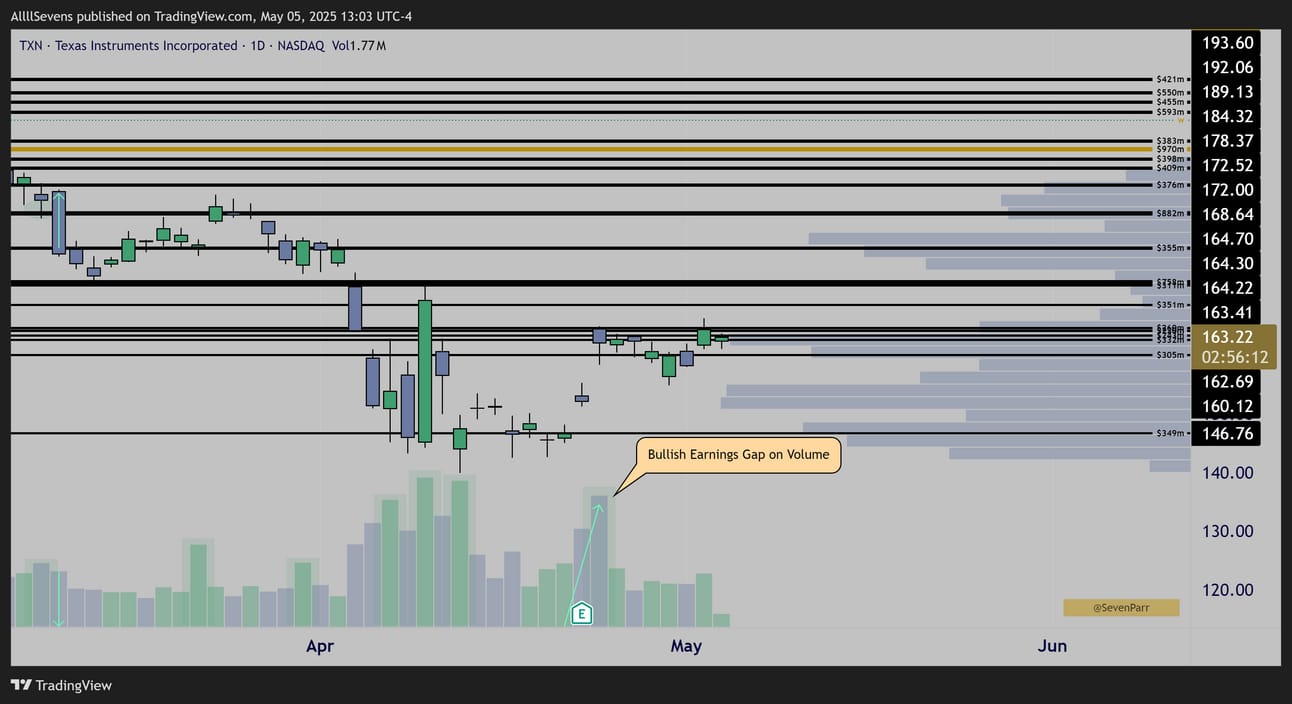
$TXN Daily Candles
Following the historic volumes in early April, creating the highest weekly volume in over ten years, the stock reported earnings, reacted positively, and created a bullish momentum gap AKA a “PEG”
ARM
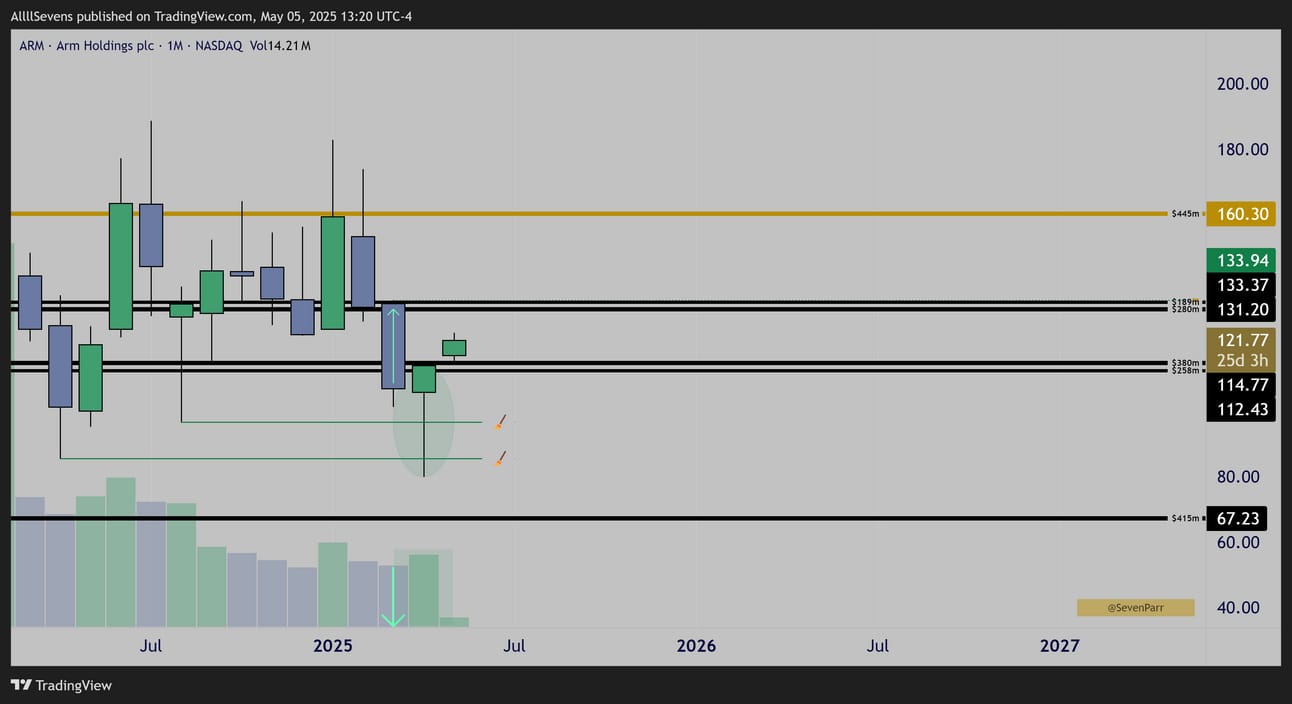
$ARM Monthly Candles
After a decreased volume anomaly sell-off in March, price swept multiple prior swing lows and defended a $638M dark pool cluster @ $112.43-$114.77
This shows retail participants have been selling since March from the $130 dark pools and finally got stopped out as price sliced through prior lows and the $100 psychological level, allowing for institutions to buy shares cheap.
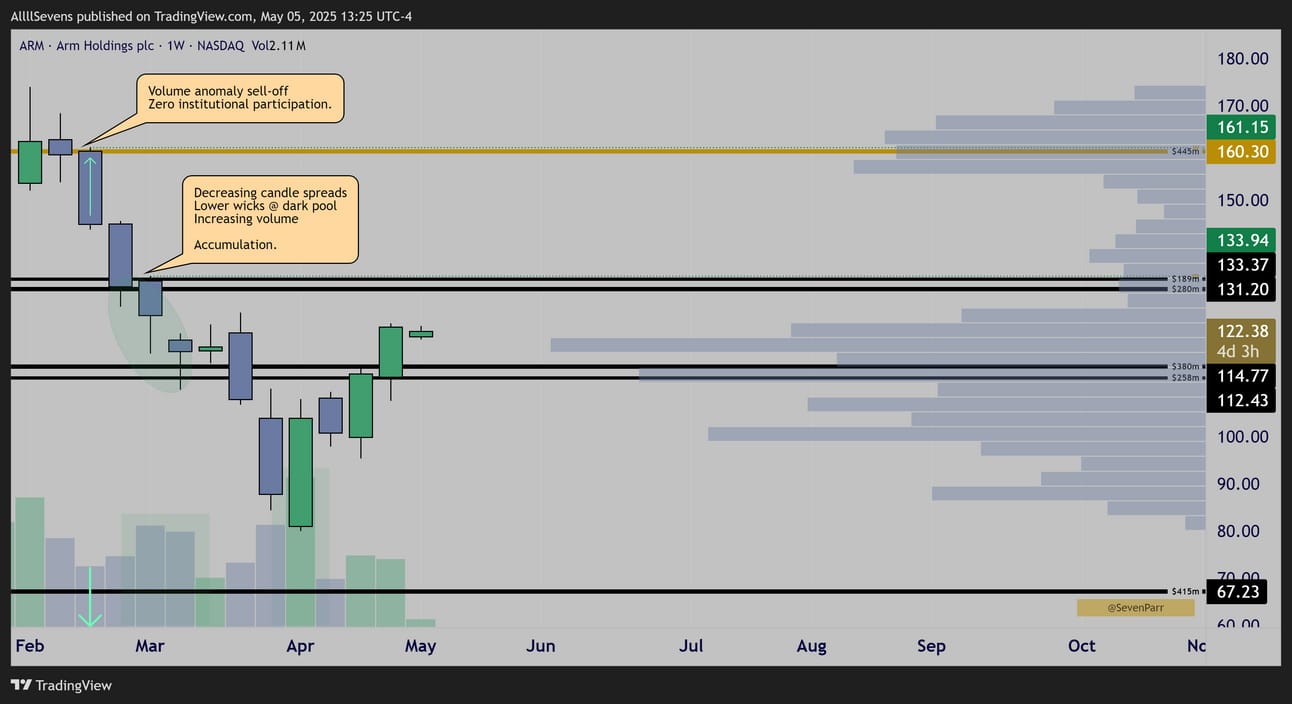
$ARM Weekly Candles
Retail wasn’t just selling from the $130 dark pools- institutions were buying.
Also, we have a blatant anomaly sell-off from the $160.30 dark pool, a $445M transaction, the largest on record for this stock. The fact that the largest dark pool ever recorded for this stick was sold off on decreased volume says a lot.
If institutions used that level to dump the stock, there would not be decreased volume on a huge sell-candle off that level. This is extremely notable.
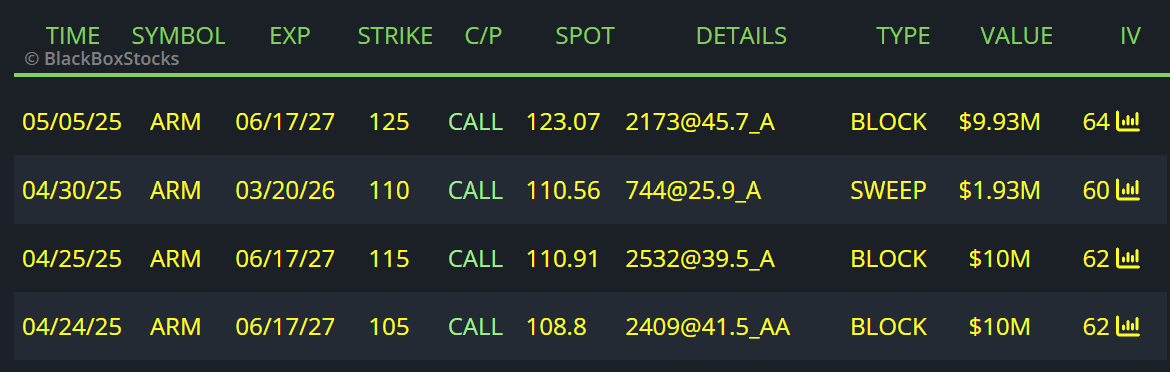
Over the last few weeks, there have been boat-loads of leap calls being purchased on this stock. With what I’ve outlined above, it makes sense.
NOW
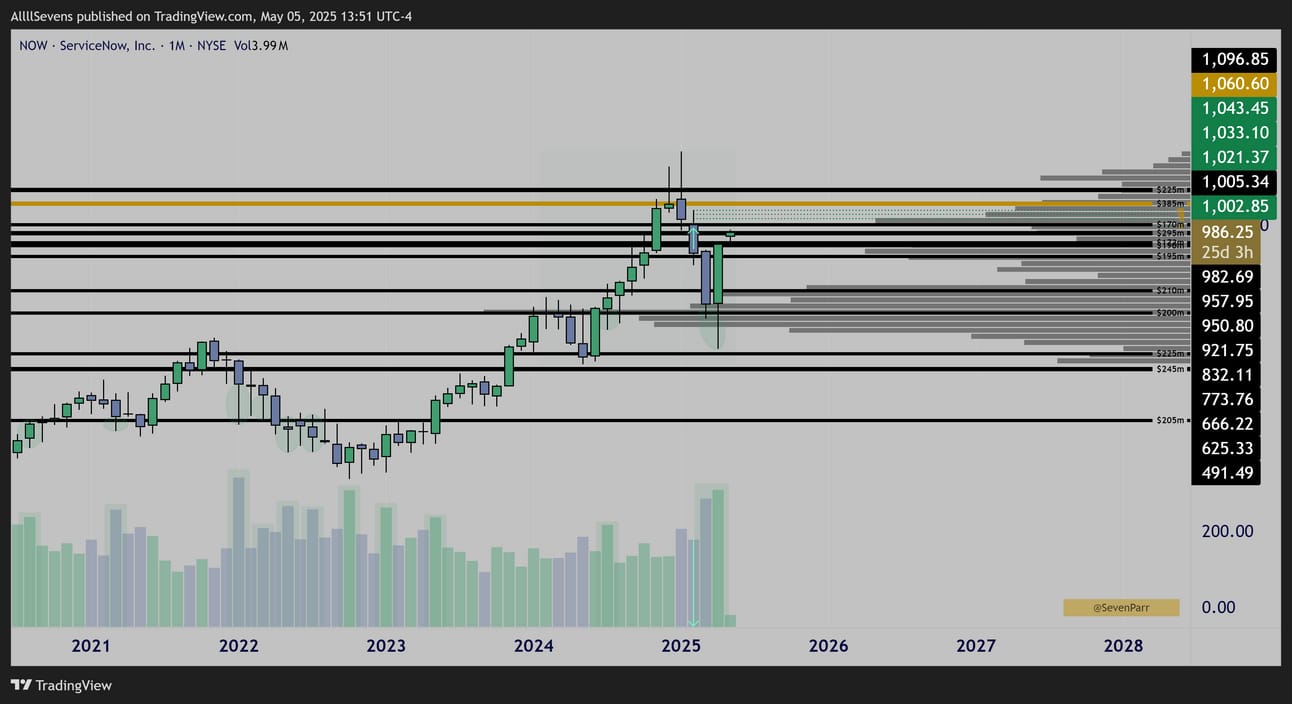
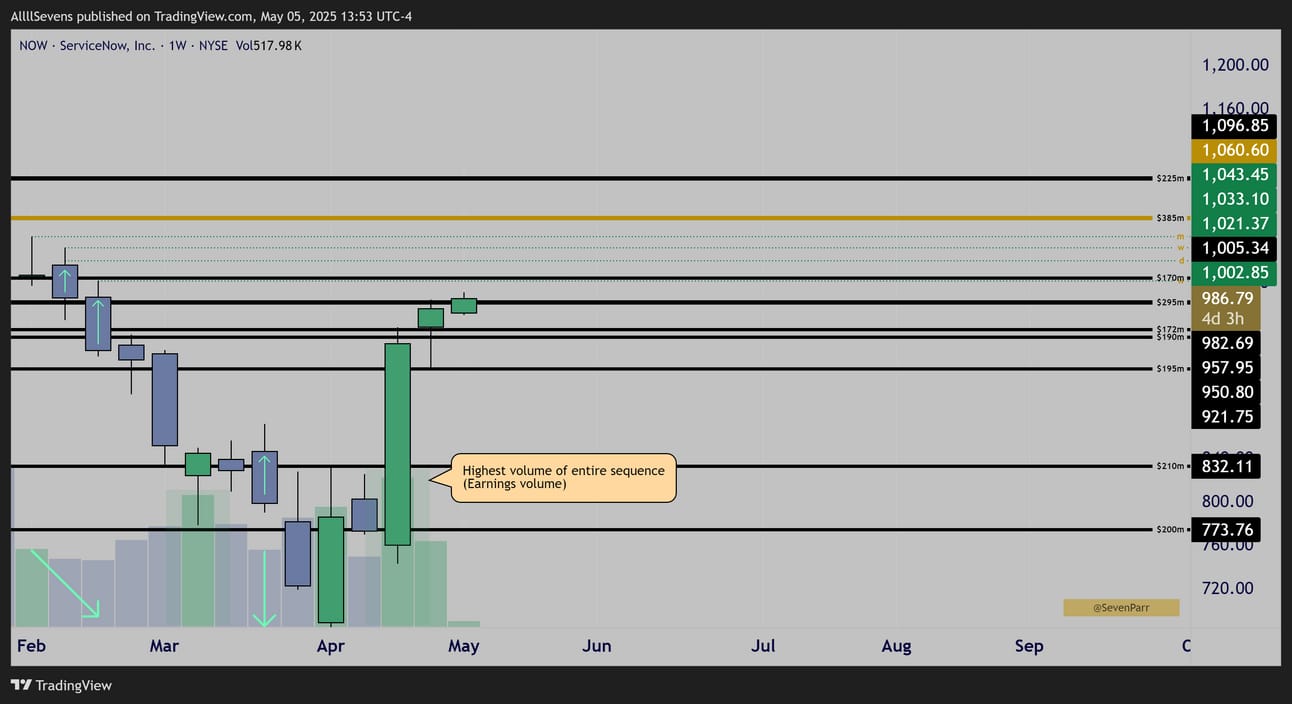
$NOW Monthly Candles
After being heavily accumulated throughout 2021 & 2022, on those same buyers stepped in over the last two months, bringing price back up 45% after a 45% correction. Last months candle bullish engulfing the prior & sweeping its low.
Also notable is the discount sell-off created in February.
$NOW Weekly Candles
Re-enforces Febuary’s discount sell-off.
Price is attempting to reclaim a prior area of zero sell-pressure with a massive surge in volume showing institutions are being very aggressive, not just off the lows but as price reverses rapidly.
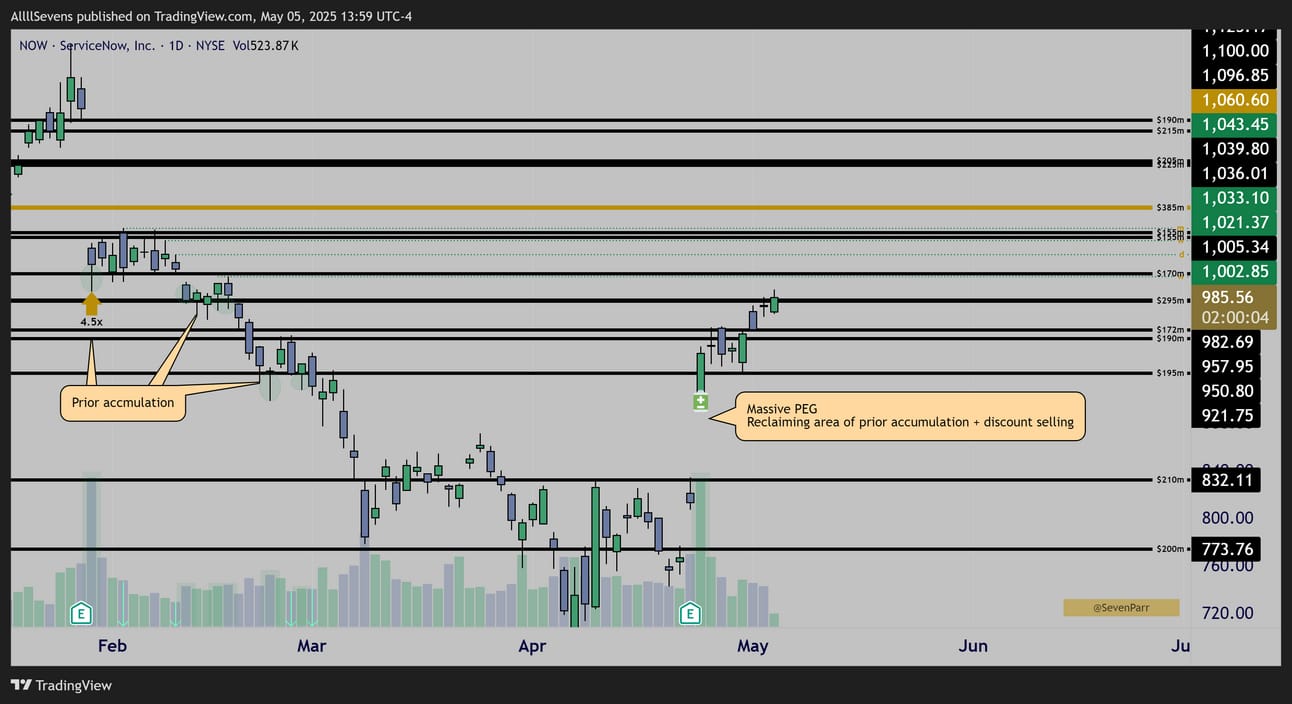
$NOW Daily Candles
We can start to see why institutions are maintaining aggression…
Not only did this area show prior retail selling, but it was accumulated on very significant volume specifically on January 30th, the last earnings report before the most recent one.
This marks two back-to-back earnings reports where institutions saw reason to make significant investment…
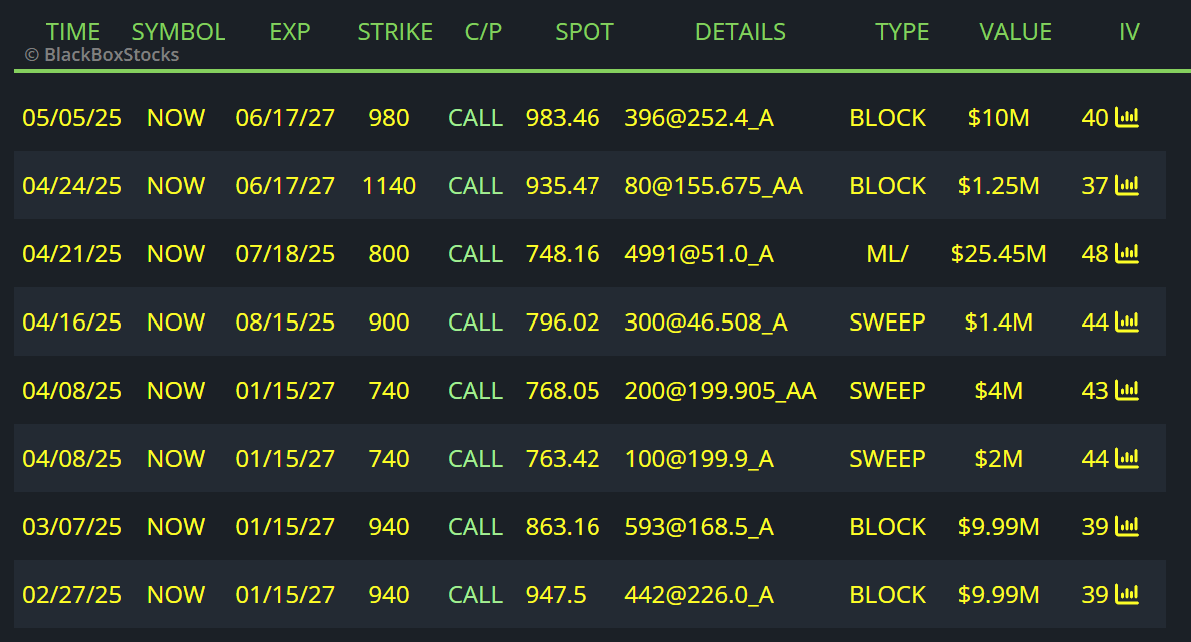
The most recent report, price finally agrees, forming a bullish momentum gap and reclaiming a prior area of support. This could be big, and it explains the recent options flow…
(most of this flow came in at much lower prices. I am already up nearly 30% on my share position here because I was logging that data in the DISCORD. Please join the discord and be active! Ask me questions. Discuss. Etc.)
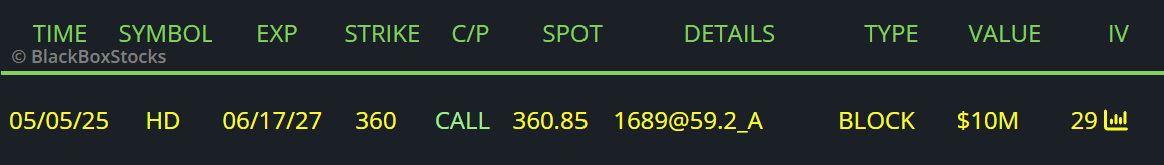
These whales are STILL active adding another $10M today.
HD
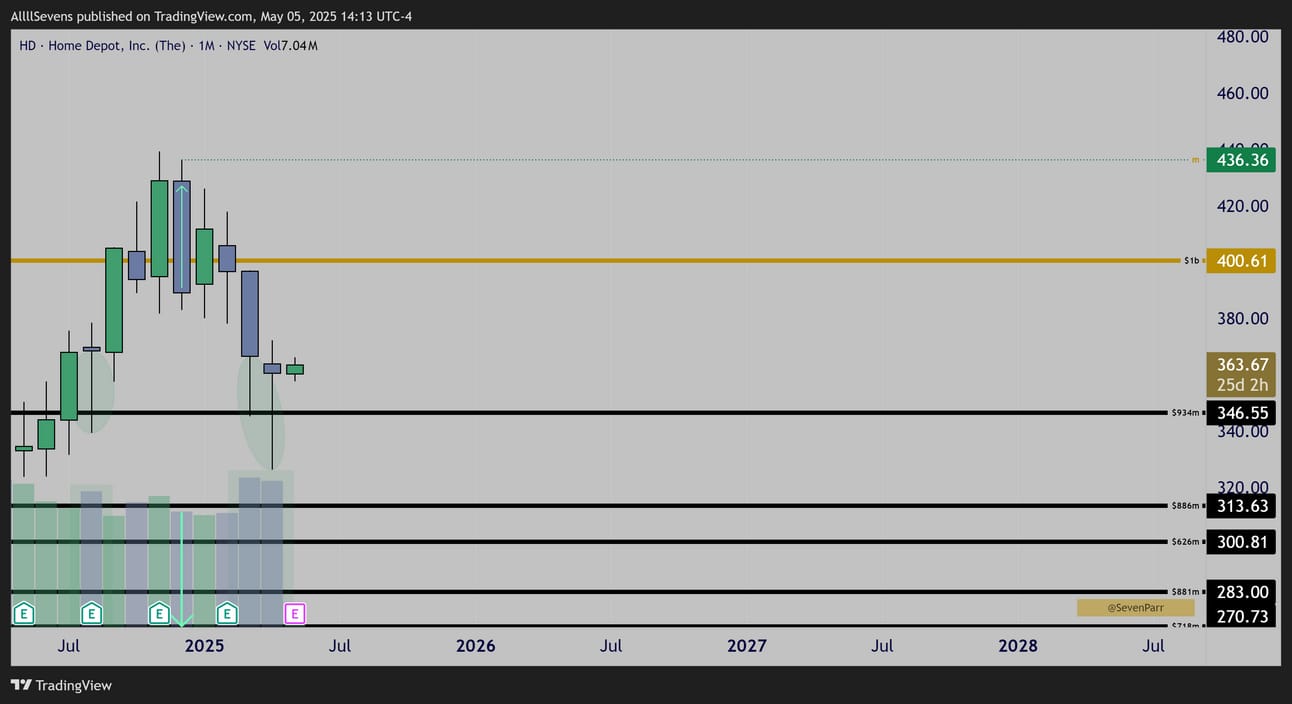
$HD Monthly Candles
Anomaly sell-off from the stock’s largest dark pool on record…
So, so extremely notable!
Price now retesting an area that saw accumulation in August, seeing even larger volume buyers step in once again.
We know institutions did not sell from highs, and they continue to buy here at lows. Buy and hold is what my grandpa tells me to do in the stock market.
Turns out, that’s what the largest participants in the world do. Institutions, that is.
And, myself!
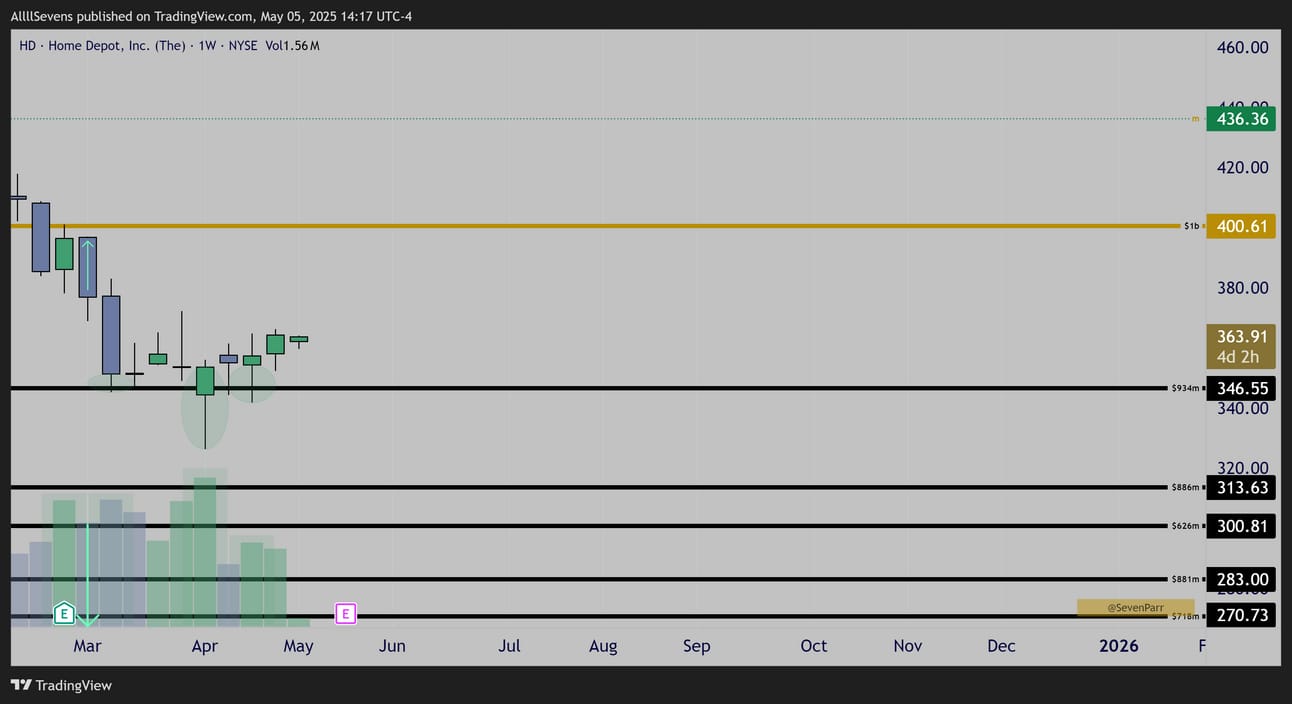
$HD Weekly Candles
Really want to highlight this second discount sell, right off that $400.61 dark pool
UNH
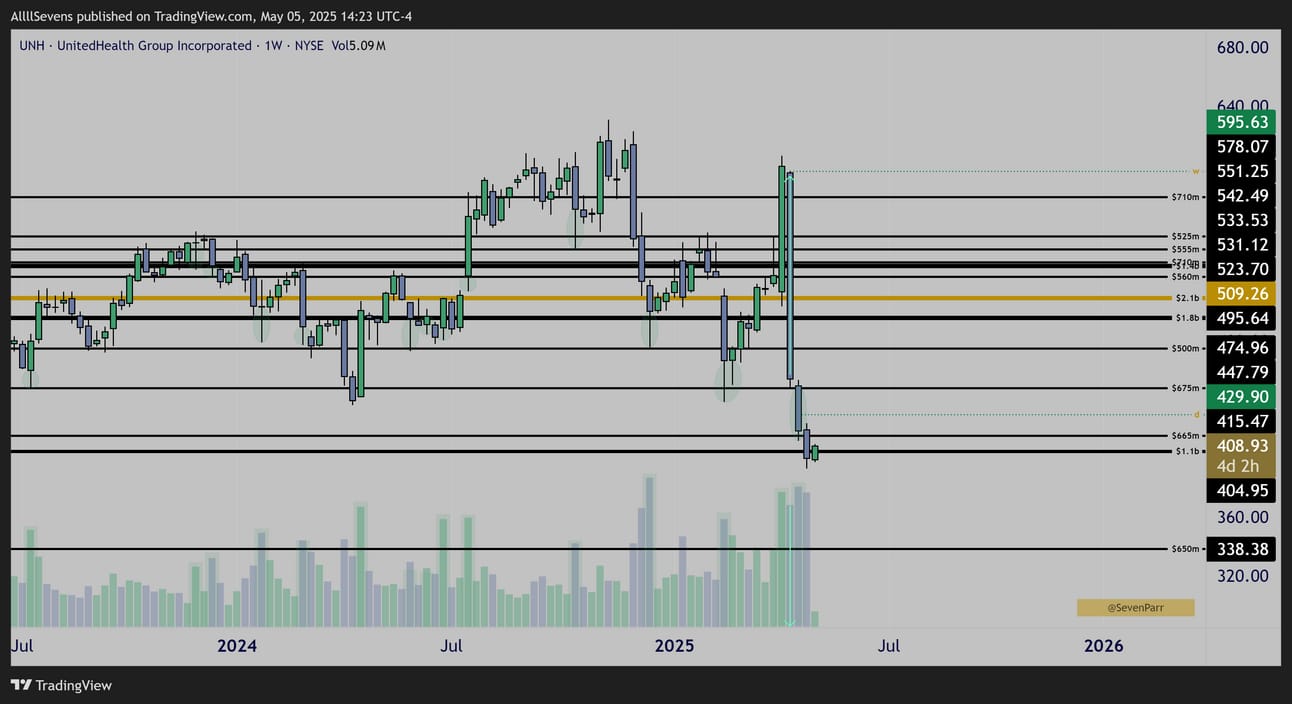
$UNH Weekly Candles
This stock has been accumulated for multiple years now.
With the recent sell-off, directly through largest dark pool on record, a massive exploitable discount has been created.
Notice the decreased spread candle AFTER the big sell-off has more volume.
Those are institutional buyers remaining active after they did not even participate in the massive sell-off that has decreased volume behind it.
This sell anomaly is truly nuts. Massive candle. Decreased volume.
Buyers right after. Exploitable.
ASML
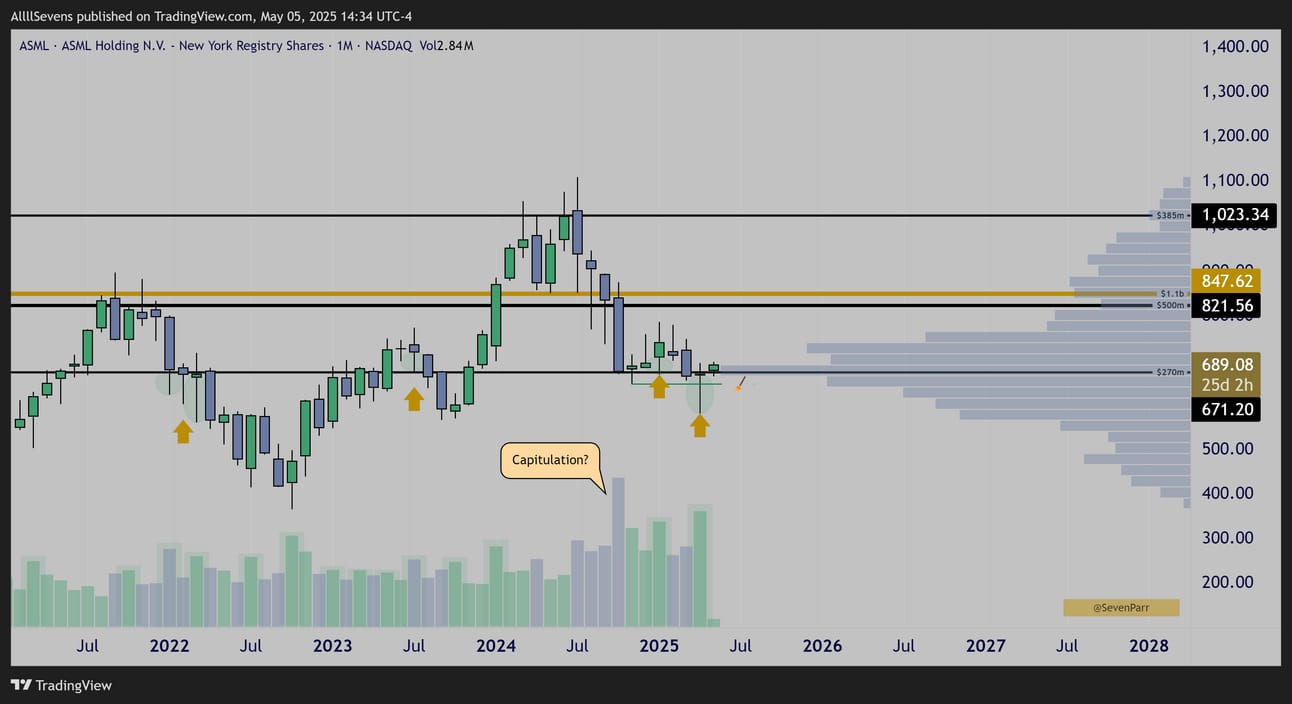
$ASML Monthly Candles
The potential capitulation displayed here is the stock’s highest volume since 2012
Price has been very indecisive since this happened, sideways for 6 months now
This level has been accumulated many times in the past, and this is enforced by the large volume shelf that has developed here
After 6 months of sideways action, last months candle is notable.
Price tried to breakdown, and instead swept lows forming a lower / hammer upside reversal candle on highest volume since the initial capitulation.
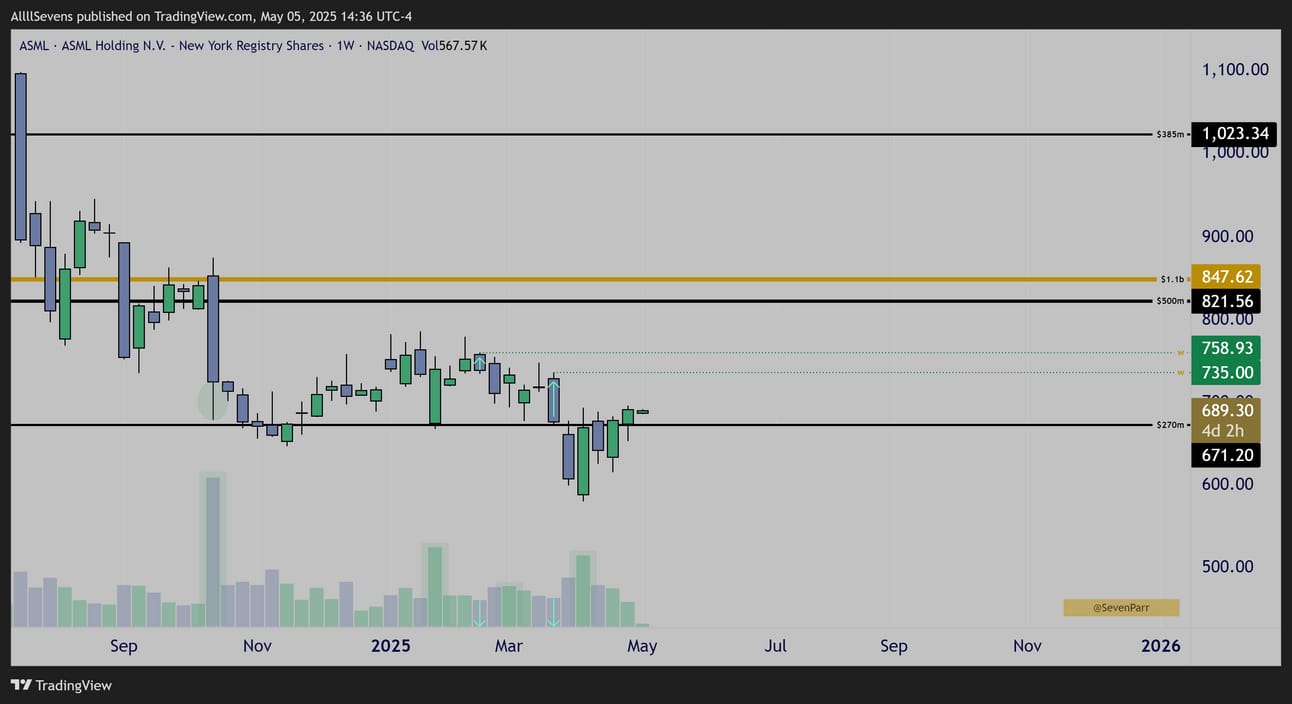
$ASML Weekly Candles
You may notice, unlike the stocks discussed so far, ASML lost it’s largest dark pool on record on MASSIVE volume. BUT, when we look at the weekly, we see there’s a lower wick formed on that volume… hm. Wait until we see the daily.
Also notable, two discounts formed in the weeks prior to last months sweep of lows and hold of support. This further confirms retail attempted to break price lower, and institutions absorbed all their shares. Considering how exhausted speculators must be after 6 months of sideways price action and then a false breakdown, this could be ready for a rally.
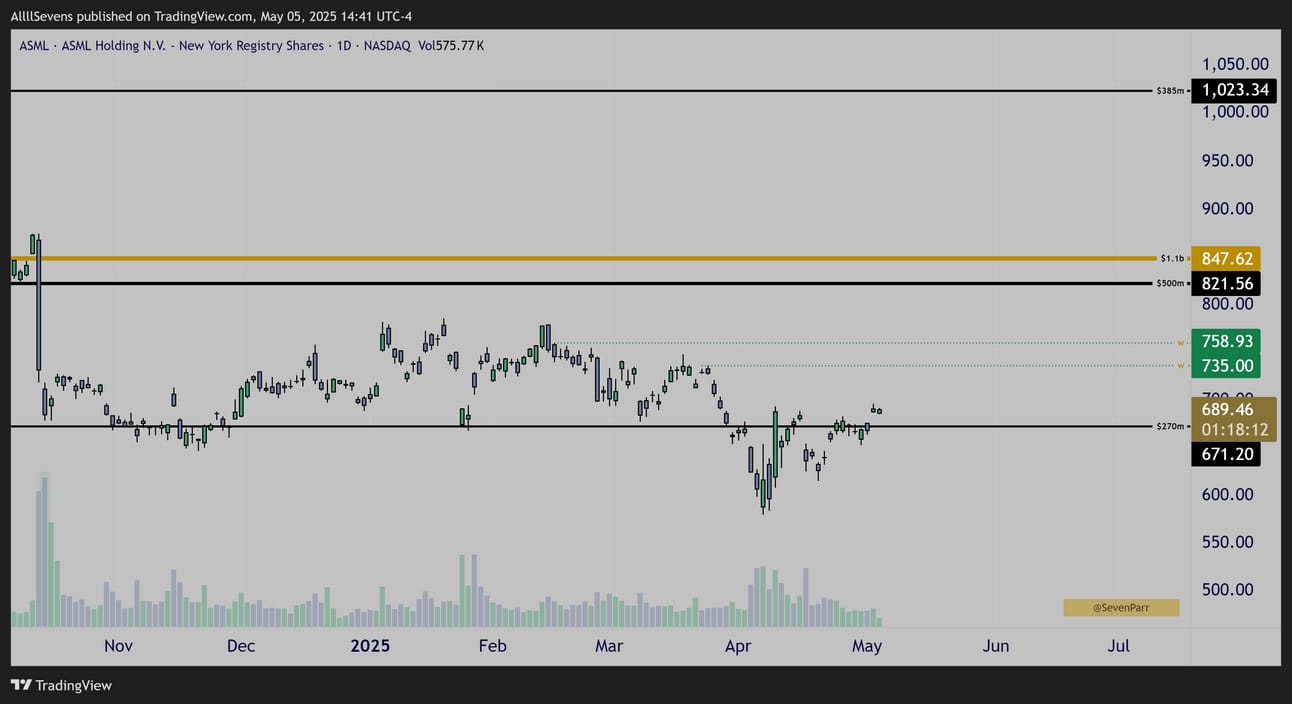
$ASML Daily Candles
The daily chart confirms that a majority of that monthly & weekly volume did indeed come in at the bottom to form that tiny lower wick.
It seems like institutions did not sell off their dark pool, but they bought the extreme panic as price dumped over 10% from that level.
AMD
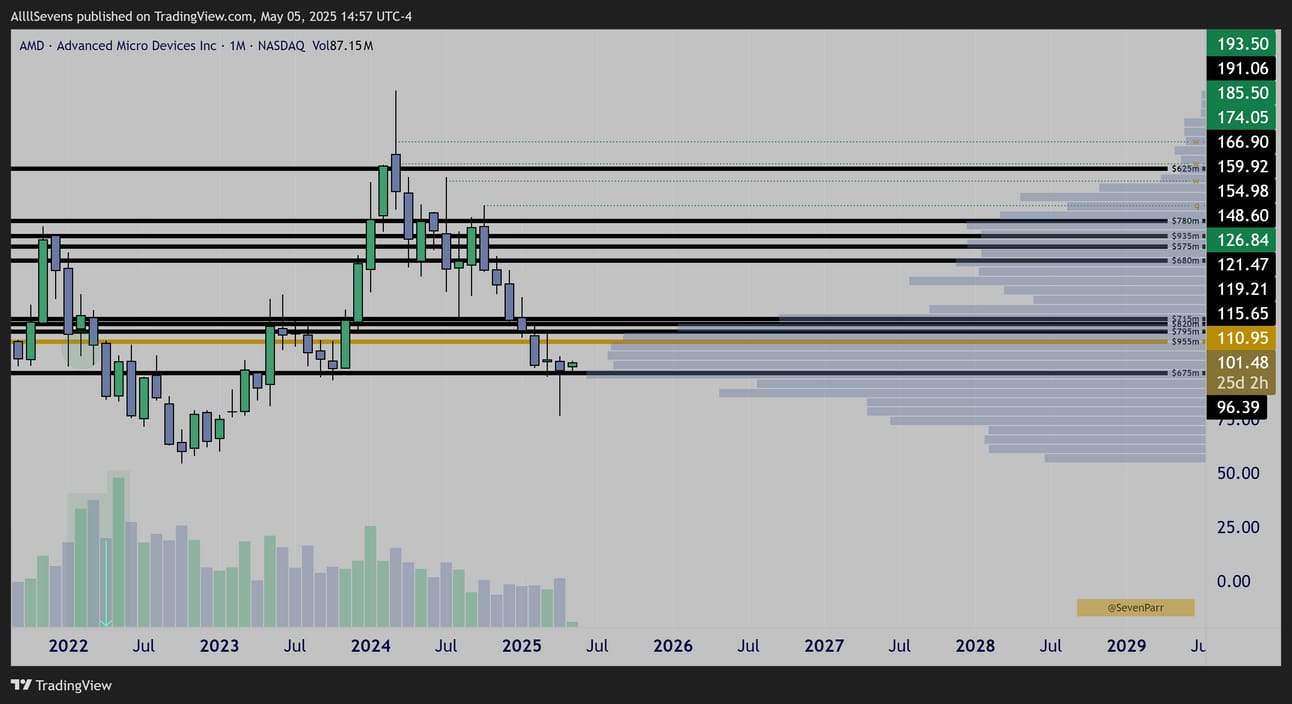
$AMD Monthly Candles
Retesting THE price level for accumulation in 2022 (volume shelf)
Last month’s volume is not particularly notable- however-

$674.9M dark pool executed at $96.39 last month
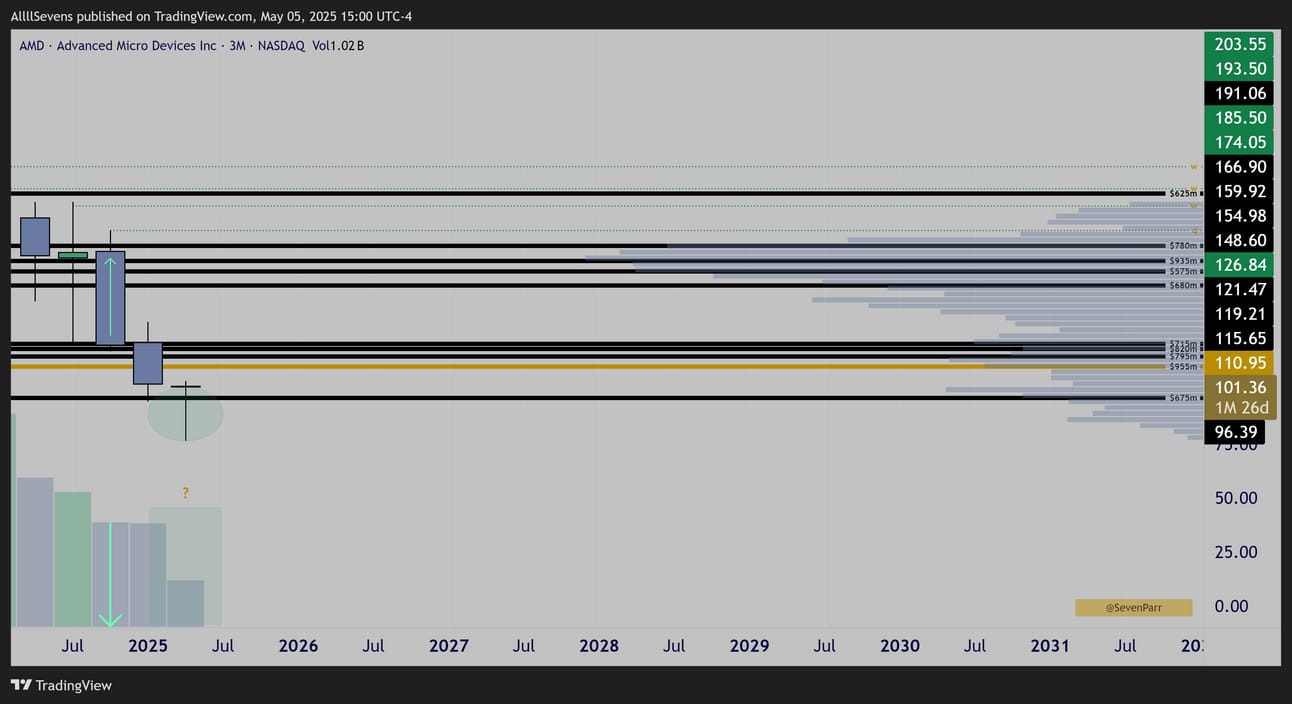
$AMD Quarterly Candles
Price is currently within a MASSIVE discount formed in Q3 of last year…
Institutions have NOT been selling.
So, considering price is now retesting the 2022 area of accumulation and seeing a near $700m dark pool- what if this quarter’s candle shows out buyers finally stepping in again? It would make a lot of sense to me. I’m a buyer.
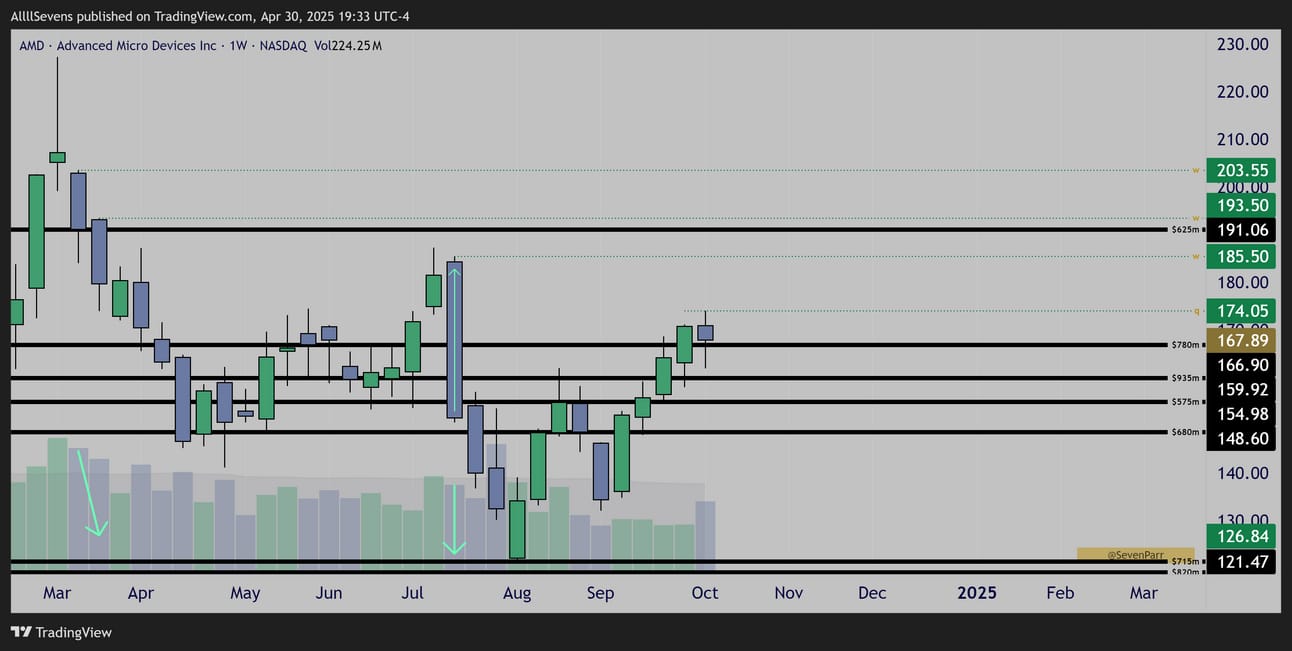
$AMD Weekly Candles
I believe this stock is severely mispriced. I don’t think institutions have participated in ANY of the selling over the last year. I really do think this quarters candle has the potential to show major buyers and over the coming years, AMD stock price to hit new all-time-highs. We’ll see.
DDOG
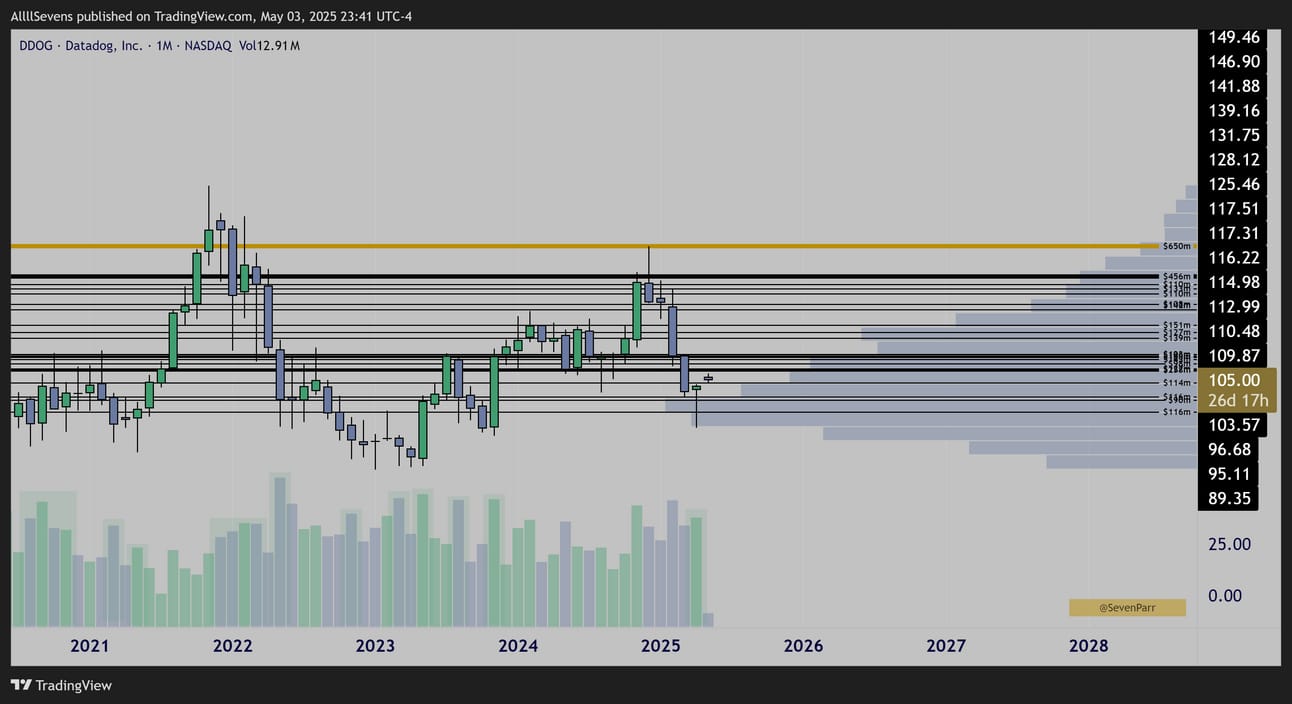
$DDOG Monthly
Testing multi-year volume shelf support and area of historic accumulation.
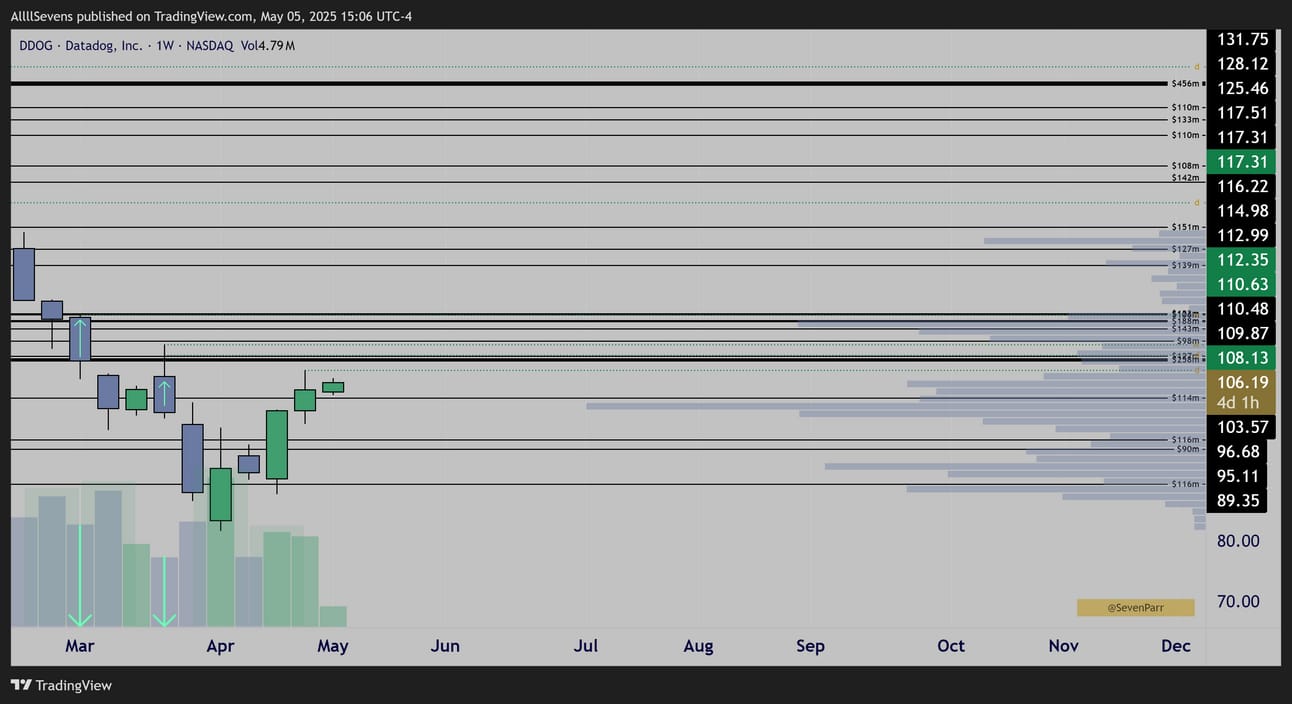
$DDOG Weekly
Clean dark pool accumulation and retail sell sequence headed into the hammer candle that formed last month off multi-year support.
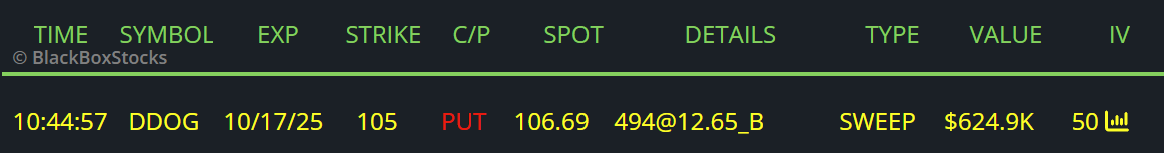
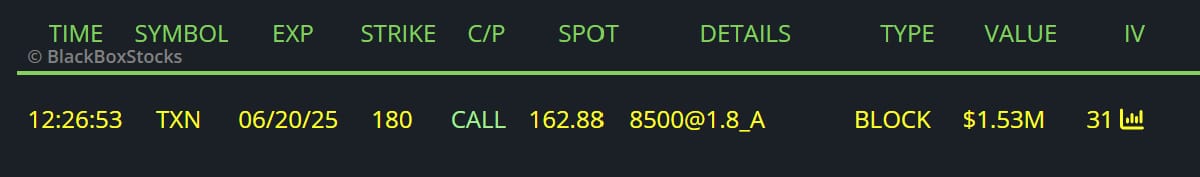
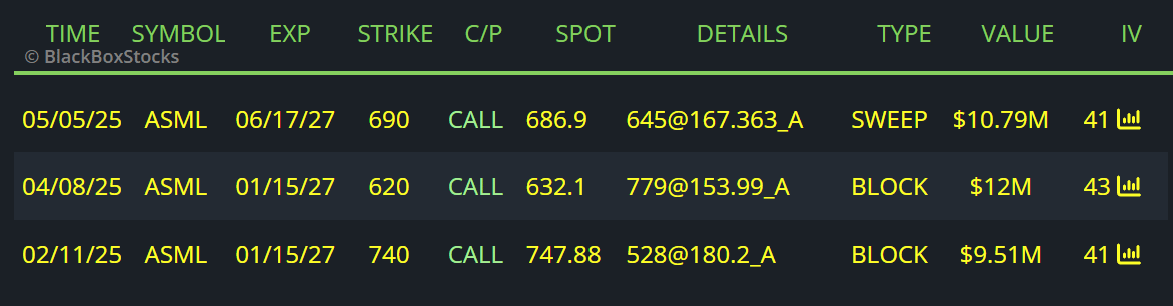
Executed on Friday last week
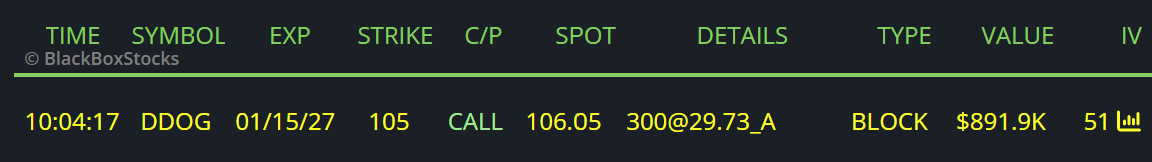
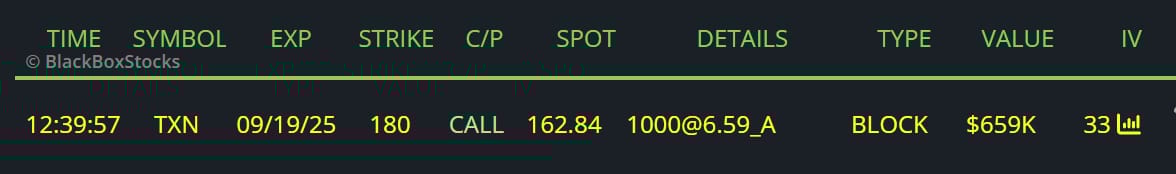
Executed today
UVXY
Institutions are extremely bullish the stock market.
For almost 9 months now I have been preaching the dawn of the next bull market. The volume patterns I’ve outlined above, and specifically the ones on $SPY, $IVV, and $VOO over the last month further confirm this thesis.
At the same time, the short-term is always uncertain.
The last time we saw institutions buy like this was 2022. We went into a bear market DURING the accumulation. I’ve explained this many times.
Does this mean we are destined to do the same thing again? No.
But, it’s possible.
Make sure you read the POTENTIAL for a bear market here- Click Here
I also highlight why I am simply buying stocks regardless of this potential.
I also would have been buying stocks in January of 2022.
I don’t know forsure what happens short-term, all I know is institutions are buying. They will hold through a bear market. So would I.
As of now, we have no price action suggesting a rejection of the potential resistances outlined in the newsletter linked above, so I remain very bullish which is obviously why I am writing about so many bullish stocks today -
But, in the case that we do begin to reject… UVXY is my hedge.
Let’s take a look.
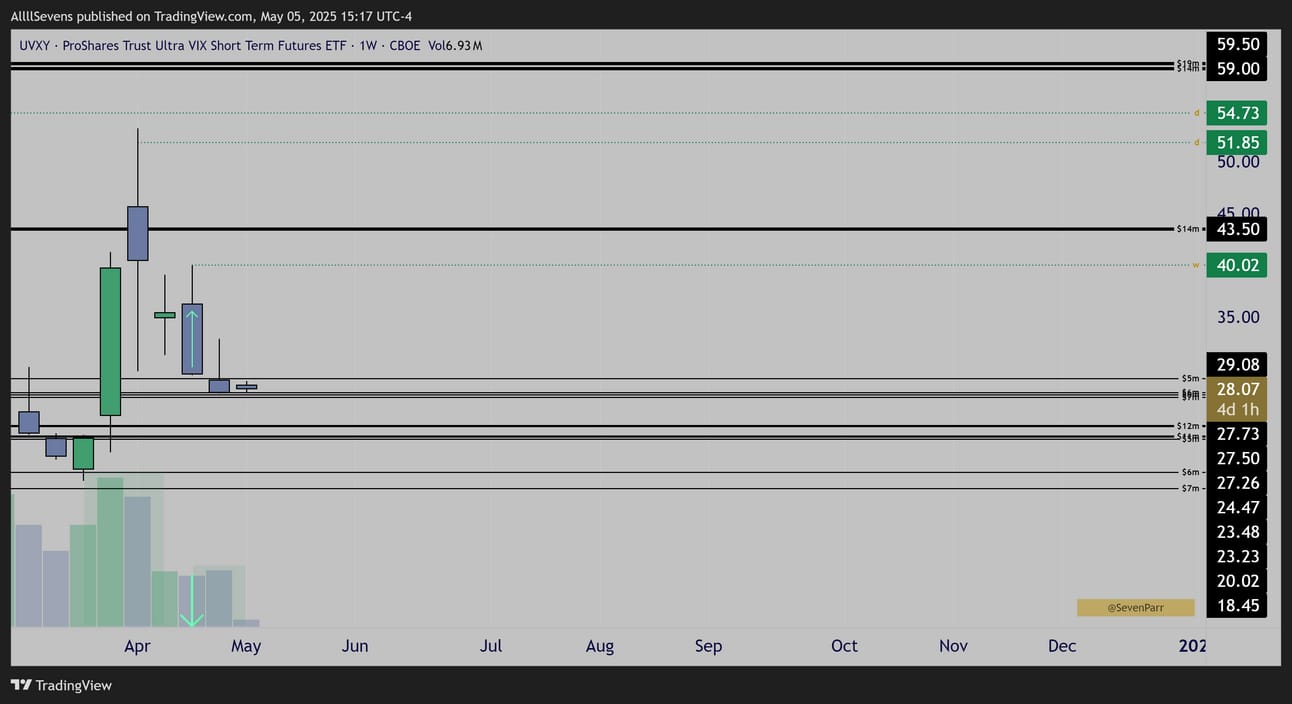
$UVXY Weekly Candles
Clean discount created on the recent sell-off.
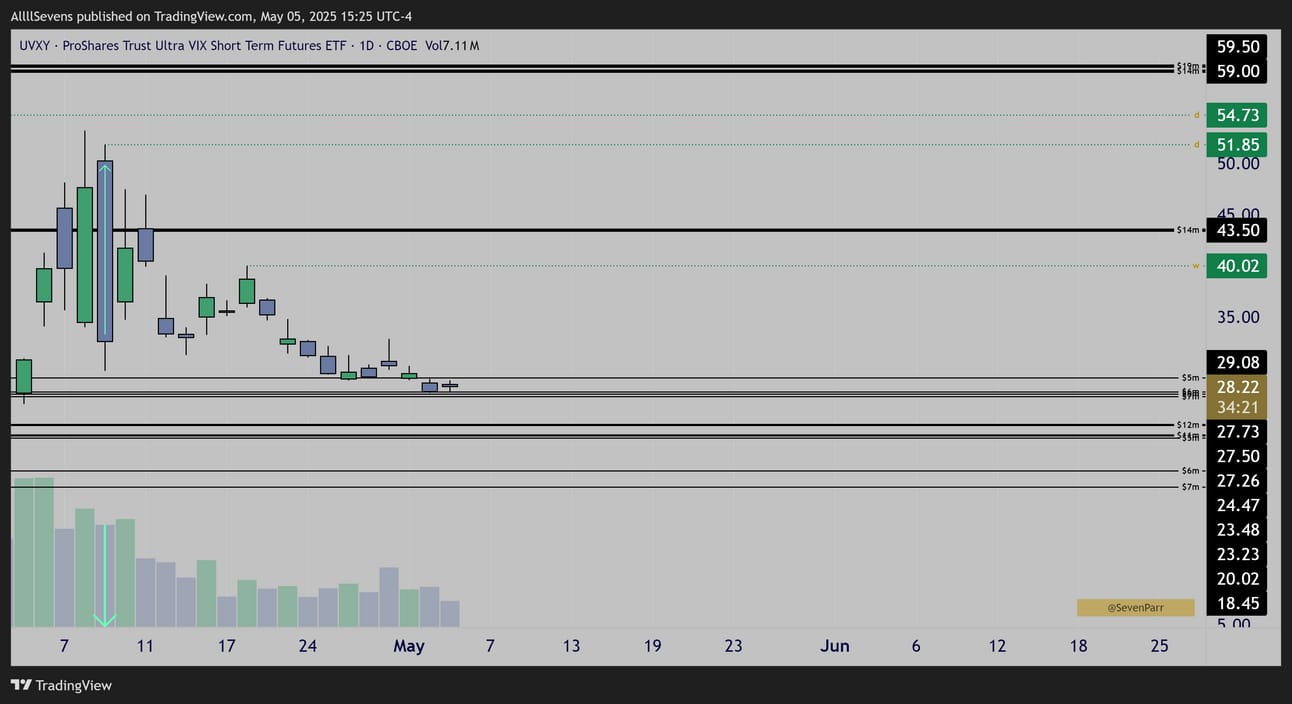
$UVXY Daily Candles
Another very blatant discount.
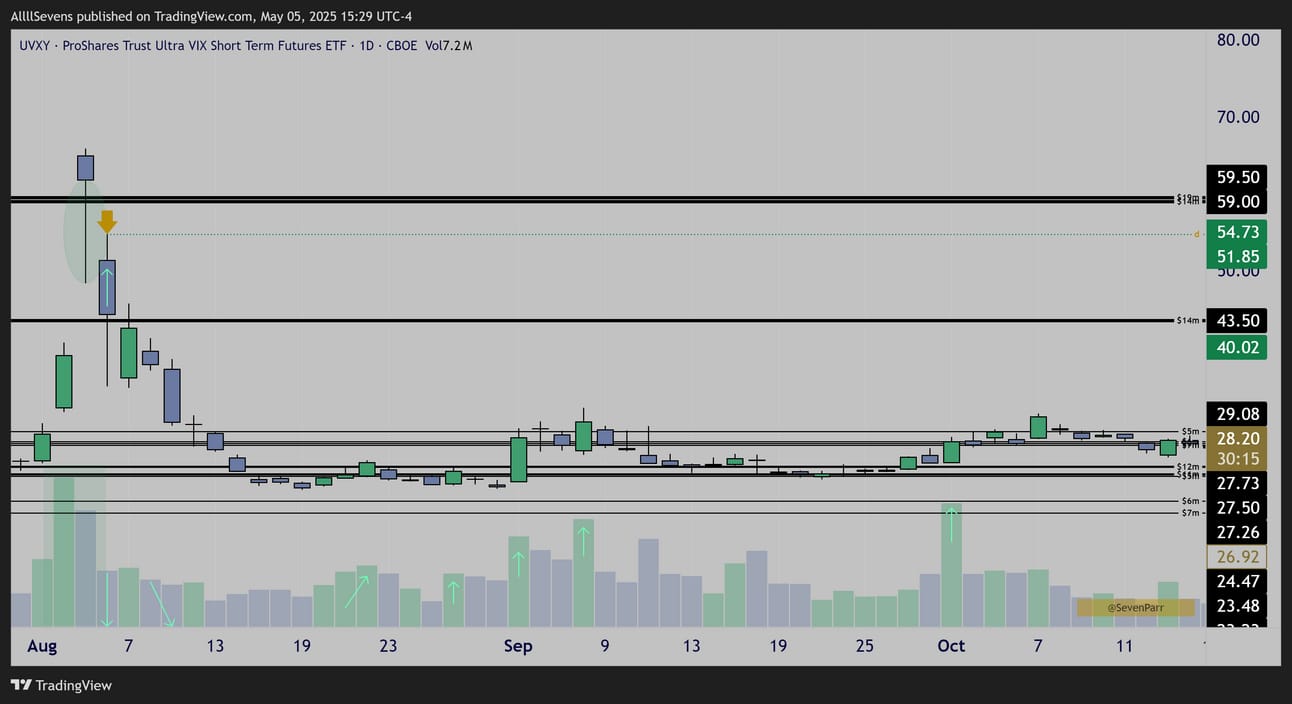
$UVXY Daily Candles
Back in August when the recent market volatility truly started creeping in, $UVXY was accumulated as high as the $60’s and left a discount in the low $50’s
This is a chart I always keep my eyes on whenever I feel hedging is necessary.
As $IVV and $VOO approach the $50B dark pool cluster which we know has been accumulated and sold by retail- there IS potential for retail to sell it again, and this UVXY chart is what I’ll be watching to hedge all the stocks I am currently buying.
Side note- notice the size of these dark pools on UVXY. They’re so small compared to any stock covered today, or any stock I usually cover.
This is a SHORT TERM HEDGE vehicle. Not an investment.
For all I know, retail reclaims the IVV and VOO levels and boom, dawn of the bull market. I have no set in stone short-term bias.
As of now I am a convicted buyer of stocks, as outlined on many stocks in this newsletter. I’m also taking a very small nibble at UVXY, but ready to take a larger position if VOO and IVV really start to roll. We’ll see.

SBUX
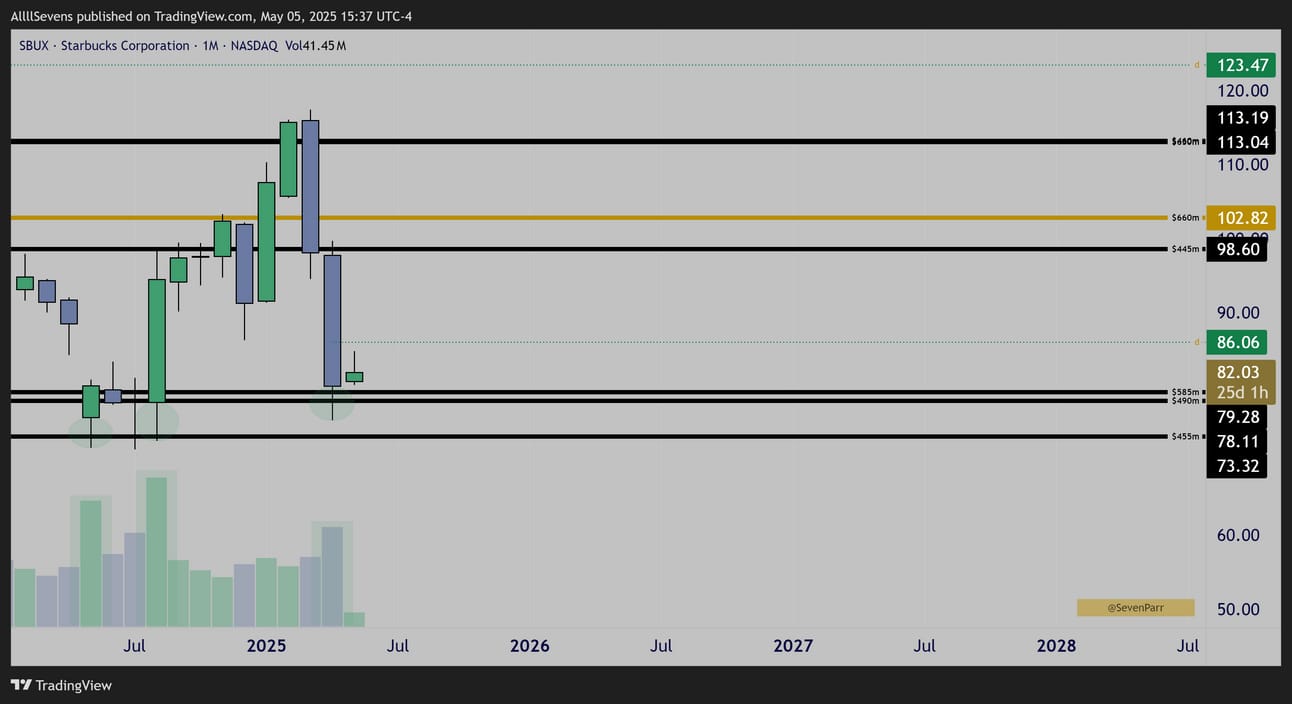
$SBUX Monthly Candles
MAJOR buyers in this area May-August of last year.
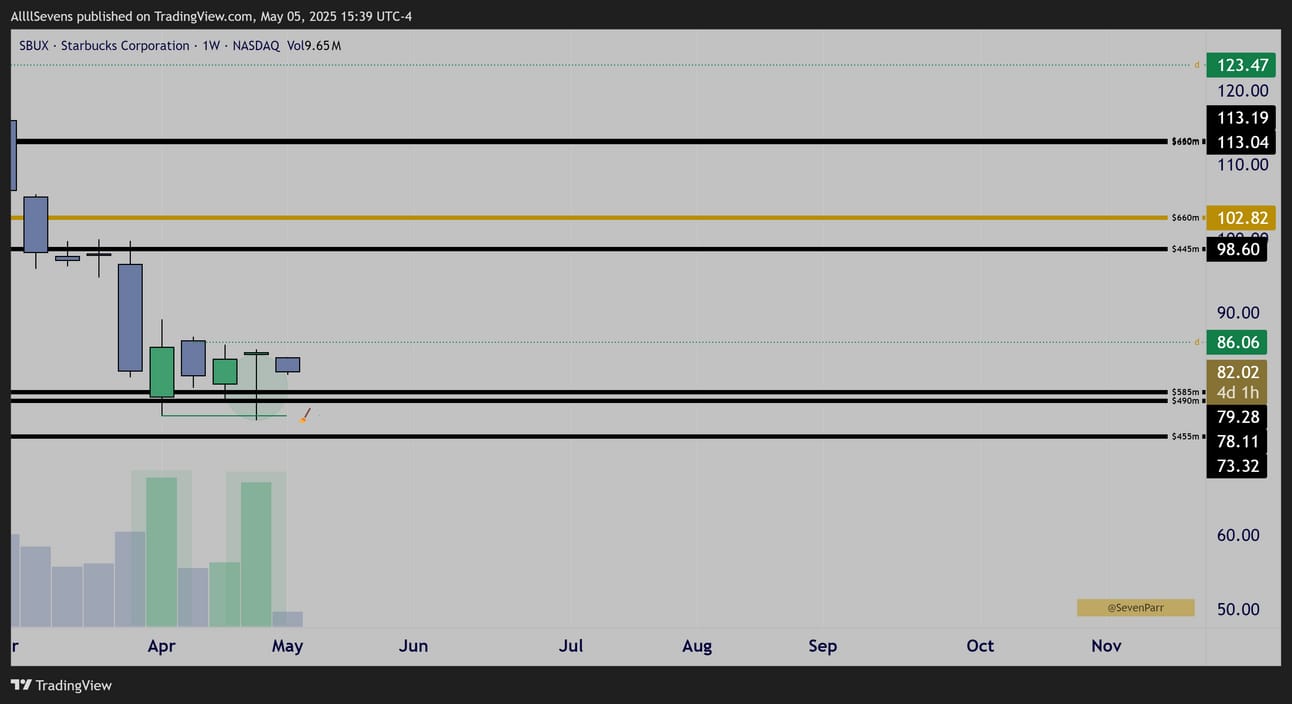
$SBUX Weekly Candles
Retesting this area, we see large volume buyers defending it once again.
Last week, price swept lows of this 3-week inside candle compression and defended it on again, very high volume.
XYZ
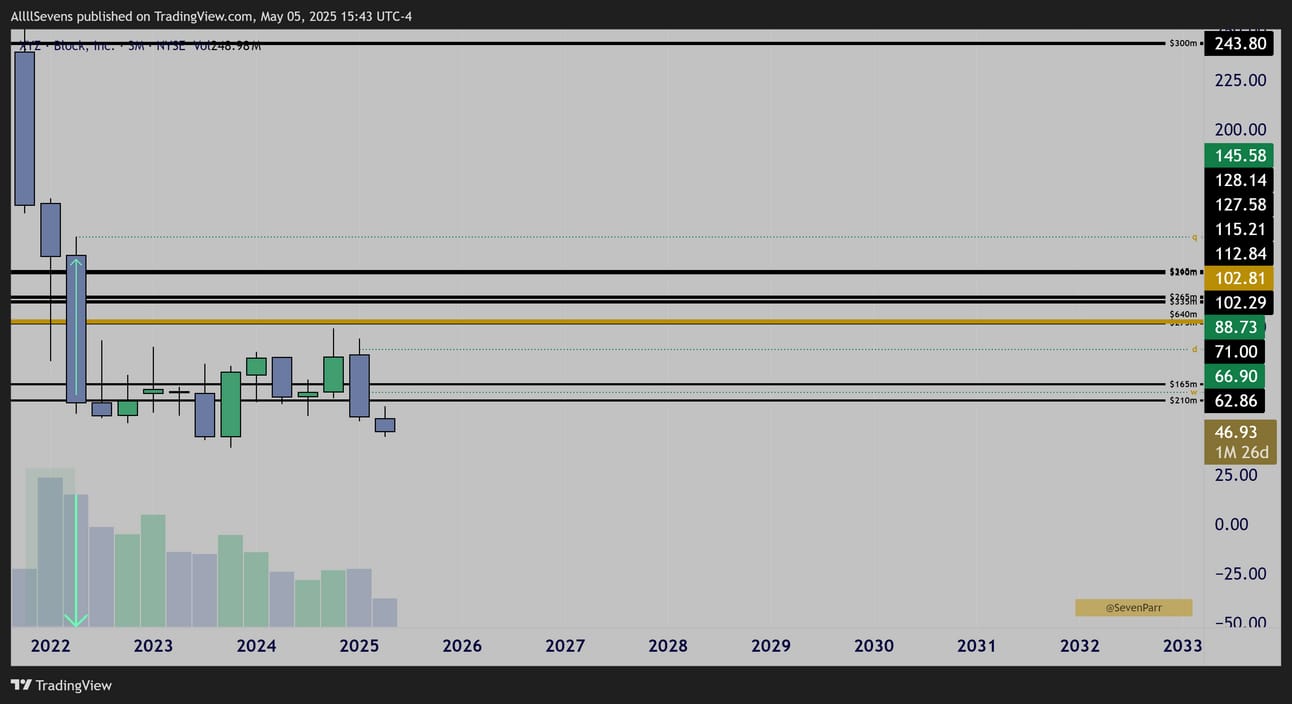
$XYZ Quarterly Candles
There is an absolutely insane discount active on this stock.
In 2022, institutions accumulated the stocks largest DP’s on record and retail sold it straight through the next quarter.
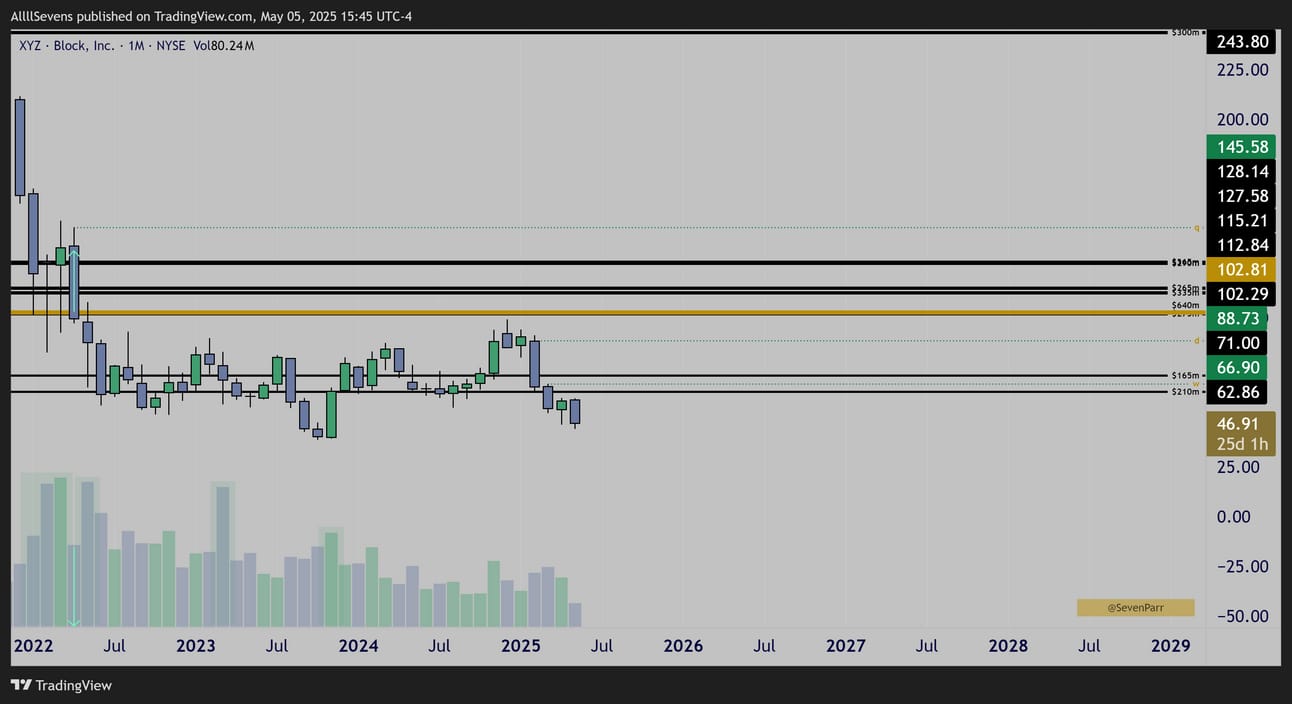
$XYZ Monthly Candles
A genuine textbook example of the patterns I look for.
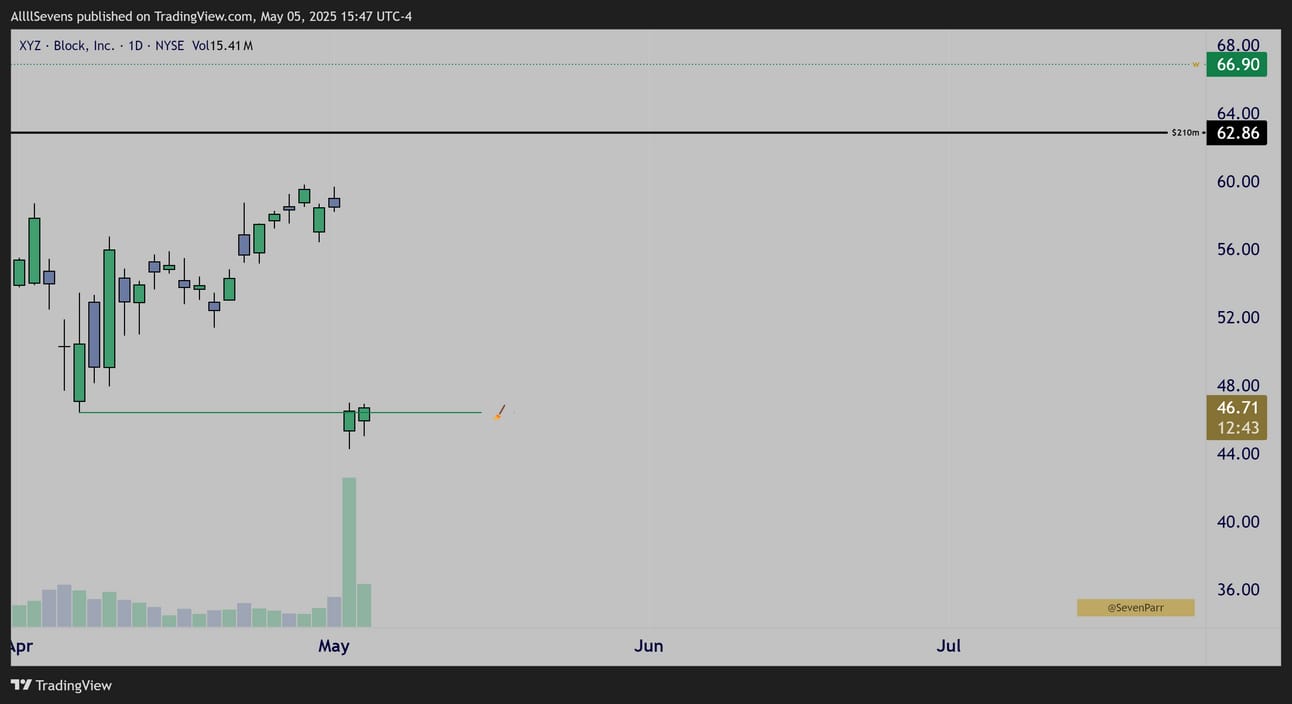
$XYZ Daily Candles
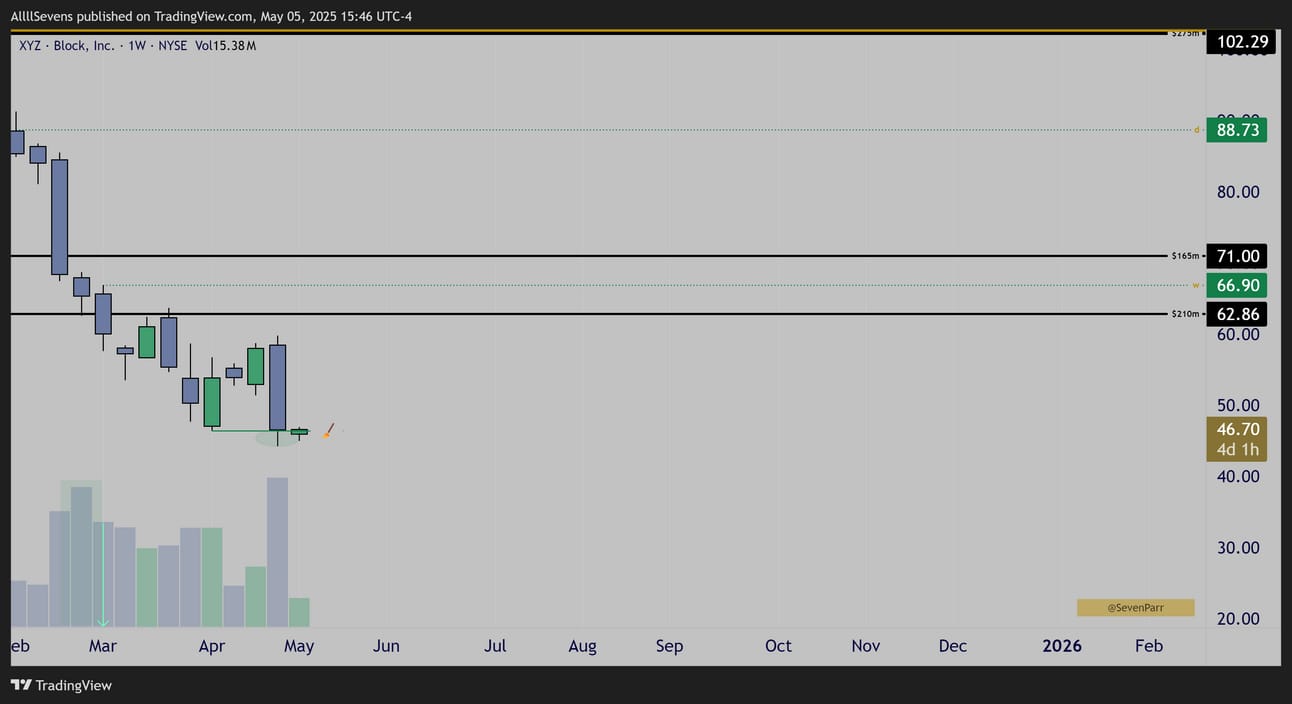
$XYZ Weekly Candles
Highest volume in a few years was just traded on the recent Earnings drop.
Sweeping the last swing low, this could be a bottom in development.
Institutions clearly remain buyers, that’s all I know.

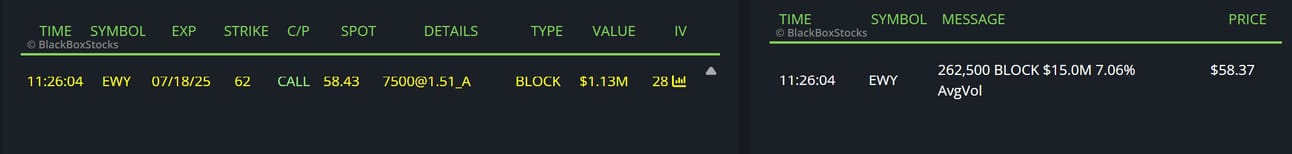
EWY
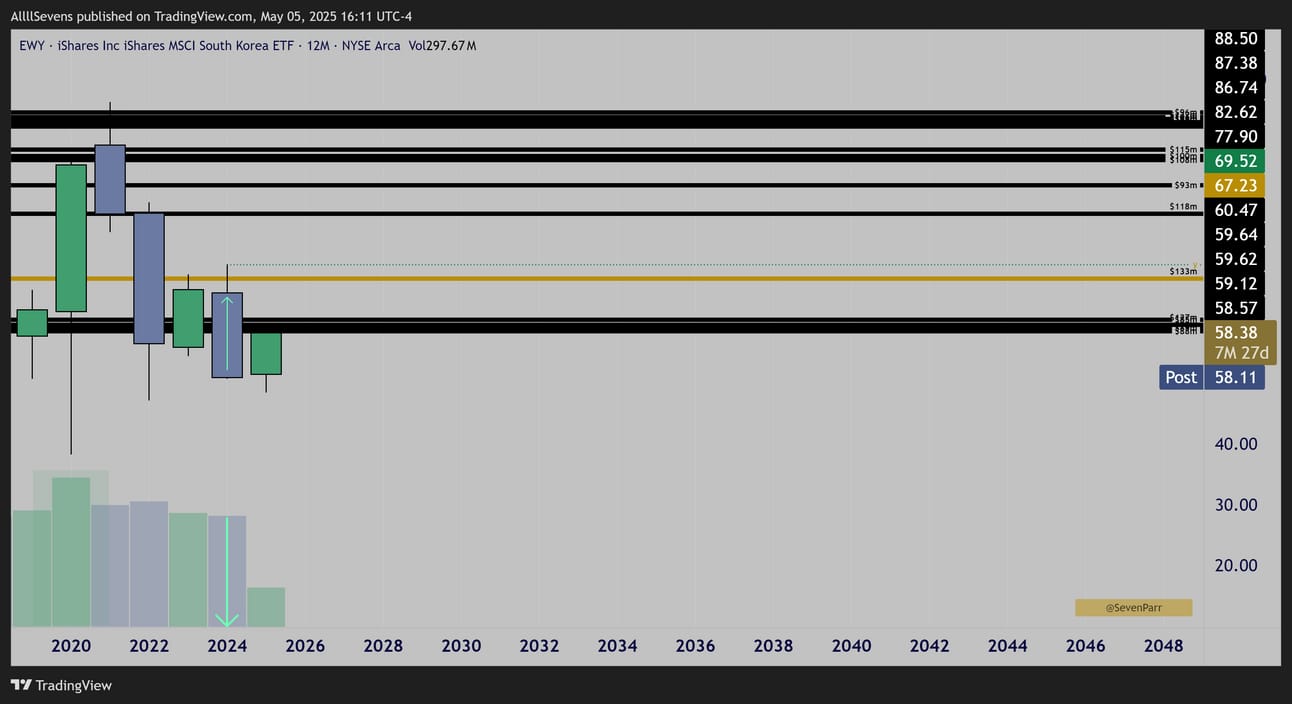
$EWY Yearly Candles
After an anomaly sell-off last year, price is attempting to reclaim 2020’s dark pool accumulation zone.
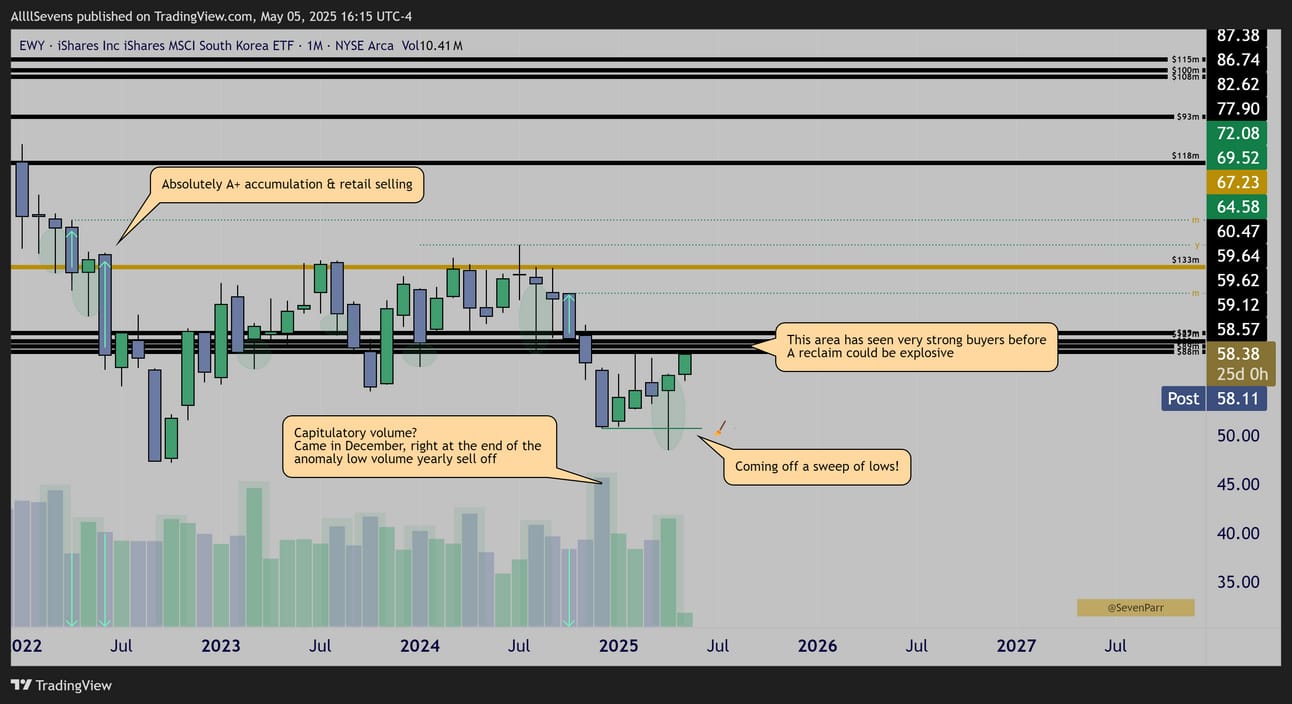
$EWY Monthly Candles
Another genuinely textbook example of the patterns I look for.
Coming off a sweep of capitulatory lows, now looking to reclaim an area of heavy institutional accumulation over the last three years, this could get very bullish very fast.
TSLA
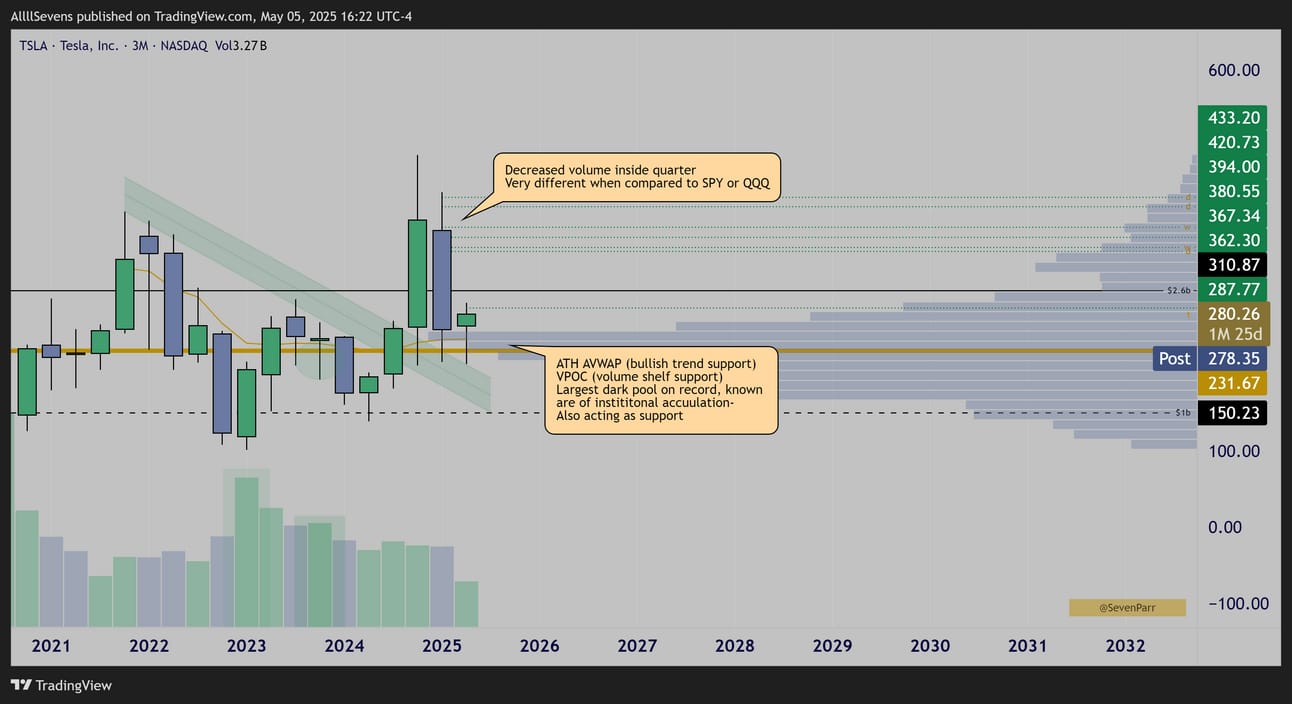
$TSLA Quarterly Candles
Unlike the S&P500 which bearish engulfed last quarter on increased volume off massive IVV & VOO dark pools creating the potential for further short-term resistance, TSLA formed an inside candle, over massive dark pool support…
A strikingly different dynamic. Incredible relative strength on display, and potential for it to become even more obvious over the coming months.
This $231.68 dark pool on TSLA is valued at over $30
This is the single largest dark pool transaction in the entire market over the last 5 years. That’s insane. It’s even larger than any print on the SPY or QQQ.
This dark pool is acting as support, alongside the largest volume shelf of the last 5 years. And perhaps most important for the short-term, price is using the ATH AVWAP as bullish trend support here. The risk to reward for longs compared to the rest of the market is absolutely unreal.
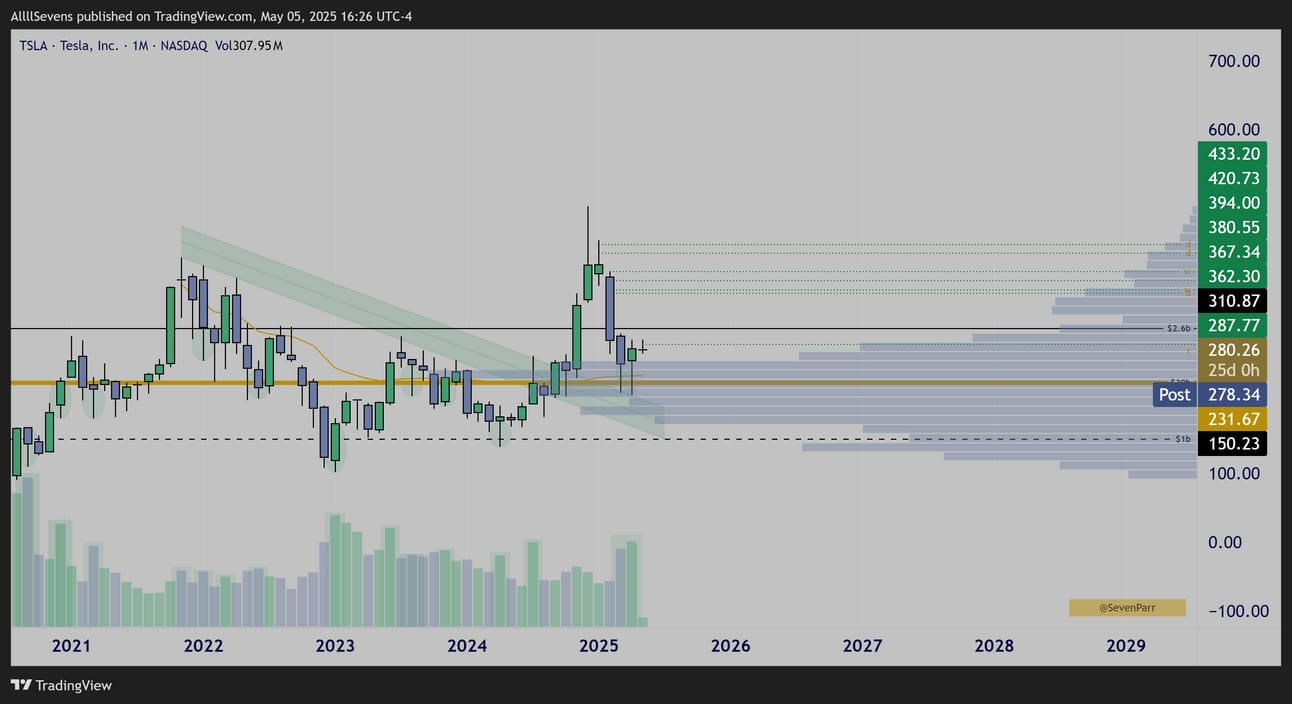
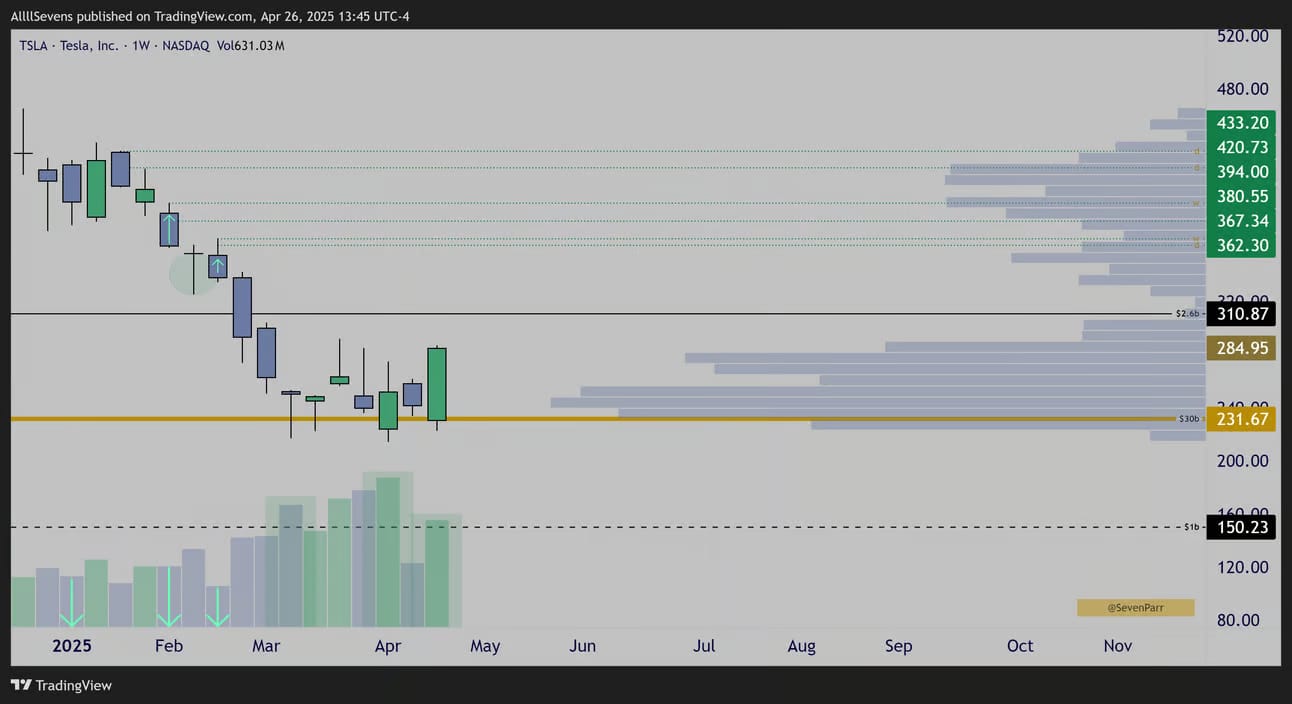
$TSLA Monthly Candles
We can see clearly the accumulation patterns on this stock the last 5 years.
An increased volume tweezer bottom (upside reversal pattern) has developed off all the supports outlined above.
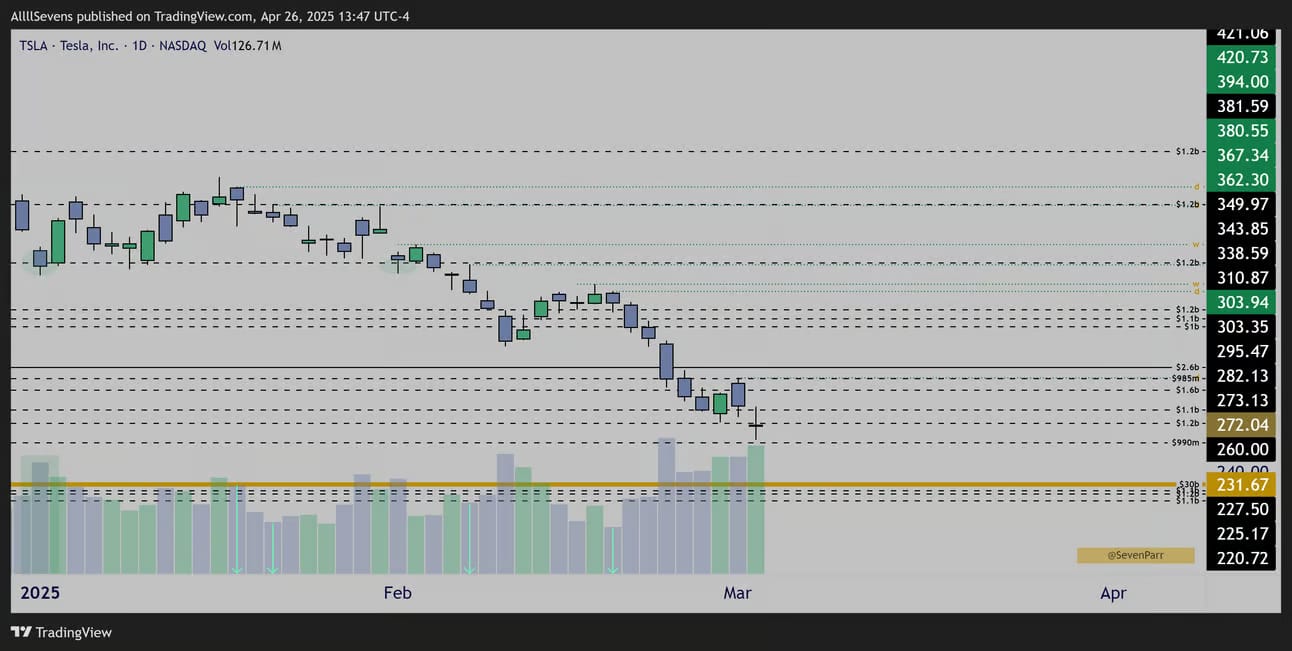
$TSLA Daily Candles
$TSLA Weekly Candles
Clear exploitable discounts off the recent swing high.
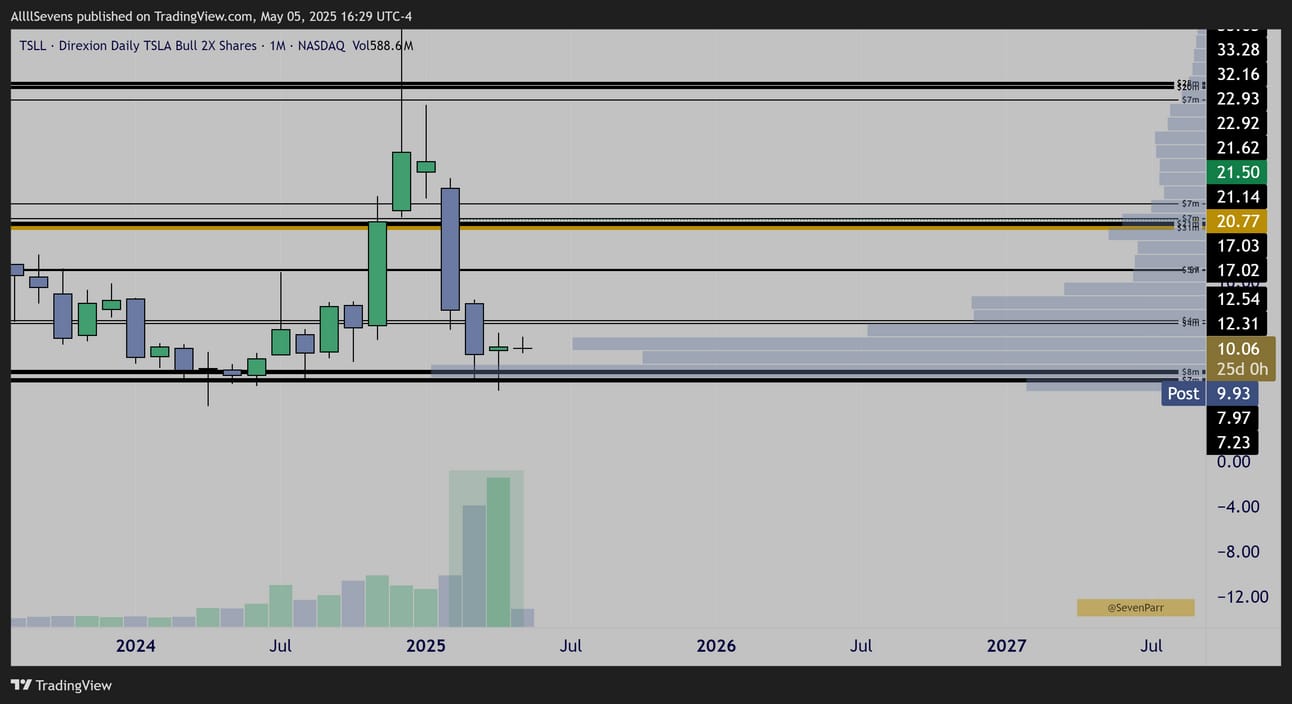
$TSLL Monthly
The 2x leveraged TSLA ETF has also formed a tweezer bottom-
On its highest volume ever.
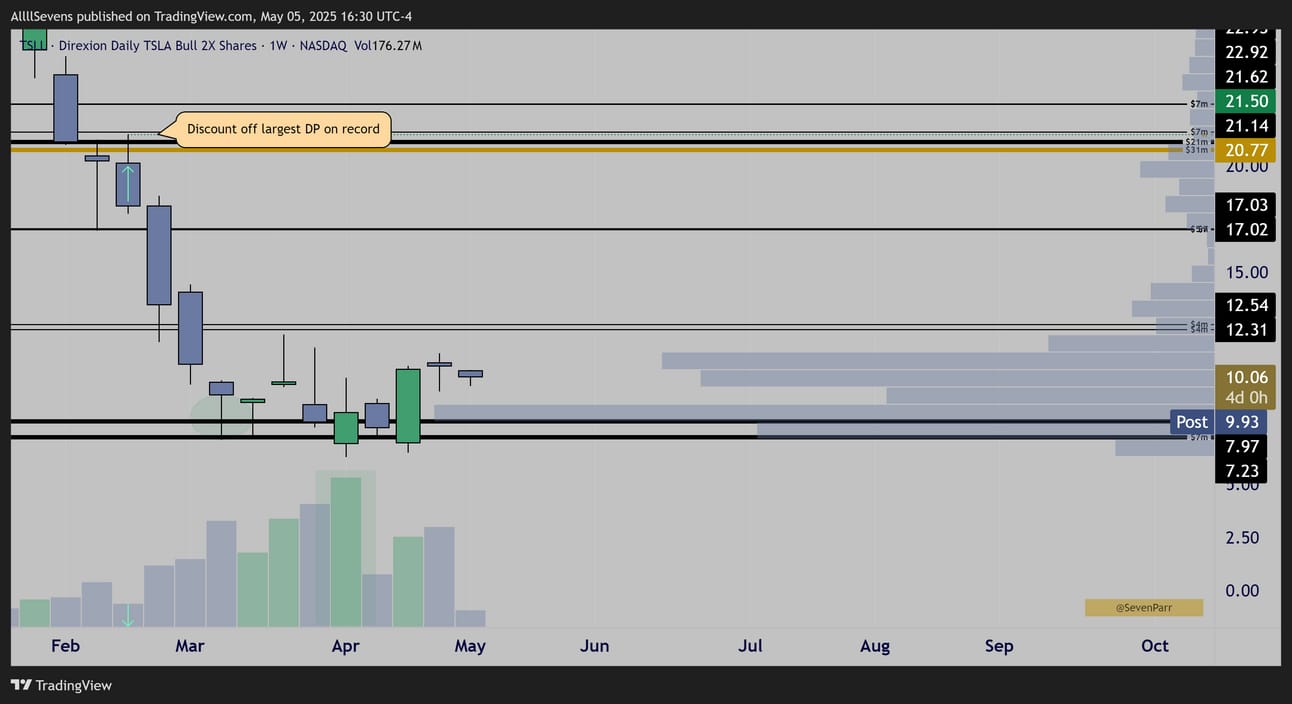
$TSLL Weekly
A discount sell from the ETF’s largest dark pool on record…
Clear as day, institutions are buying this with the most size EVER.
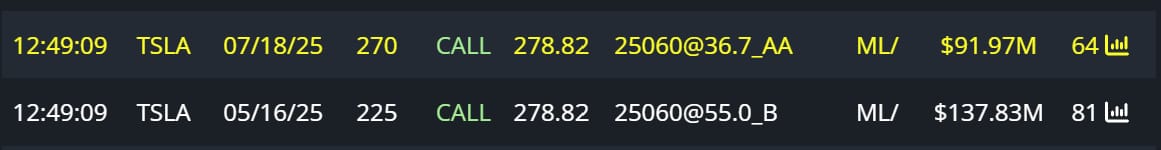
Today, someone rolled a $90M call position.
Sold to close their 5/16 225c’s and bought to open 7/18 270c’s
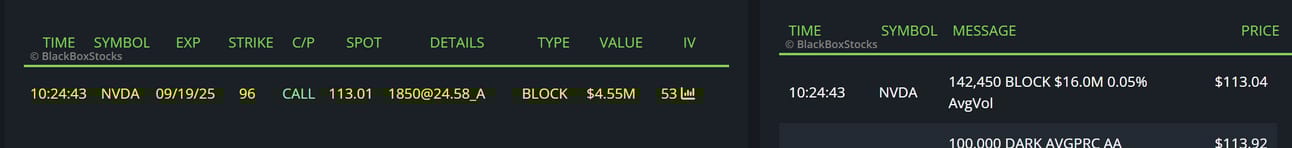
NVDA
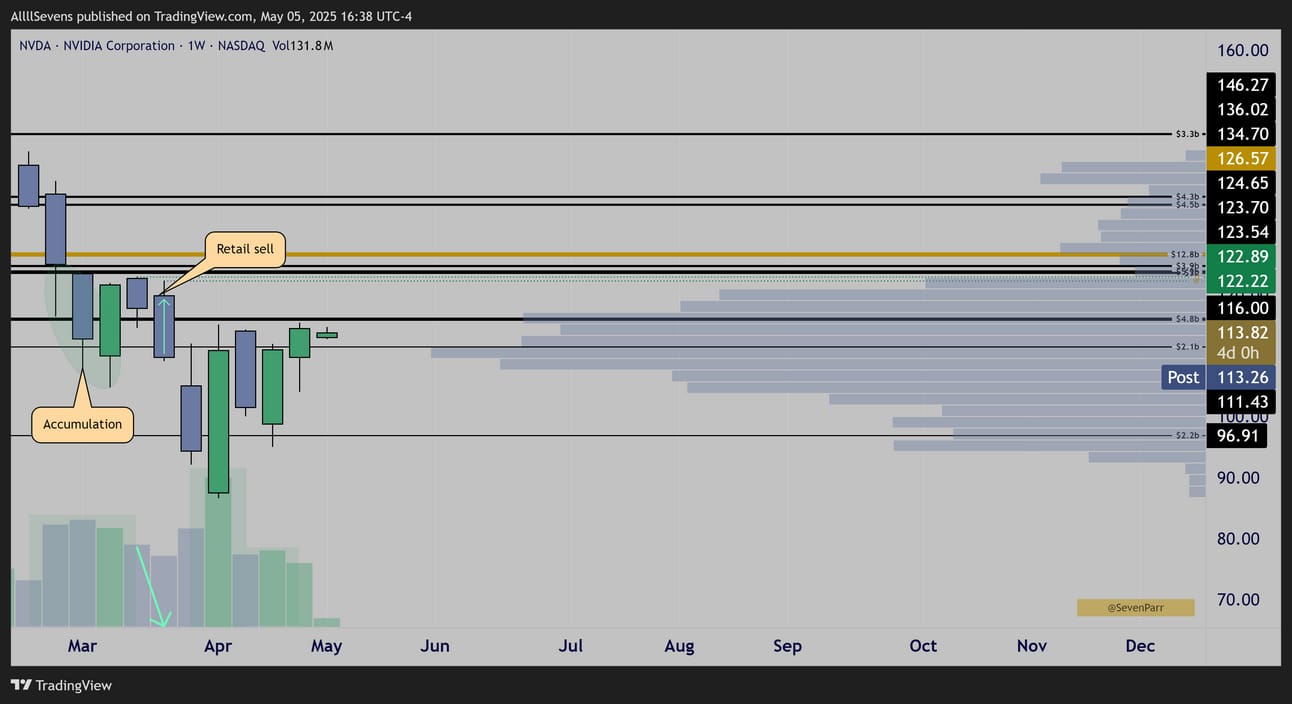
$NVDA Weekly Candles
Price currently trying to reclaim an area that saw very clear institutional accumulation in early March, followed by retail selling into an even larger accumulation forming a monthly hammer.
Reclaiming this area of prior accumulation could boost short-term bullish momentum.
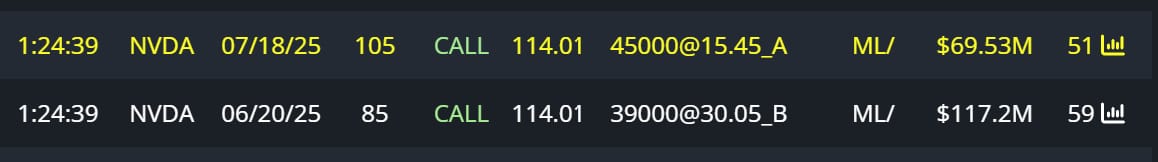
Someone executed a ridiculously large $70M bullish roll today.
Selling to close the June 85c and buying to open the July 105c’s
Another piece of flow, executed on Thursday last week
Very large and tied to dark pool making it clearly an institutional trader expecting short-term upside.
CARR
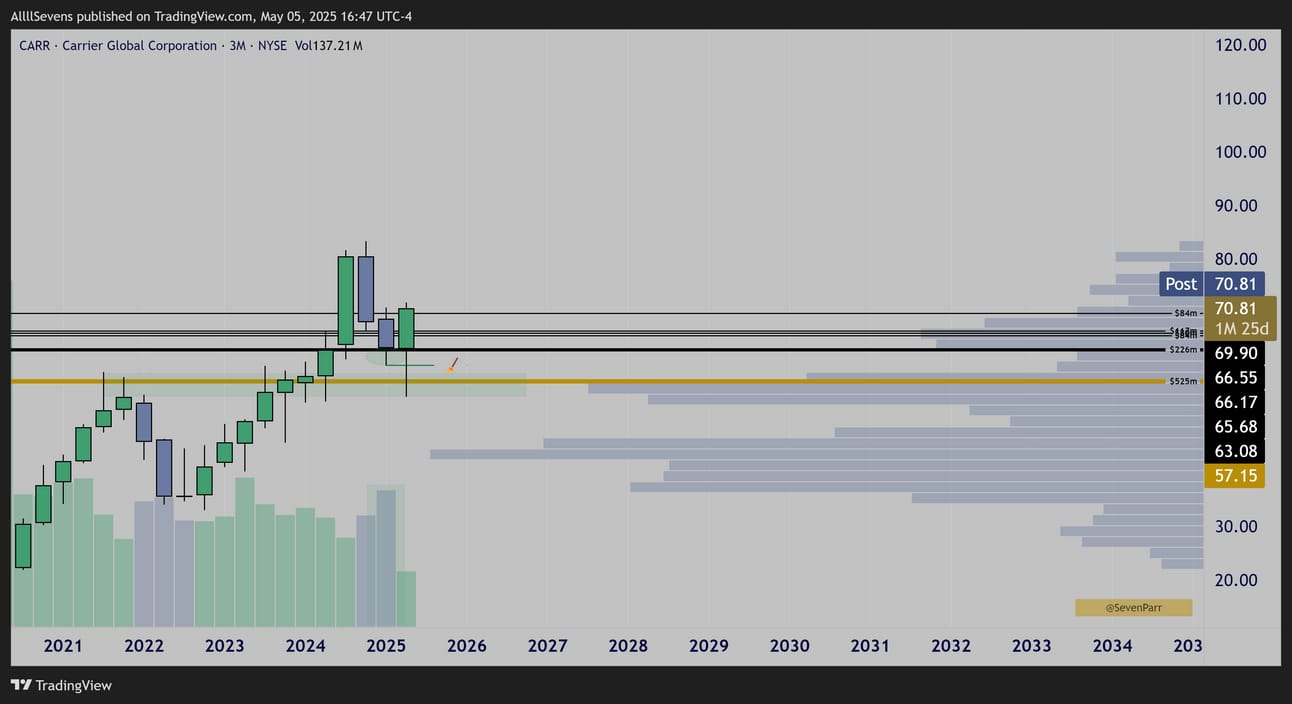
$CARR Quarterly Candles
Last quarter, price formed a dark pool accumulation candle.
This quarter, price swept that low, retested prior ATH resistance + largest dark pool on record and bounced… A very bullish statement to begin the quarter.
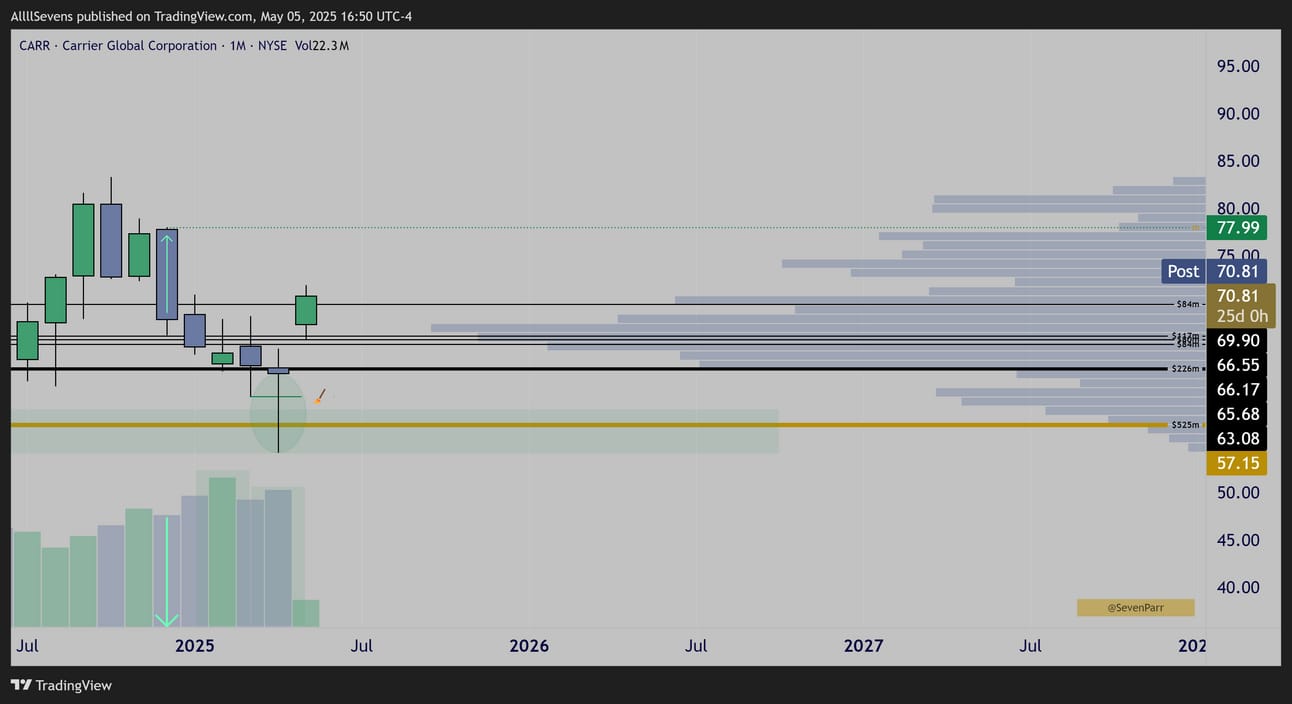
$CARR Monthly Candles
A discount left behind in the high $70’s!
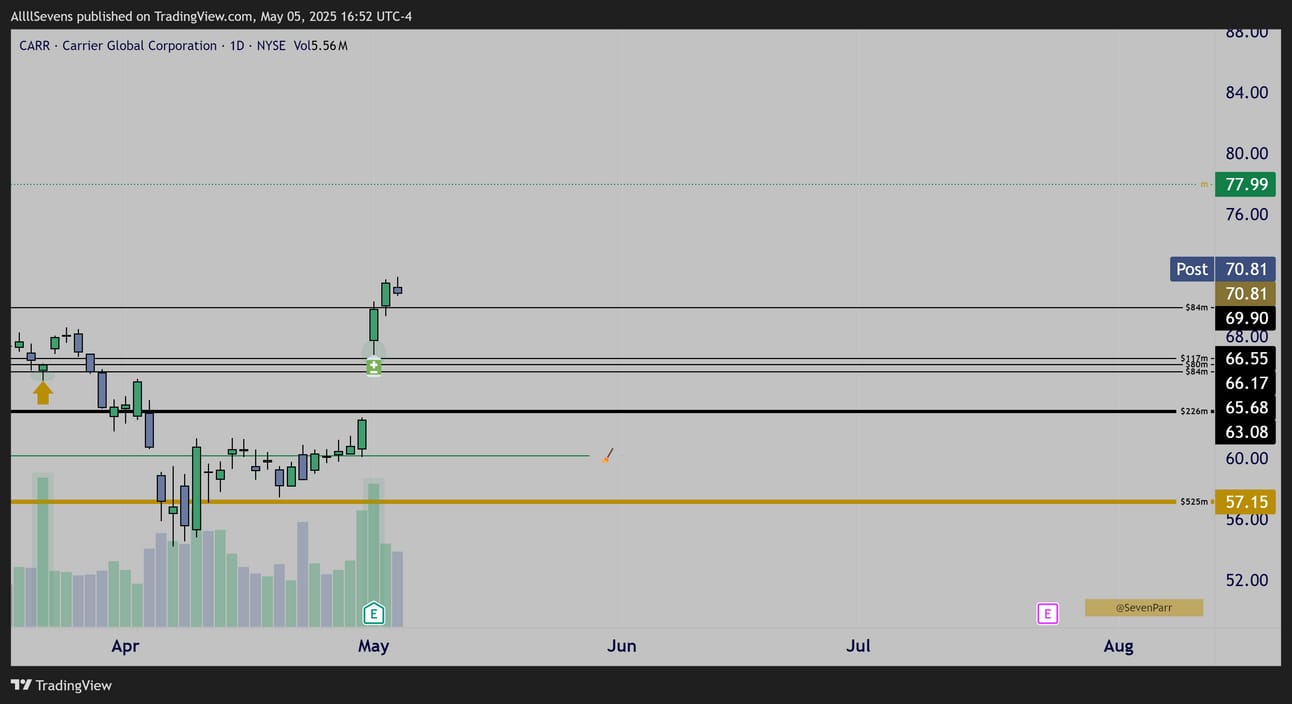
$CARR Daily Candles
Again, an extremely bullish start to the quarter, creating a bullish momentum gap after an positive reaction to earnings - reclaiming dark pools that saw major accumulation back in March. Incredible.
This could enter a multi-week / multi-month bullish trend with ER out of the way and the quarterly candle formation in play.
TSM
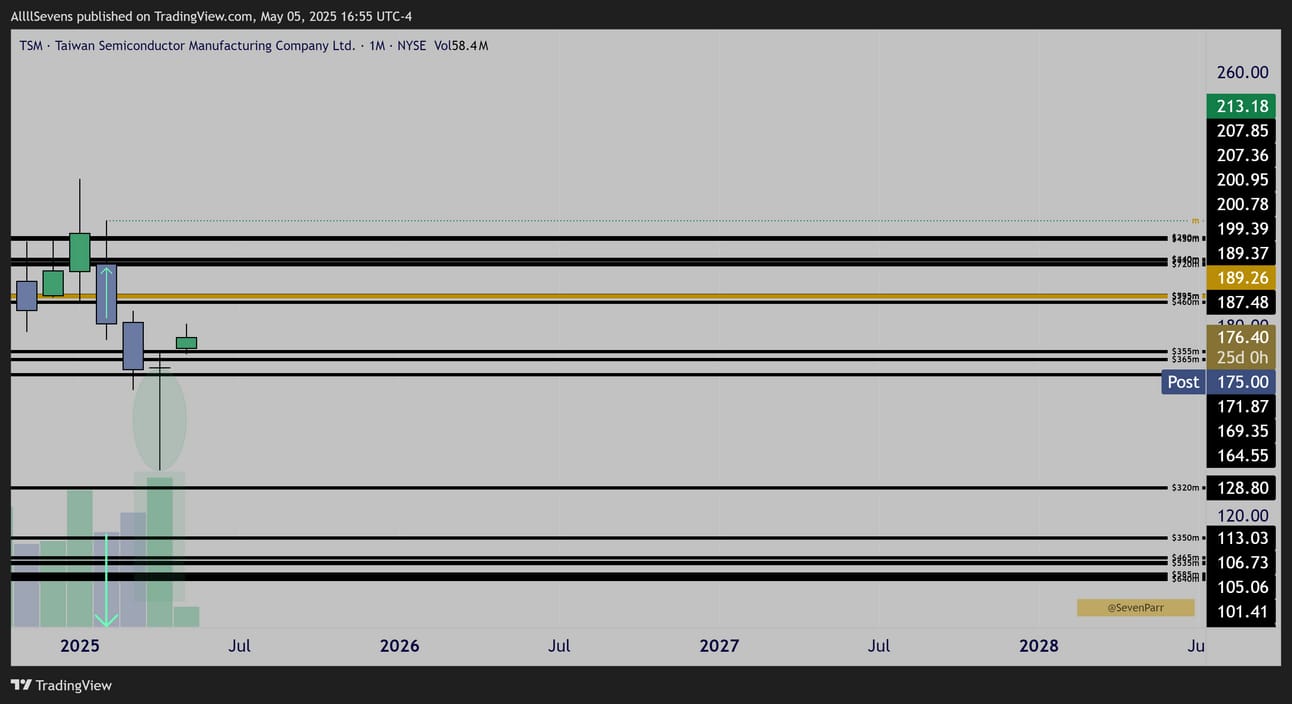
$TSM Monthly Candles
This is dark pool accumulation, within discount, on some of the largest volume the stock has ever seen. Huge investment is being made here.
I’ve talked about this a lot over recent months so I don’t have much more to say.
This is extremely notable long-term action in front of us.
The discount that’s open is directly off the stocks largest dark pool on record, confirming institutions are definitely BUYERS of this stock.
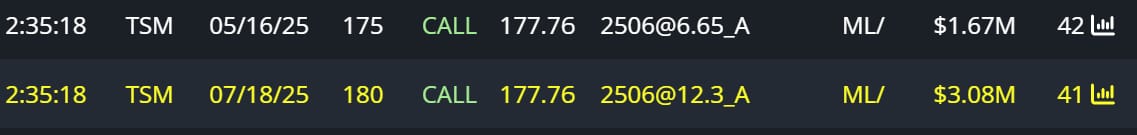
Executed Today
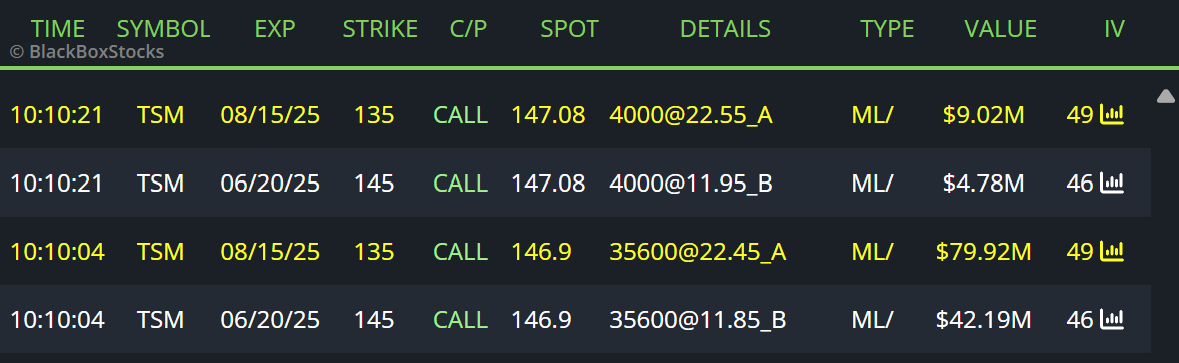
Executed on 4/21
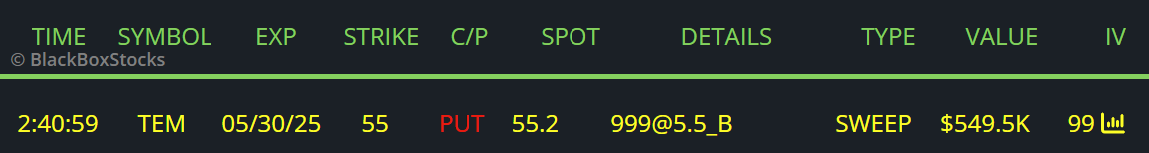
TEM
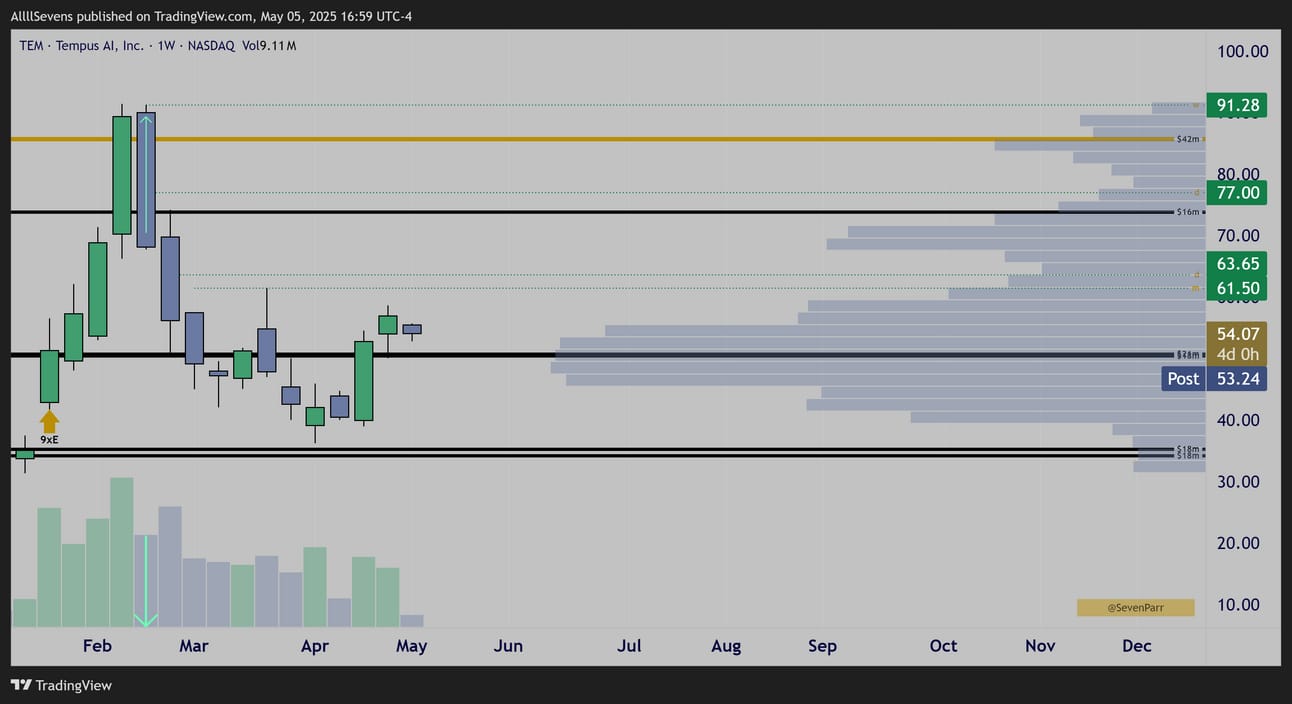
$TEM Weekly Candles
After pumping on its highest volume ever, pulling back showing a clear discount and developing a volume shelf at $50
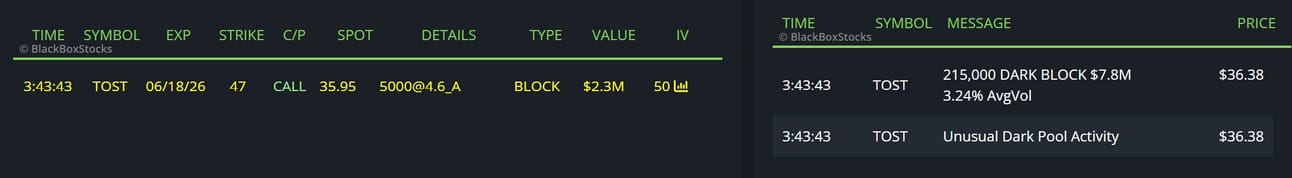
TOST
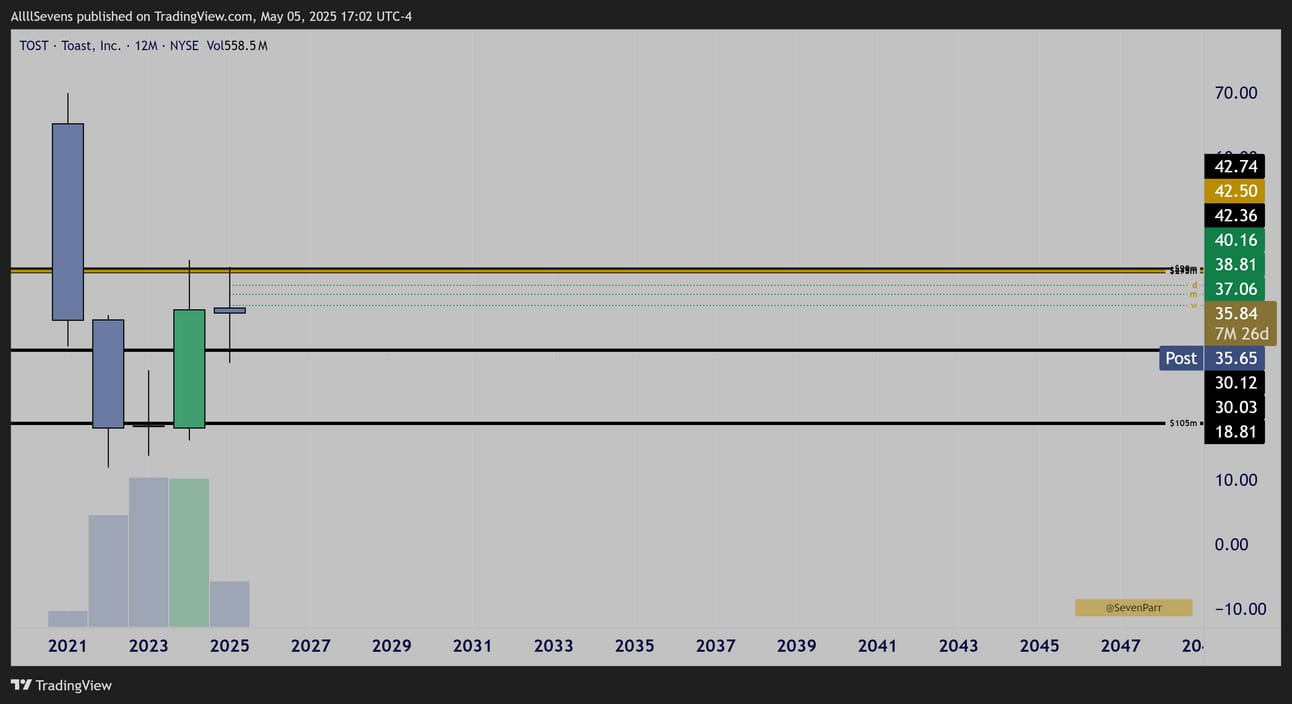
$TOST Yearly Candles
After a massive volume move over the last two years, the stocks largest dark pools on record were executed and price has fallen into consolidation.
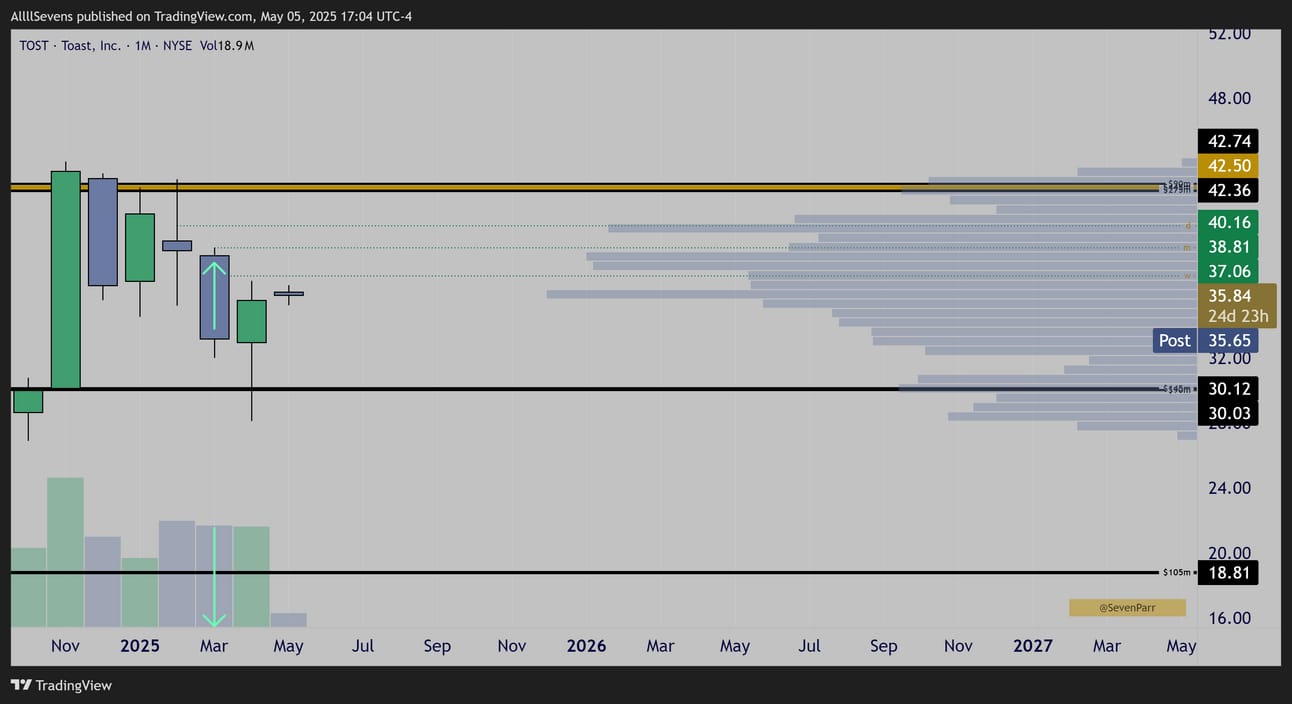
$TOST Monthly Candles
A nice discount formed in March
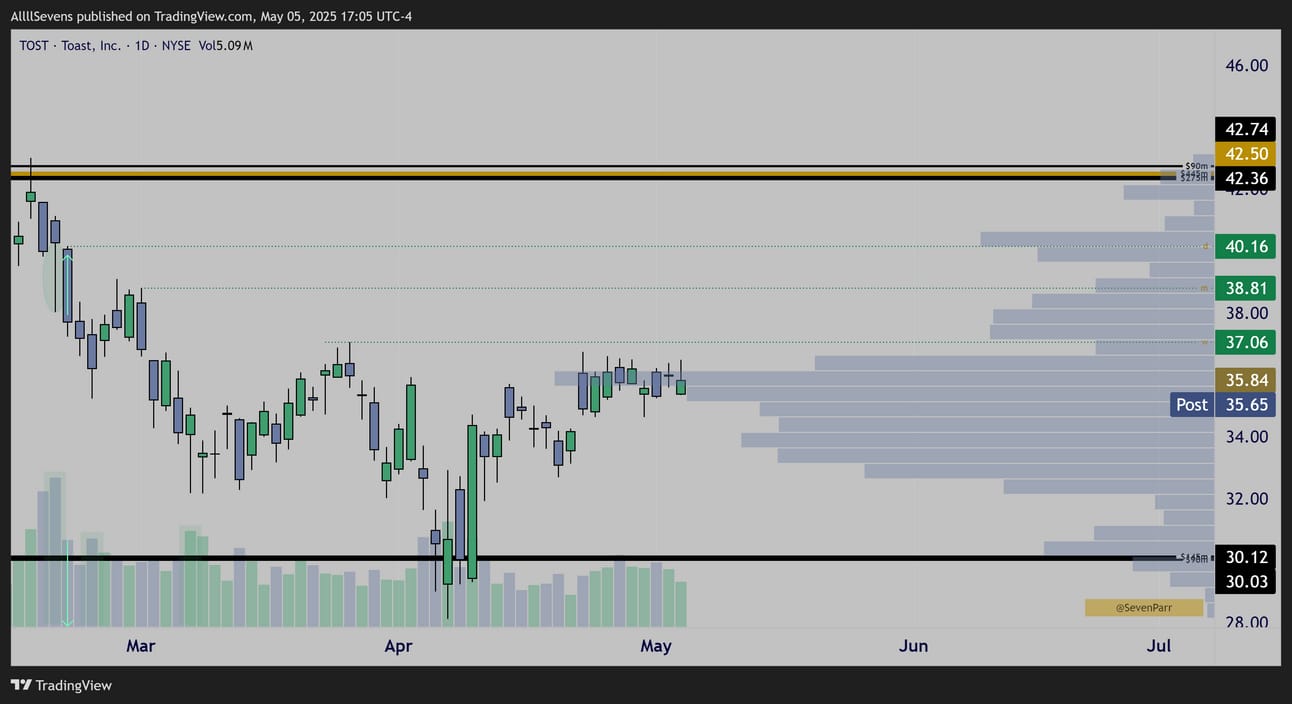
$TOST Daily Candles
Shows with clarity the accumulation that took place in late February before March’s discount sell-off. Price compressing at resistance over the last two weeks, headed into earnings…
JOIN THE DISCORD- Click Here
I covered quite a few Semi-Conductor stocks today, as well as some Consumer Discretionary names. Make sure to check out the $XLY and $SOXX / $SMH charts in discord. The XLY is at an AMAZING long-term spot with active discounts.
The SOXX just traded it’s highest volume ever- accumulating dark pools AND defending AVWAP bullish trend support…
Could be two leading themes in development here.