- AllllSevens
- Posts
- SPDR S&P Retail ETF
Disclaimer
Before you read this newsletter, it is crucial to understand the following:
-Background: I am a 22 year old college dropout with no formal education or professional experience in the fields of finance, investing, or stock market operations.
-Content Nature: All information I share is purely speculative and represents my personal, abstract opinions.
-Take With Caution: Approach the ideas, concepts, and data presented with a healthy dose of skepticism. They should not be considered as definitive or accurate information.
-Not Financial Advice: This content should in no way be interpreted as financial or investment advice. It does not constitute a recommendation to buy, sell, or hold any securities or financial instruments.
-Investment Risk: Investing and trading the stock market involves significant risk, including the potential for substantial financial loss.
-Professional Consultation: Always consult with a licensed financial advisor or perform thorough personal research before making any financial decisions involving the market.
-Liability Disclaimer: I bear no liability for any financial losses that could result from actions taken based on the information provided.
Lastly,
Understand that while I speak in certainties, no such thing actually exists.
This is all speculation.
XRT
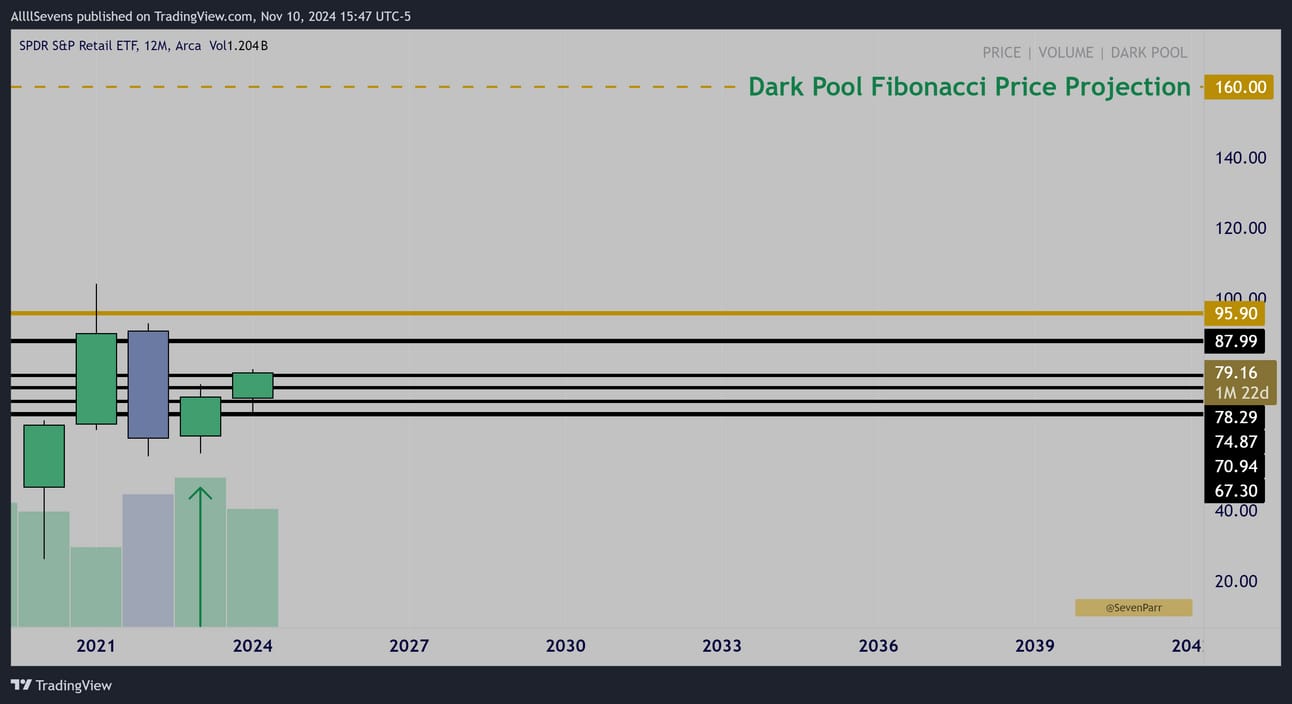
Yearly Interval
In 2023, a high volume inside candle was formed, which signals a potential upside reversal and continuation of a long-term bullish trend for this ETF.
One day, I project this will reach $160
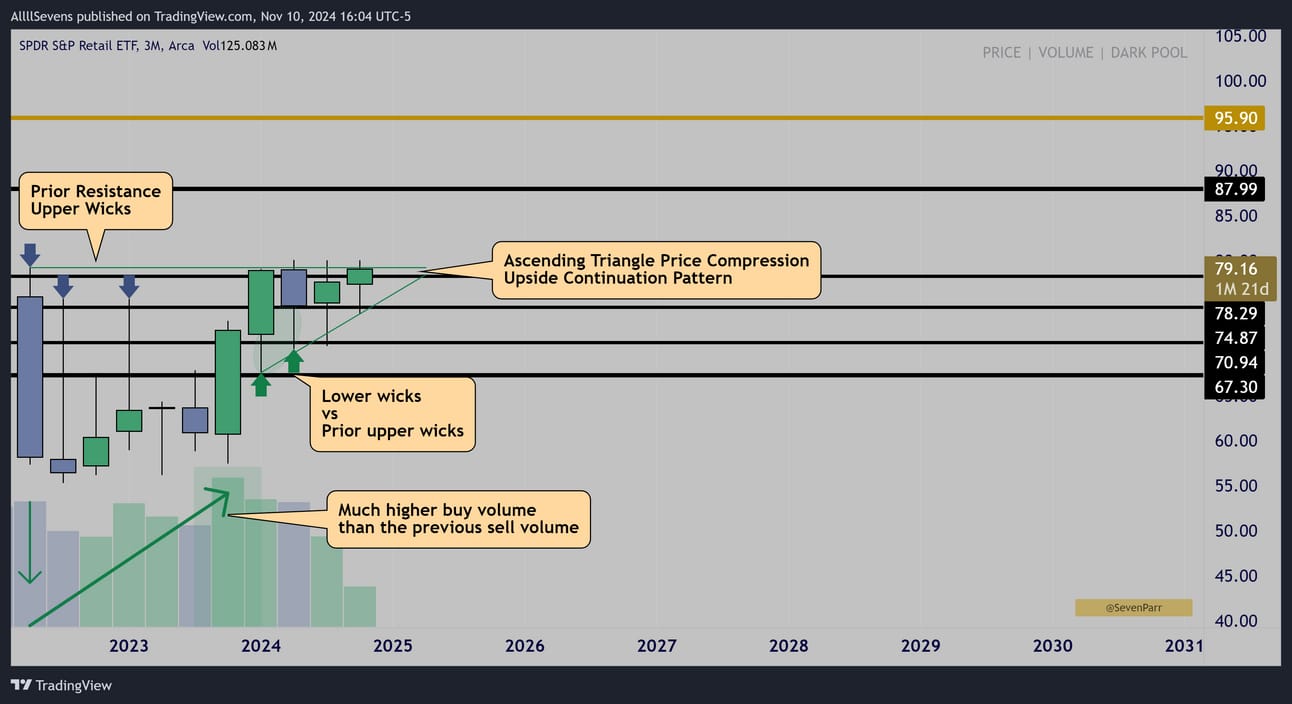
Quarterly Interval
After the bullish candle last year, price has not moved!
It has done something even better…
Ever since Q1 of this year, XRT has traded into a consecutively tighter and tighter price range. This creates an environment favoring a very explosive and impulsive move. In this case, it’s also inside of a YEARLY bull pattern, which adds even more explosive potential to the setup.
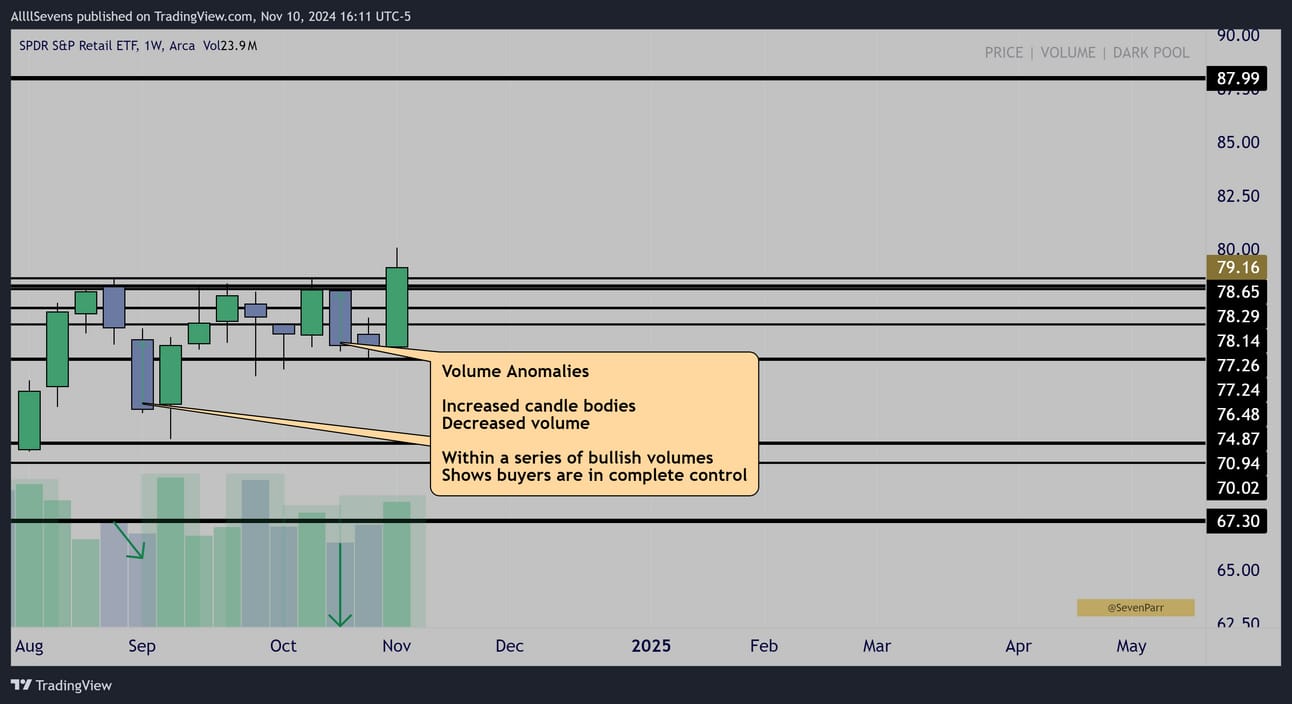
Weekly Interval
Since August, the patterns here have become especially skewed to the bull-side.
The large down candles on decreased volume show an extreme lack of sellers as price gets tighter than it has ever been.
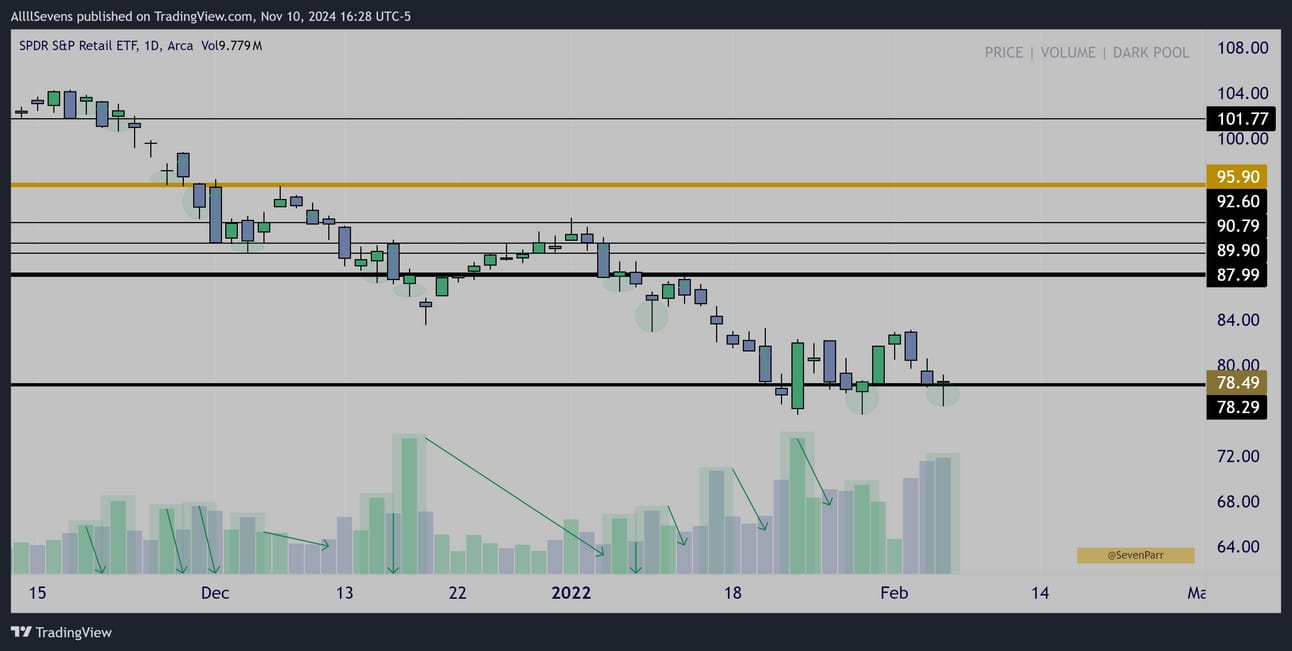
Daily Interval
Looking back at late 2021 and early 2022 price action is mind blowing.
This ETF saw consistent institutional accumulation during the entire bear market, and specifically at the $78.29 level where price is currently compressing.
So,
Inside of a bullish YEARLY candle pattern, price has compressed for over 6 months now, forming dominant lower wicks, and as the compression can’t get much tighter- weekly candle volumes are SCREAMING bullish.
I am looking to position myself in the following:
$XRT shares
$RETL shares (3x leveraged ETF)
12/20 85c @ .60
3/21/25 85c @ 1.55
1/16/26 100c @ 1.30
I apologize for the late send, and no newsletter last week, as there is just so much happening in the market, I have been sharing a majority of my research within my Discord and it has been hard to find the time to sort it all into a well-written & actionable newsletter.
Join my Discord here.
You are really missing out if you’re not in here.
I am working in there damn near 24/7 analyzing EVERYTHING and creating trade plans, discussing ideas as a team, and overall getting a very good read on how strong this market is.
Sign up for my next FREE newsletter here.
If you’re interested in tracking dark pool data and unusual options flow yourself, here’s my affiliate link for BlackBoxStocks, the platform I use:
http://staygreen.blackboxstocks.com/SHQh
Find me on DUB! Here.
-Must read this disclaimer.
(I will write a more official newsletter promoting what this is soon)
In short, you can view, and even copy my portfolio on this App.
Reply