- AllllSevens
- Posts
- Spotlight Newsletter
Disclaimer
All information presented in this newsletter are my personal opinions & for speculation purposes only.
Nothing is intended to be interpreted as financial or investment advice.
Preface
In a recent newsletter, I outlined why I am extremely bullish the market.
I covered each individual sector, including the the $XLY-
The Consumer Cyclical sector, of which $HD is a top holding.
The conviction behind this specific sector is… unreal.
Read that here.
I believe $HD is going to be a stand-out winner and I believe the stock is significantly undervalued at the moment, making it a top focus of mine for a long-term investment.
With this said, I’d also like to point out how MASSIVE this stock is…
Accumulation patterns are even more powerful the larger the market cap of a stock. It means more $$ is actually betting on the company.
$HD is one of the top 20 stocks in the $SPY, aka one of the top 20 best stocks in the entire world.
$468B market cap.
4rd largest XLY stock behind $AMZN & $TSLA
HD also has a long history of paying and increasing dividends for shareholders.
There’s also a pretty solid very short-term trade here… read to the end.
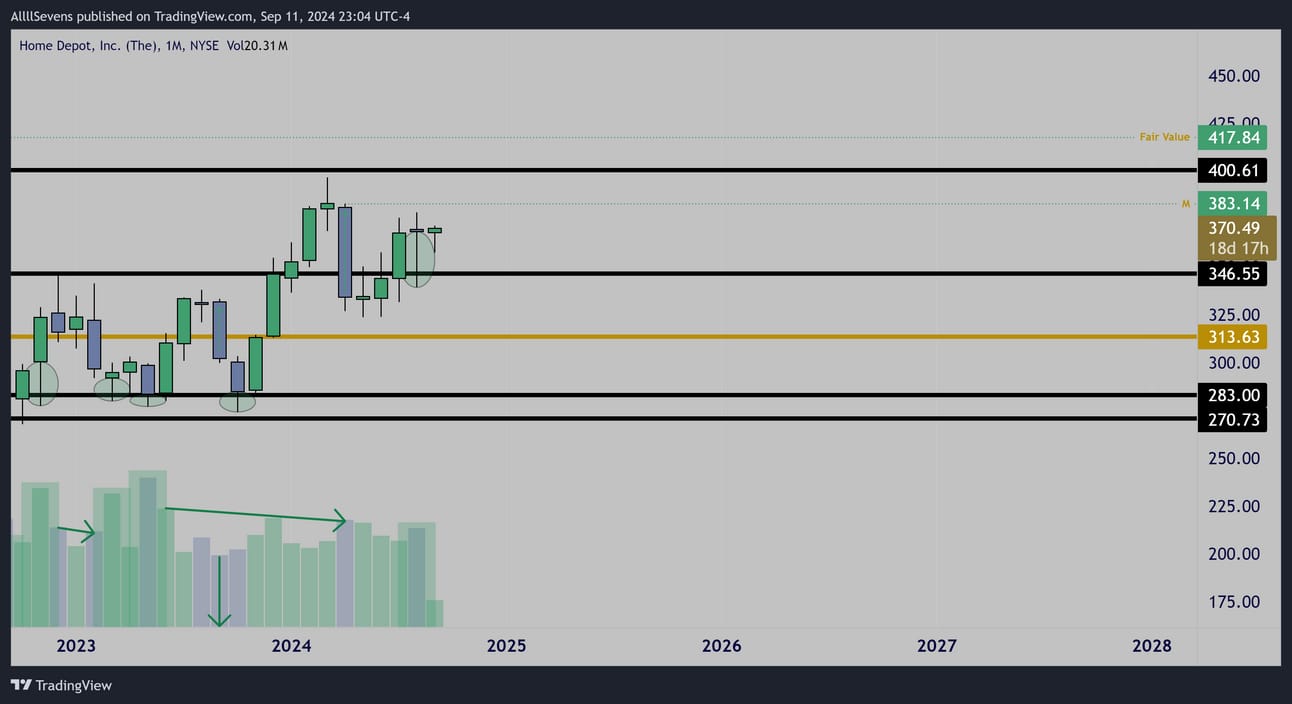
HD
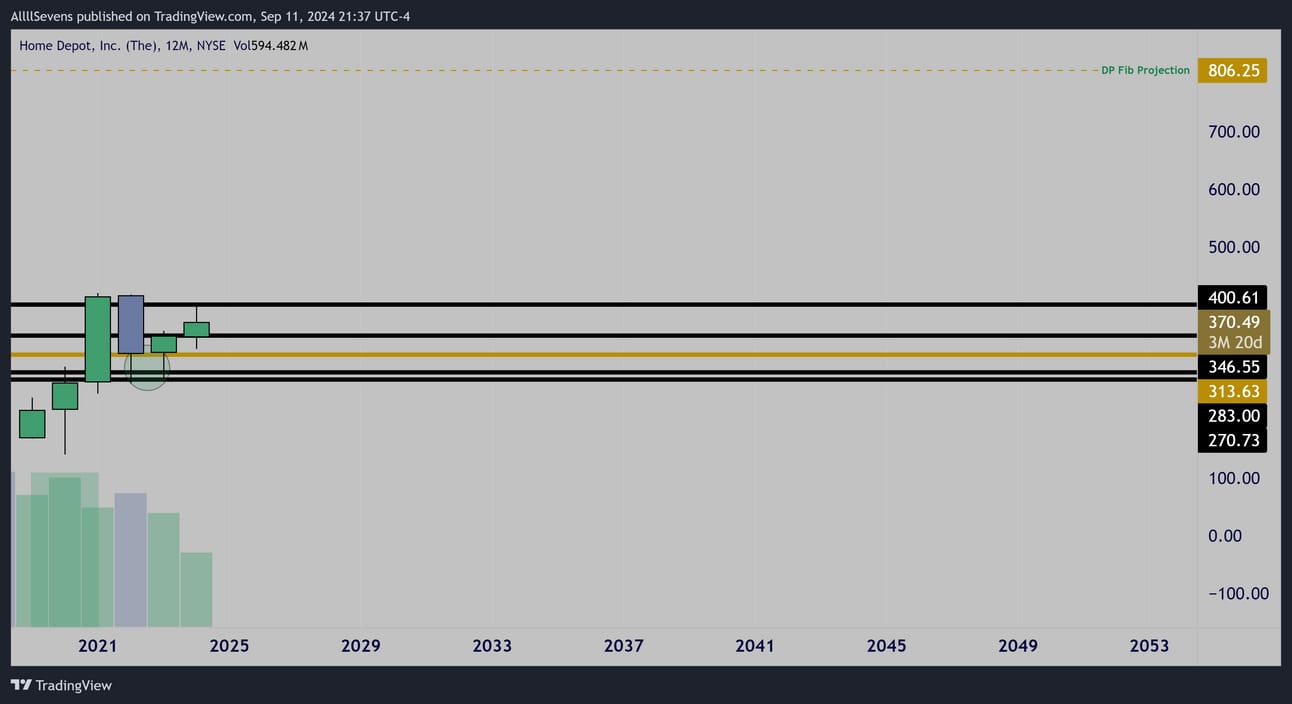
Yearly Interval
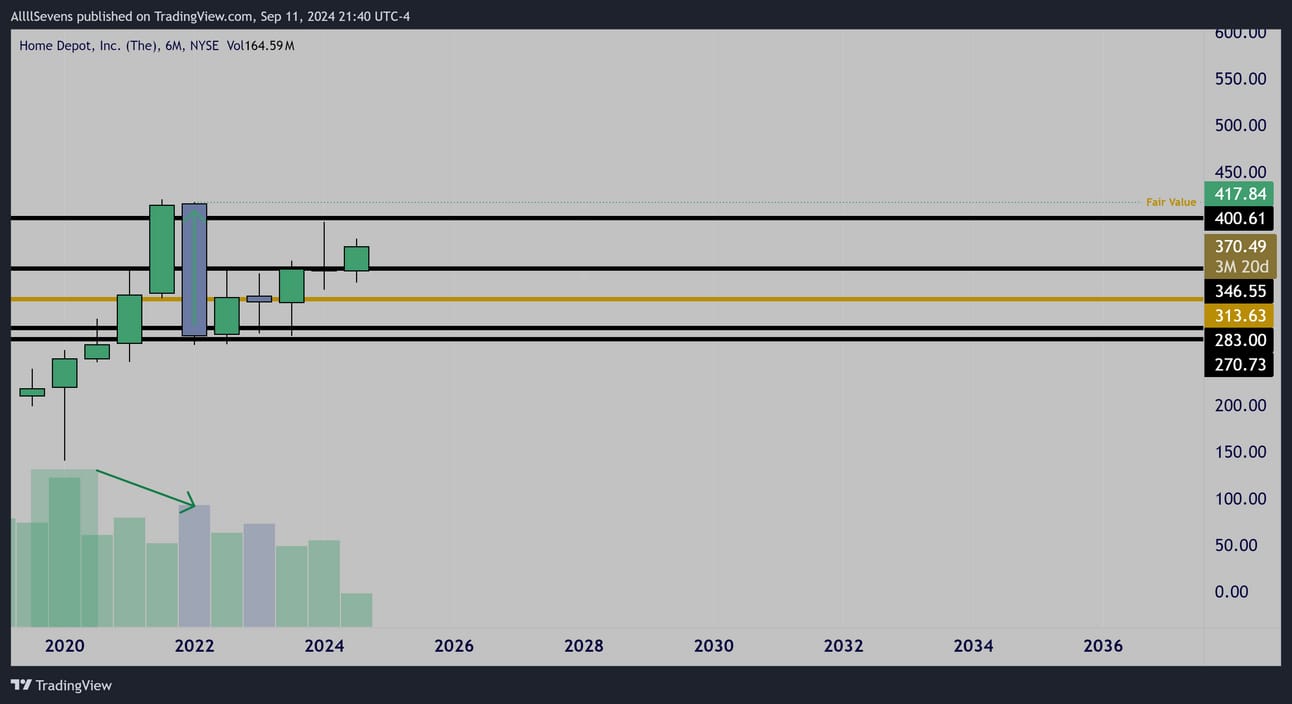
6 Month Interval
Notable accumulation during the 2020 dip. Visible through the large lower wick on volume on the far left of both intervals.
A retail sell-off during 2022. Visible on the 6 Month.
Huge down candle, backed by hardly any volume when compared to the accumulation that previously occurred.
This puts my “fair value” of $HD @ $417.84 per share.
A significant lower wick formed on the yearly after this sell-off.
Then, in 2023, a green hammer reversal pattern formed…
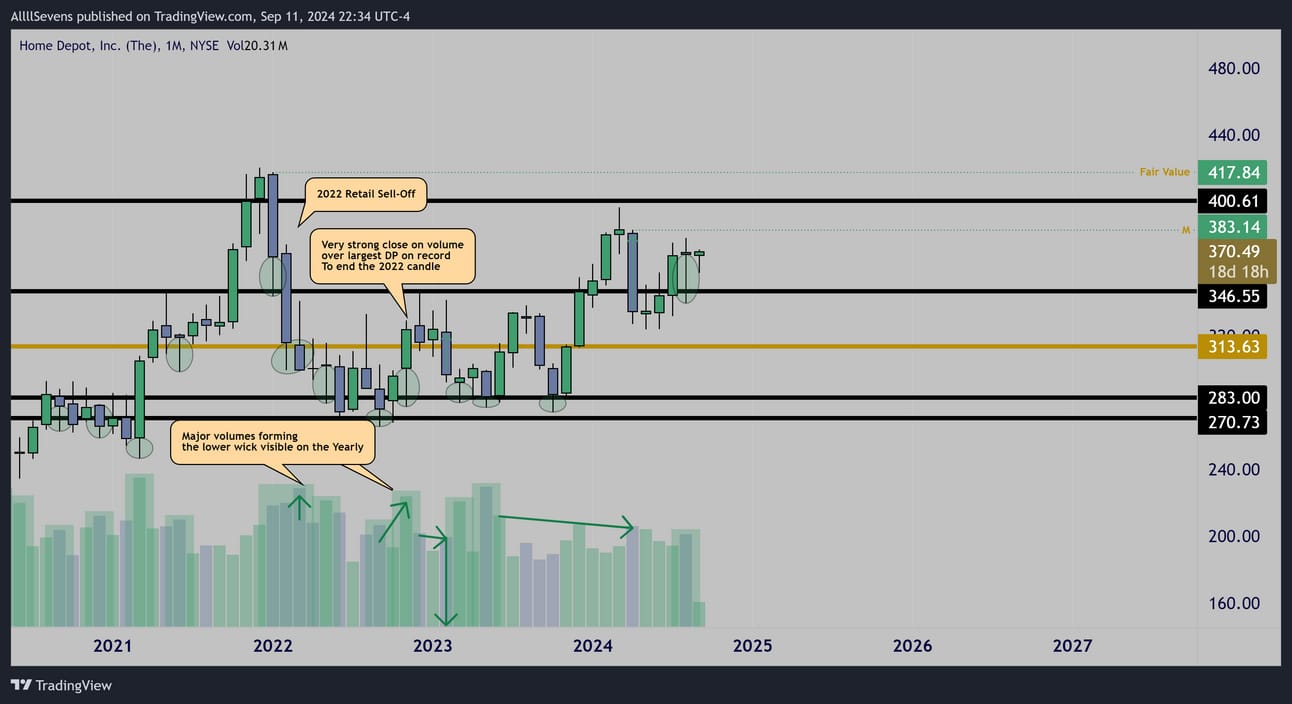
Monthly Interval
The monthly time frame is where we truly start to see the significance of this yearly reversal pattern that’s in the progress of playing out.
It becomes very clear that the lower wick on 2022’s candle was intentional, and in fact where most of that years volume came.
Directly at Dark Pools, showing institutional accumulation.
Extremely notable, is the massive volume impulse that closed the year over the largest DP on record @ $313.65 solidifying the idea that this yearly wick was 100% intentional.
Immediately following this strong yearly close, price rejected the $346.55 resistance on notably low volume- and it continued to sell off below the largest DP on record, on an increased spread candle…
with even lower volume. Blatant retail sell-off further confirming what the intentions are for institutions here, holding their ground and continuing to accumulate extreme amounts at the same dark pools below, that lead to the hammer that is the 2023 candle…
The 2023 candle doesn’t have major volume behind it, but when you consider how clean and intentional these monthly volumes are, it makes me extremely convicted that this hammer is very strong.
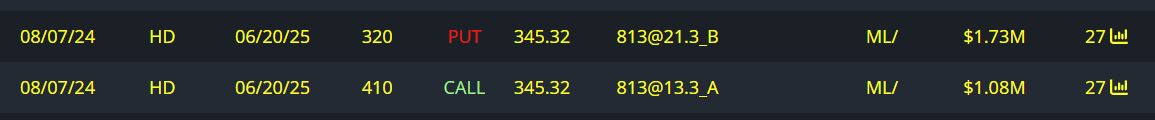
$1.73M June 2025 Put Writer
$1.08M June 2025 Call Buyer
There is a large trader I spotted on the options flow, betting on this yearly upside reversal pattern to pan out.
Monthly Interval
Just this April, a retail sell-off occurred and institutions accumulated this stock last month, right off the $346.55 Dark Pool.
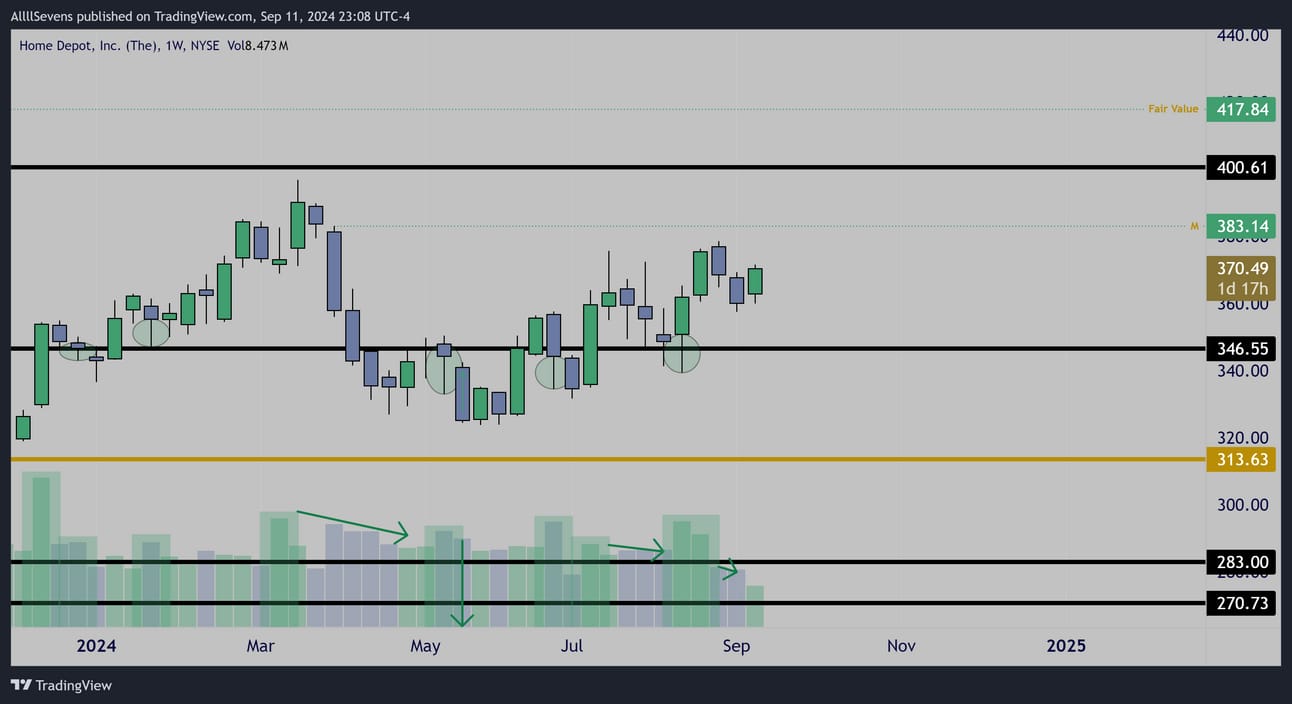
Weekly Interval
Shows the recent institutional investment even clearer.
I love the recent pullback on decreasing volume.
Now,
This is where I’m going to get extremely speculative and share a weekly expiration trade I’m watching… This could fall flat on it’s face-
Doesn’t change the yearly and monthly accumulations.
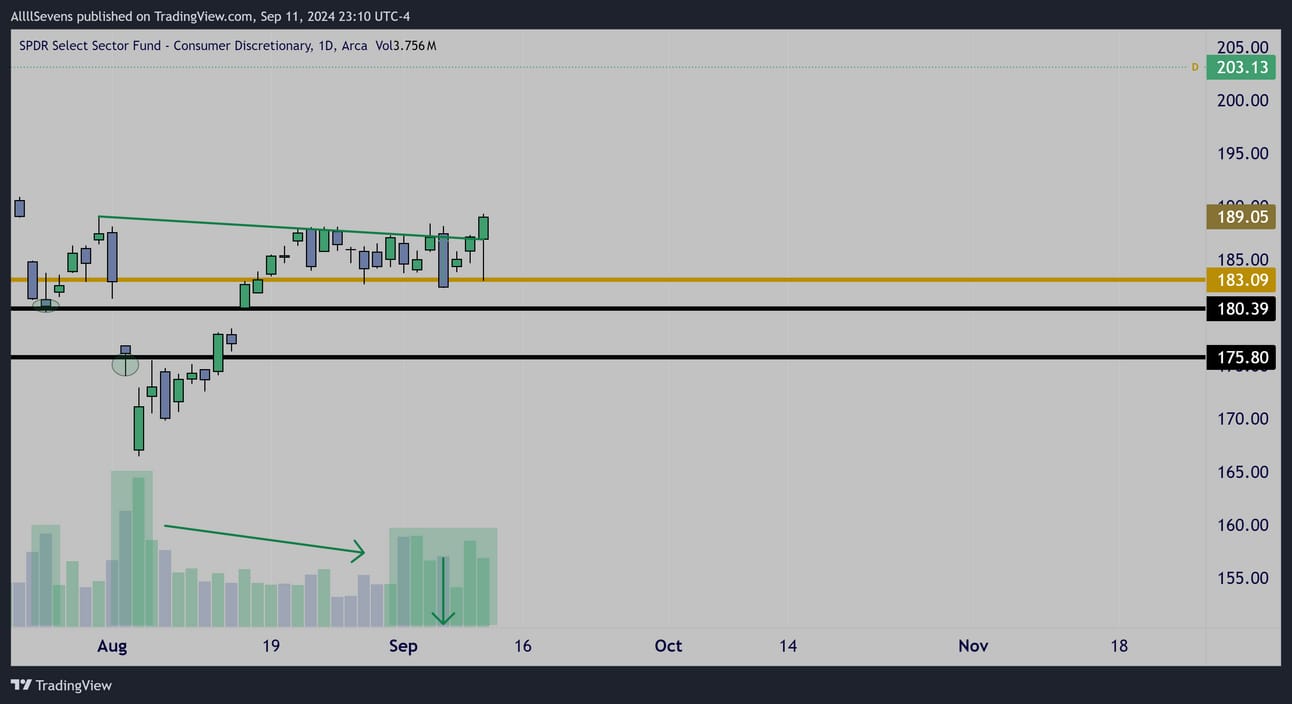
$XLY Daily Interval
The entire sector just saw a very strong bullish engulfing candle off it’s largest Dark Pool on record, inside of a multi-week bull flag with very clear institutional accumulations active.
I want to remind you of the bigger picture here for this sector…
If this demand we’re bouncing from continues to hold, the broader market is about to expand DRASTICALL.
Remember, the XLY has seen it’s largest institutional investment in recorded history off this exact demand. Please make sure you have read the newsletter I linked in the preface of this newsletter, specifically covering this sector.
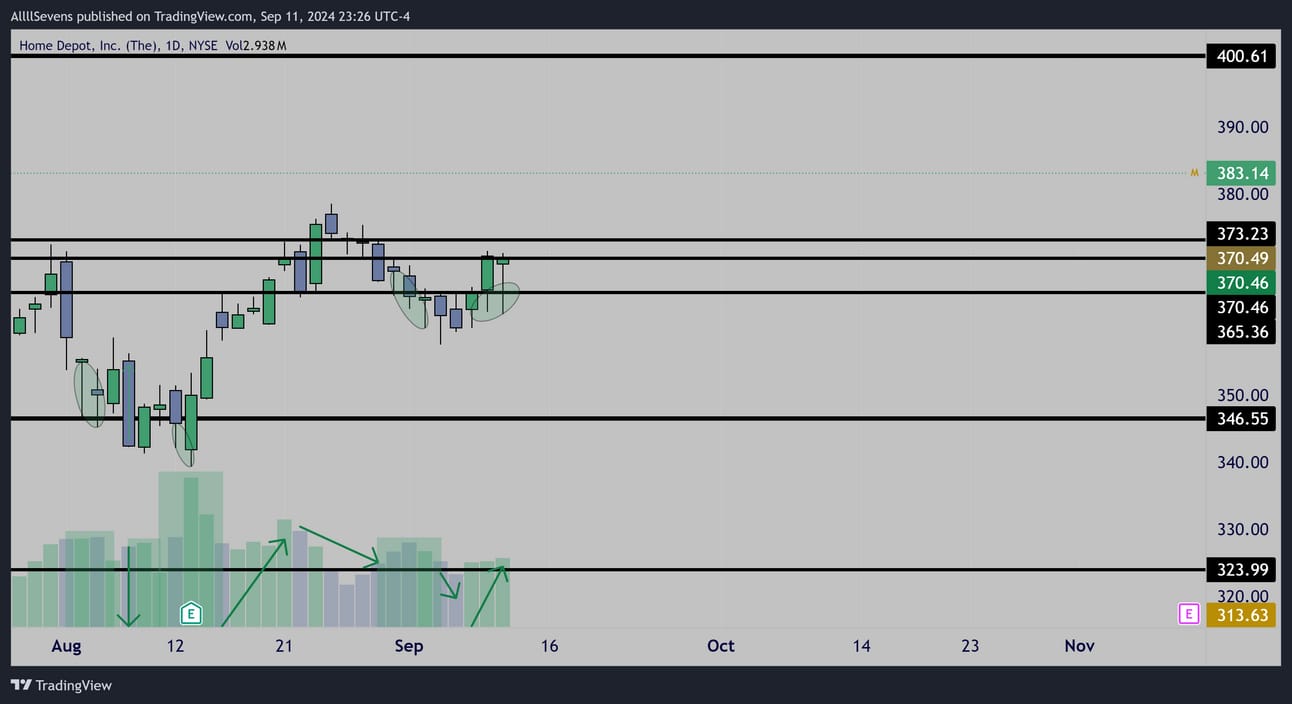
$HD Daily Interval
Extremely clear bullish volumes, working with a bullish reaction to earnings, which helps a lot with short-term retail driven trend.
Increased volume inside candle as price looks to break a bull-flag, showing extreme pressure for a large move on the horizon.
If $370.46-$373.23 can get turned into support in the coming sessions, this could have quite the strong weekly close.

$153K Call Buyer for 1dte 380c’s
I hope you found value in this newsletter.
Make sure you’re subscribed for my next one!
Subscribe here.
Make sure you’re following me on 𝕏/Twitter for updates.
@SevenParr
If you are finding immense value in my analysis-
Please Upgrade your subscription to AllllSevens+ for just $7.77 per month and compensate me for the time I put into my work.
Also get access to my Discord where I share even more data, gathering and collecting information before I write newsletters and make posts to 𝕏/Twitter. “behind the scenes access” if you will.
Ask me questions anytime, and always get a response.
There is a great community of like-minded individuals coming together here. I would love to see it grow.
If you’re interested in tracking dark pool data and unusual options flow yourself, here’s my affiliate link for BlackBoxStocks, the platform I use:
http://staygreen.blackboxstocks.com/SHQh
If you like how my charts look, here’s my affiliate link for Trading View, the platform I use:
https://www.tradingview.com/pricing/?share_your_love=sevenparr
Lastly, if you’re looking for a Brokerage to trade stocks & options, here’s my referral link for Webull. They give you (and me) free stocks when you make an account and deposit money with this link:
https://a.webull.com/Nwcp9cTCDSzfJtjWL4
Reply