- AllllSevens
- Posts
- Spotlight Newsletter
Disclaimer
All information presented in this newsletter are my personal opinions & for speculation purposes only.
Nothing is intended to be interpreted as financial or investment advice.
Preface
$GE was founded over 100 years ago, when Thomas Edison’s three electric companies merged. It was one of the original 12 companies to debut on the Dow Jones in 1986.
This has been around for a long-time and it is a very SLOW moving stock-
In fact, it is trading around the same prices it was in 1999…
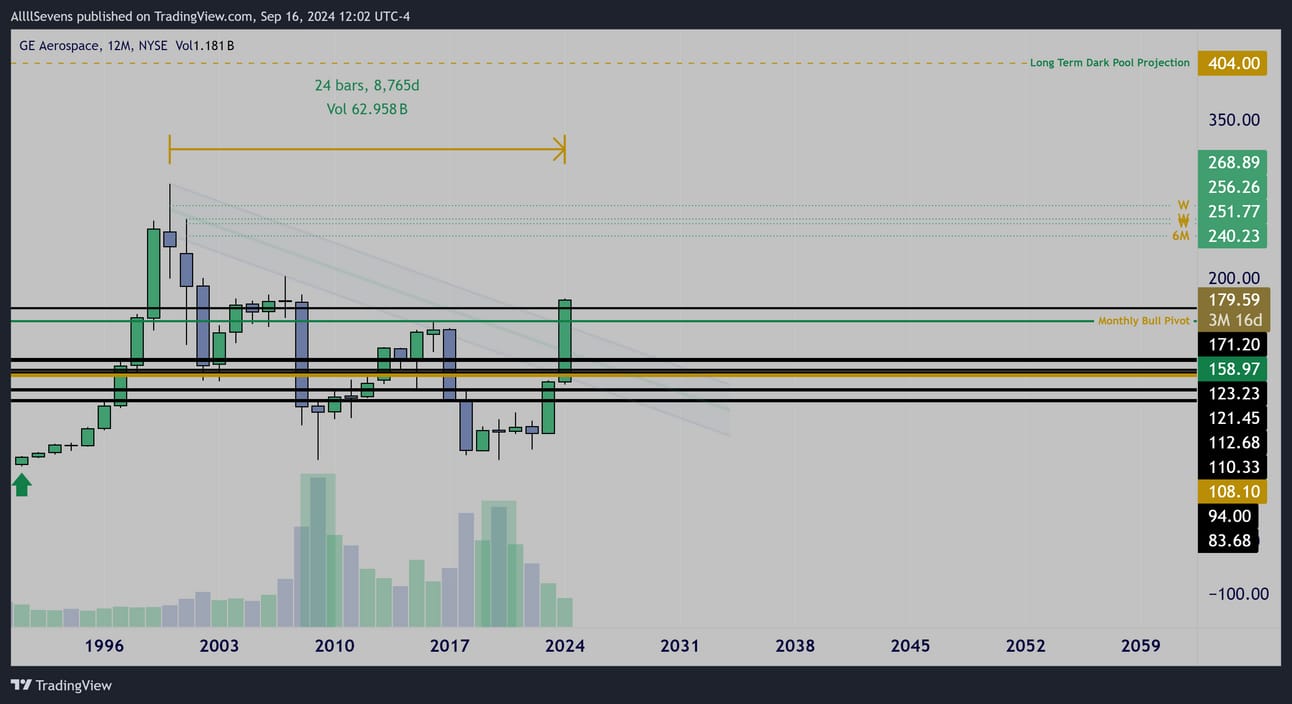
Yearly Interval
$GE has been in a “Bull Flag” compression for over two decades.
A Bull Flag is a period of consolidation following a large bullish trend where price consolidates into a short-term downtrend before eventually resuming the initial bullish trend.
The initial bullish trend here began in the 1990’s at roughly $30 per share.
In 2009, this area was retested and saw significant accumulation, visible by the large hammer candle on the stock’s highest volume ever.
The buyers who initiated the 1990 rally, remain bullish the stock.
This confirms the idea of the consolidation being a Bull Flag!
In 2018-2020 $30 was tested and major volumes defended it for the second time! This is where a double bottom came into play- a potential statement pattern establishing a long-term bottom in the stock…
Before we move on, I’d also like to mention that a major reason I am writing about GE today, is the thesis I have behind the entire Industrial sector.
In my recent newsletter, The Dawn of The Bull Market, I ended it buy hypothesizing that broader market expansion, shown best through the $RSP chart, will be the key to a continued stock market rally.
The $XLI has bene compressing in nearly the same manor as the RSP - AND
It also has been seeing substantial dark pool activity just like the RSP
This makes me think that the Industrial Sector could emerge as a major leader in the coming months, which would be big for GE considering it is a staple in the Industrial Sector ETF.
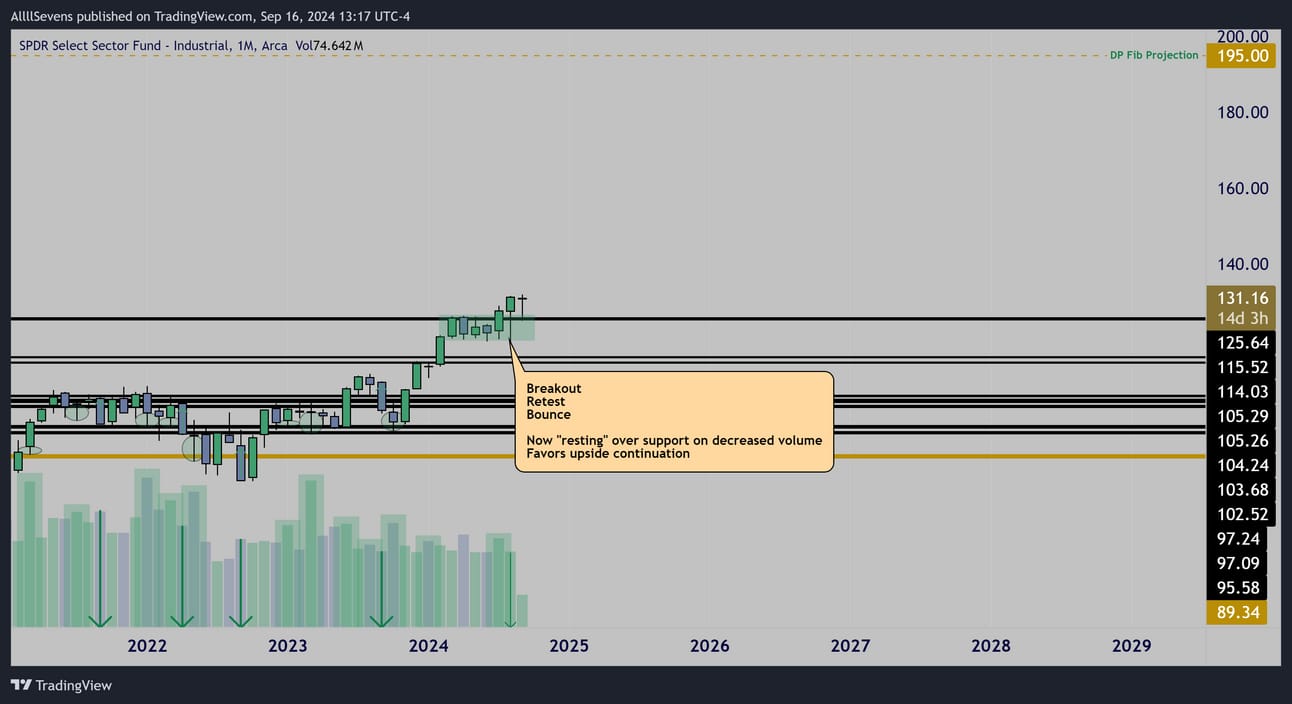
$XLI Monthly Interval
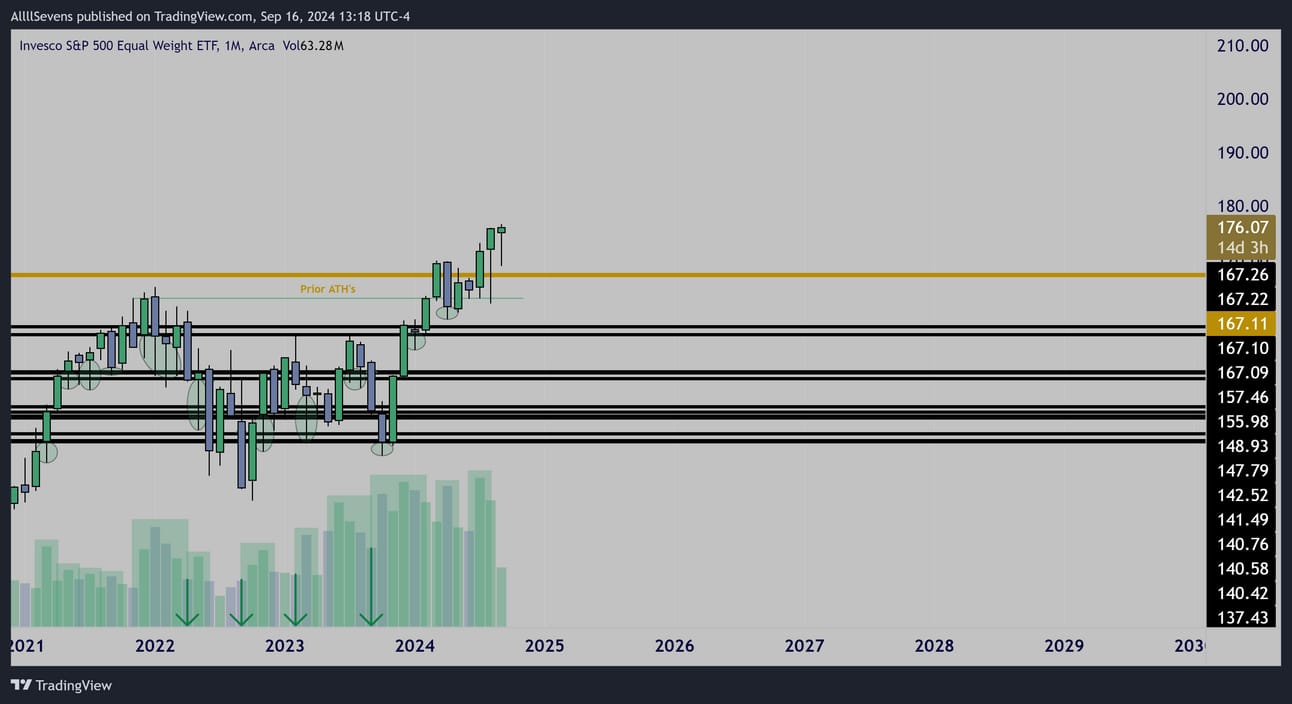
$RSP Monthly Interval
GE
As you can see in the Yearly chart above-
$GE is attempting to break downtrend resistance PLUS a horizontal resistance.
I think this is a valid breakout and I’m going to show you why.
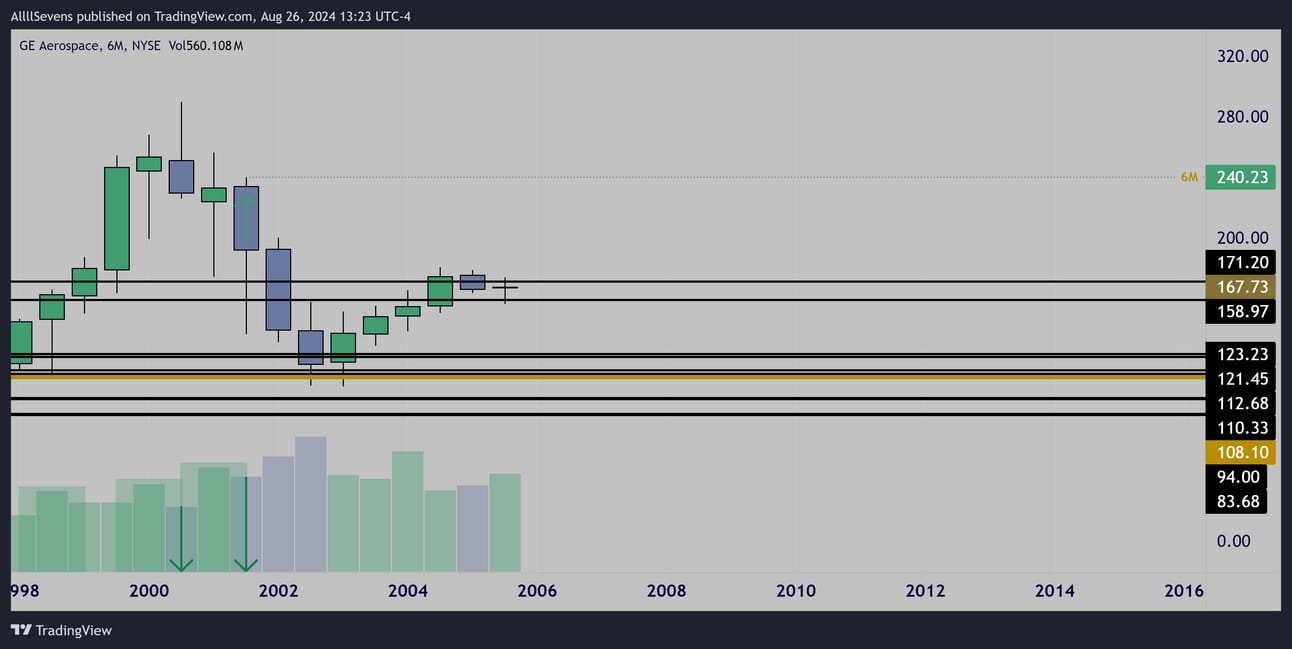
6 Month Interval
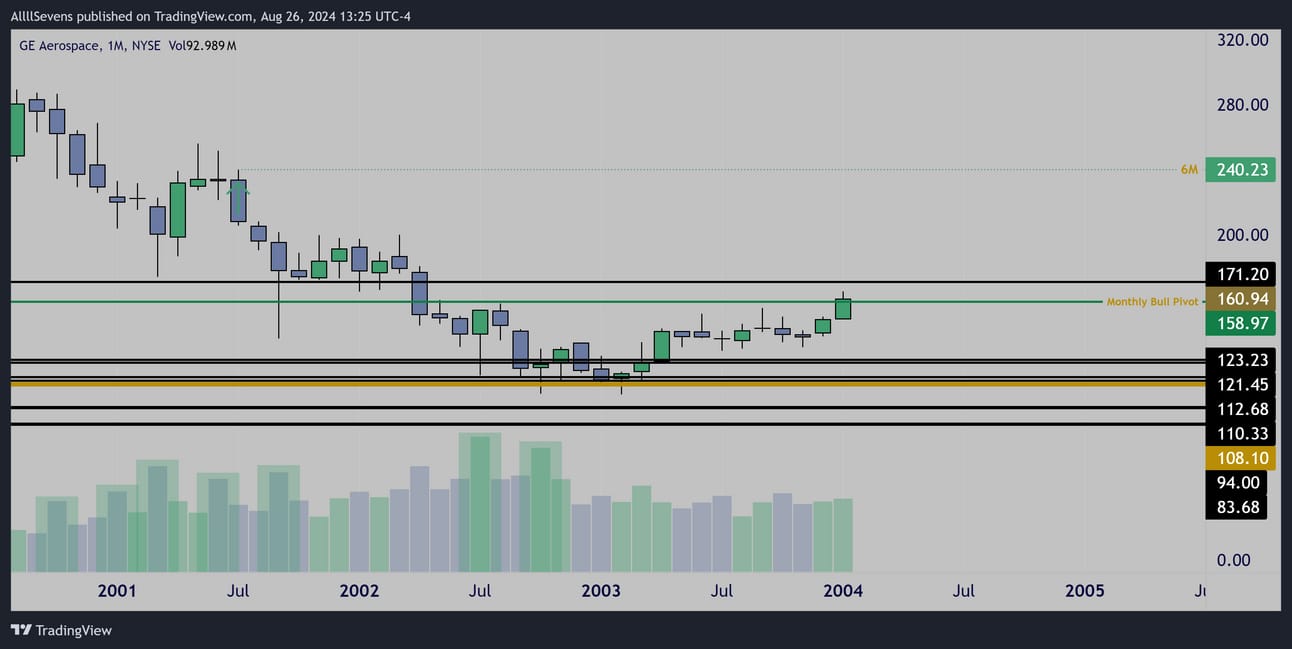
Monthly Interval
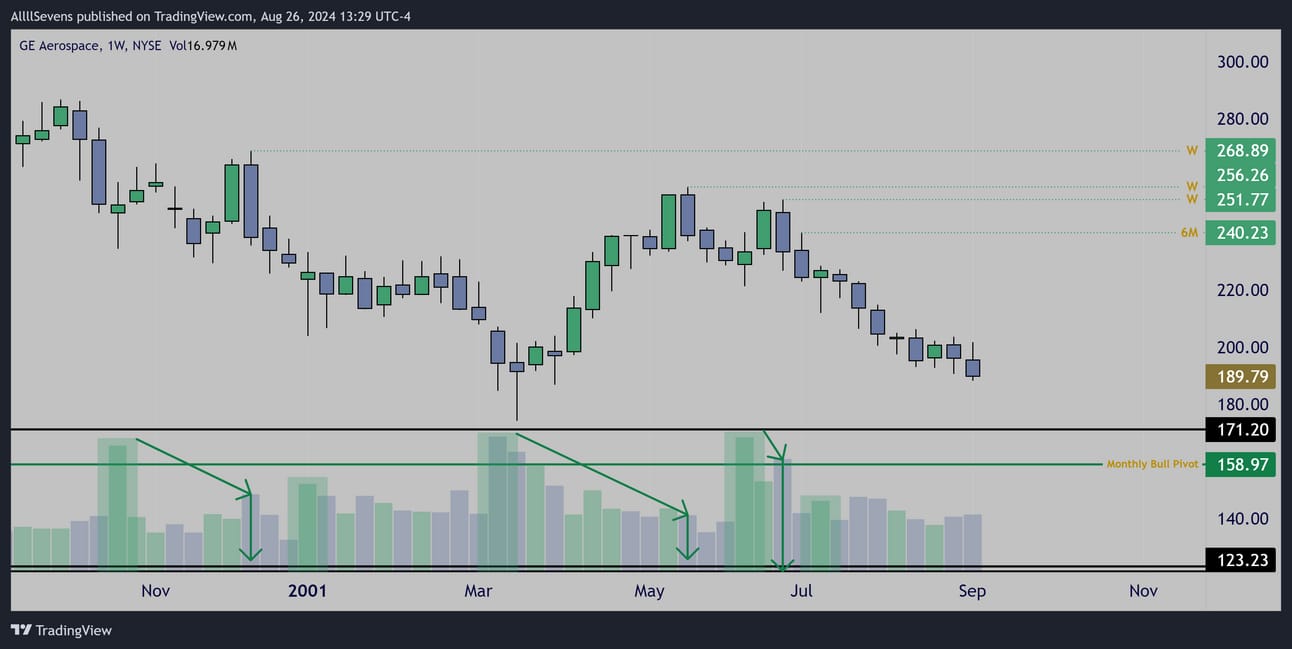
Weekly Interval
Backtracking to the early 2000’s high on $GE, we can see that accumulation has been taking place here for quite some tine.
Specifically off the $158.97-$171.20 demand currently being broke…
The dotted lines on my chart are imbalances at which I believe $GE becomes fairly valued once price reaches those levels again.
Therefore, anywhere below $268.89, I see $GE as a long-term discount.
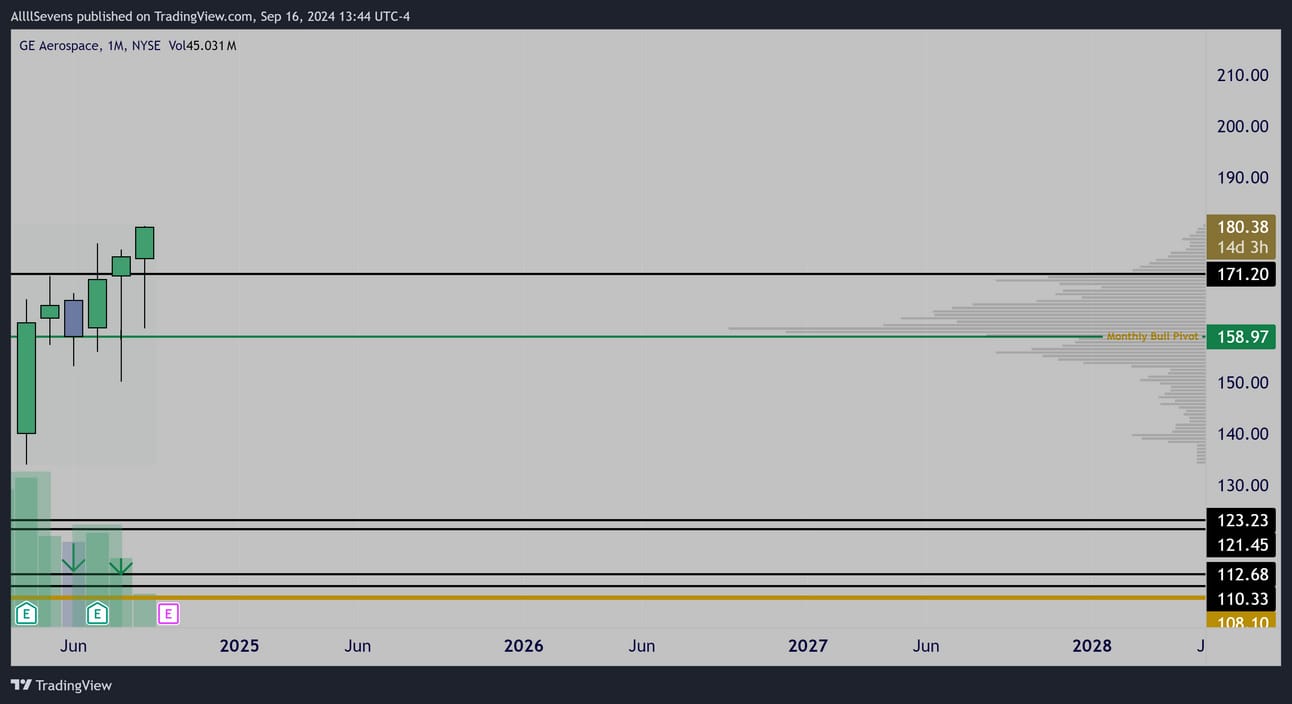
Monthly Interval
Price has congested quite a bit as it attempts to reclaim this area.
With two positive earnings reports, it has seen large volume bullish impulses followed by decreased volume inside candles favoring a healthy breakout.
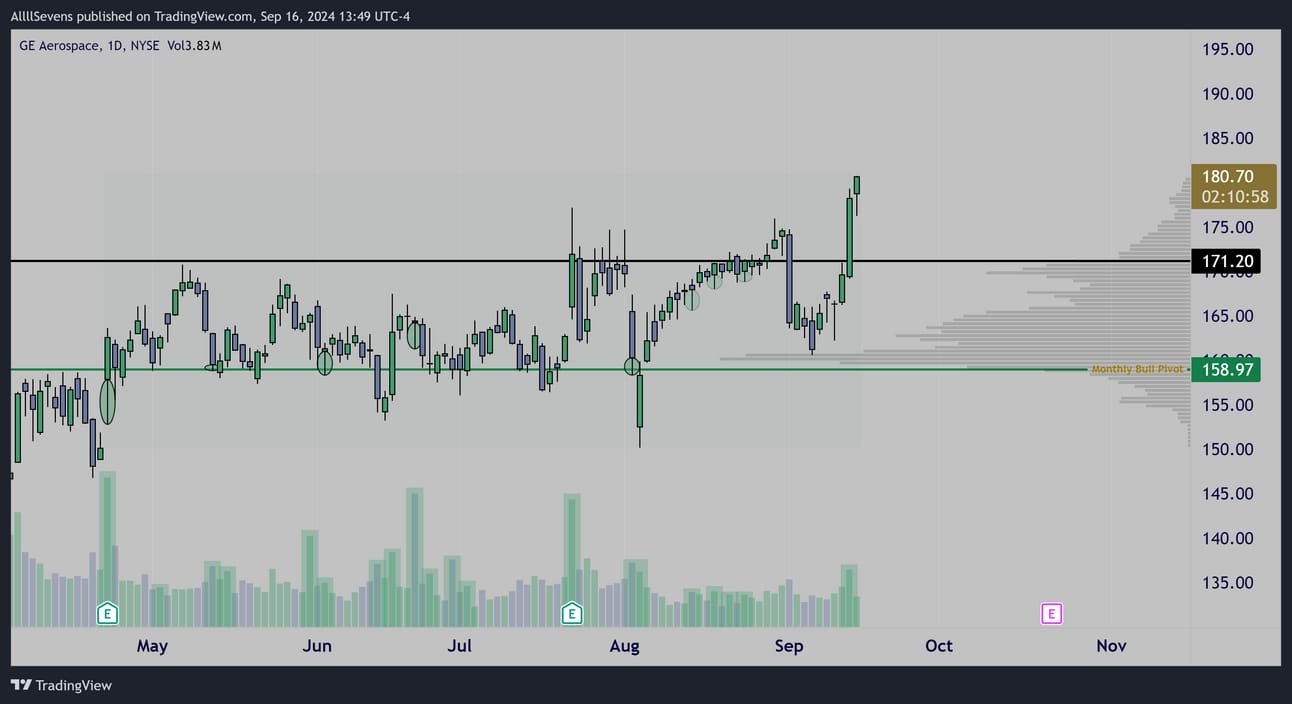
The Daily interval best displays the recent accumulation that has taken place as this as been sideways for nearly 5 months inside this demand.
It has been tricky deciding WHEN to publish this newsletter…
With the recent failure at resistance and very fast recovery leading to a strong and decisive weekly breakout candle, I think now is the time.
There has been little bull flow on this, I assume because it really is just a SLOW mover. I think smart money is MUCH more focused on simply buying an holding shares for a potential multi-year run.

$987K Call Buyer for January

$2.82M Call Buyer for November

$2.82M Put Writer for November

$1.31M Call Buyer for October
If $GE falls back and does not hold the $158.97 DP my short-term breakout thesis is likely failing and risk would need managed.
Thank you for taking your time to reading this newsletter.
If you found value,
Make sure you’re subscribed for my next newsletter!
Make sure you’re following me on 𝕏/Twitter @SevenParr
I began gathering all the data above for weeks in advance of this newsletter- sharing it only in my Discord until I felt comfortable publishing, so if you feel like that would have been advantageous and you could have executed sooner AND if you really really like my work-
Upgrade your subscription to AllllSevens+ for just $7.77 per month.
It is cheap for a reason. Most of the value I provide is for free because my goal is to help as many people as possible see the market for how it truly is. Upgrading is a way to give back!
If you’re interested in tracking dark pool data and unusual options flow yourself, here’s my affiliate link for BlackBoxStocks, the platform I use:
http://staygreen.blackboxstocks.com/SHQh
If you like how my charts look, here’s my affiliate link for Trading View, the platform I use:
https://www.tradingview.com/pricing/?share_your_love=sevenparr
Feel free to DM me on twitter for the colors I use.
Lastly, if you’re looking for a Brokerage to trade stocks & options, here’s my referral link for Webull. They give you (and me) free stocks when you make an account and deposit money with this link:
https://a.webull.com/Nwcp9cTCDSzfJtjWL4
Reply