- AllllSevens
- Posts
- Weekly Newsletter
Disclaimer
All information presented in this newsletter are my personal opinions & for speculation purposes only.
Nothing is intended to be interpreted as financial or investment advice.
Preface
Moving forward, you can expect a newsletter from me EVERY weekend.
Every trading day, I scan my charts, the flow, and the dark pools.
In these newsletters, you will receive my analysis on what I see as the seven best setups that I came across.
Make sure you read until the end because I may have just saved the best for last.
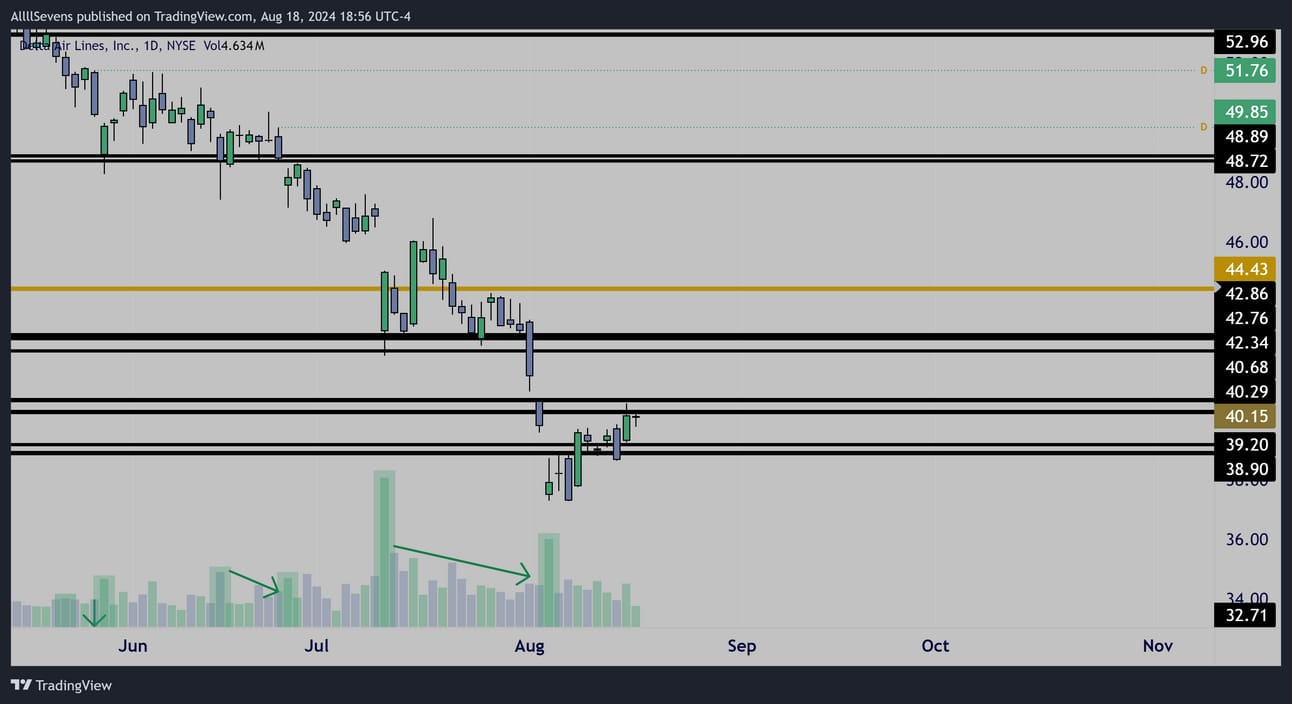
UAL
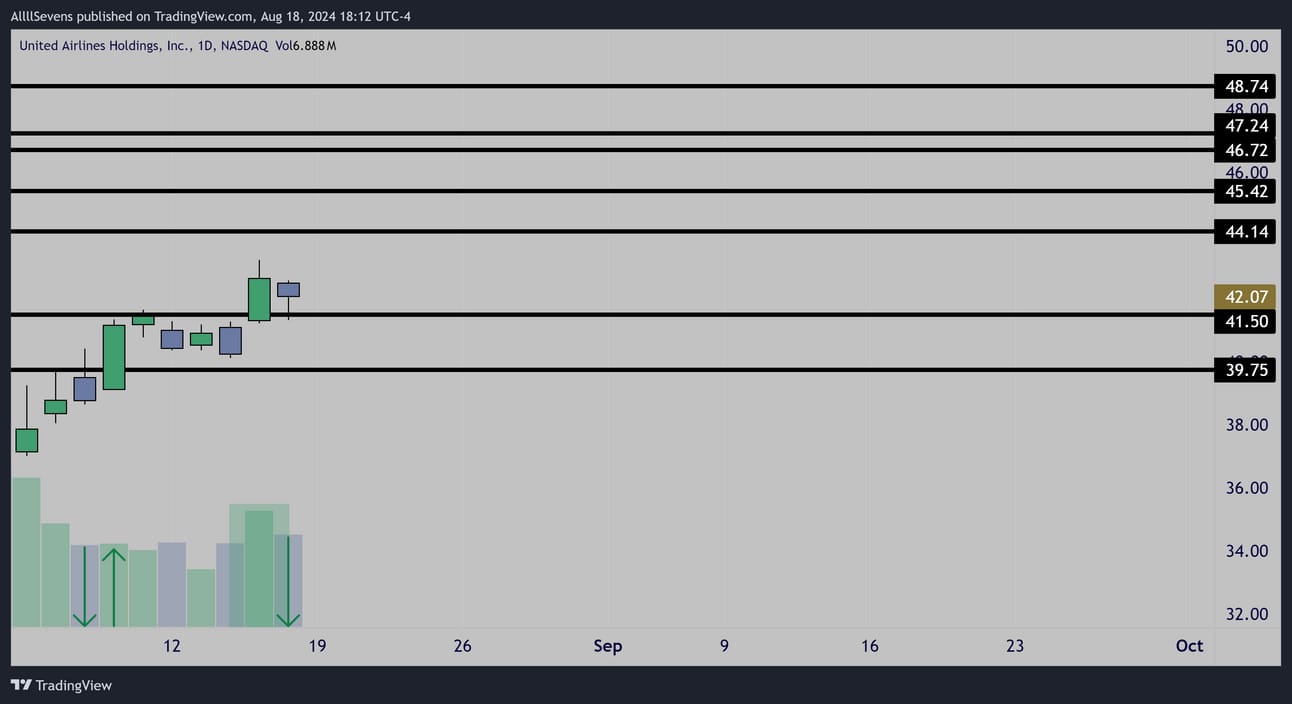
Daily Interval
First, we see acceptance of the$39.75 dark pool shown by the low volume rejection followed by an increased volume breakout.
Next, we see a high volume bullish impulse over the $41.50 DP followed by a decreased volume inside candle.
This typically favors upside continuation if $41.50 remains support.
If $41.50 is lost, can watch for buyers to step back in at $39.75
Range to $44.14 is the short-term trade here.
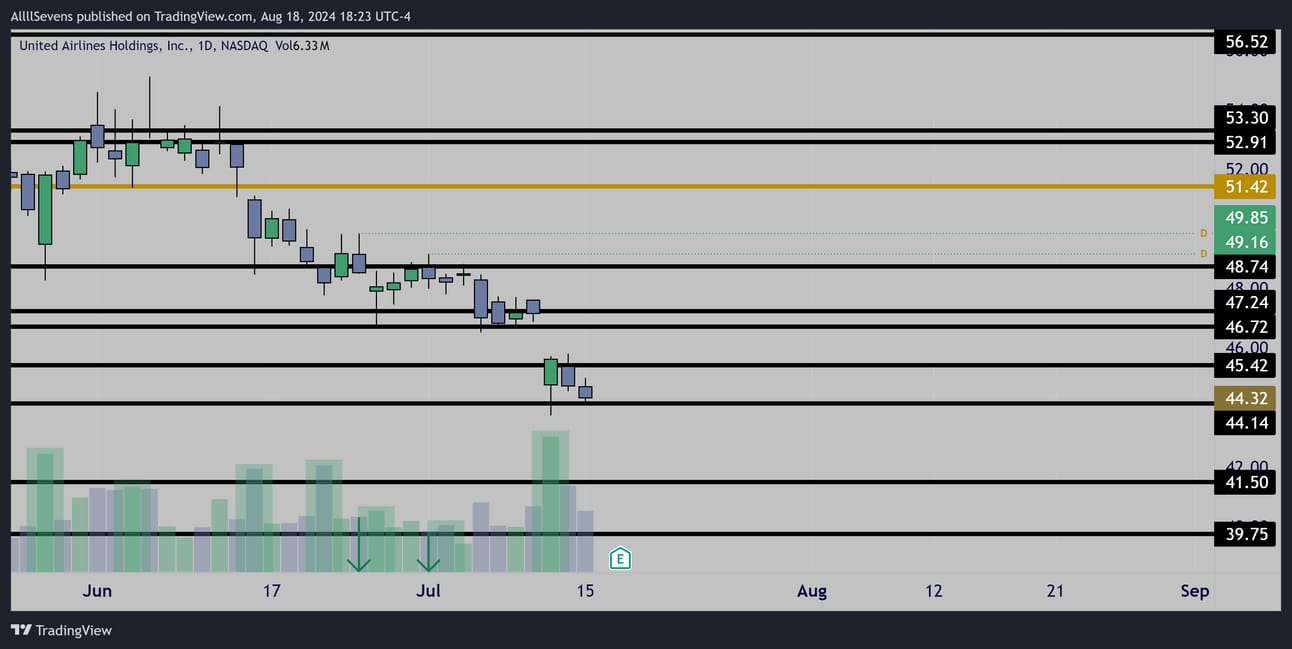
Daily Interval
It looks like accumulation has been occurring this entire multi-month pullback UAL has been experiencing.
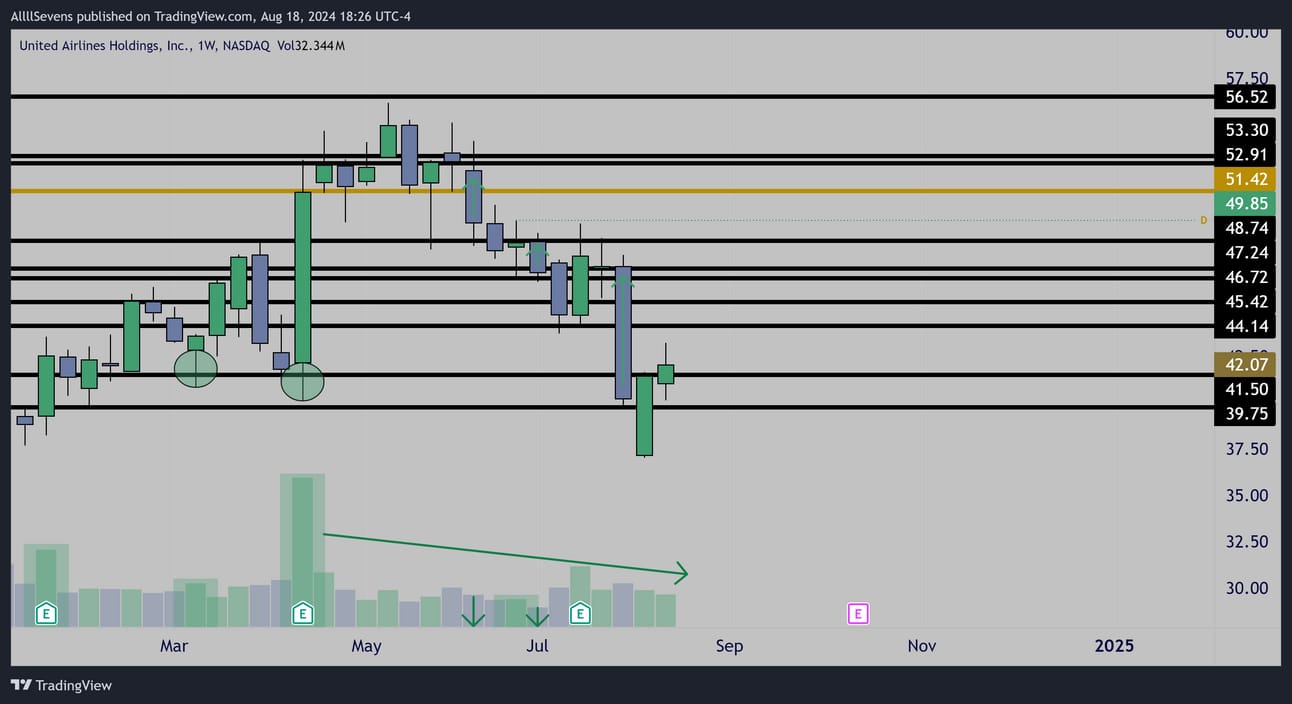
Weekly Interval
This $41.50 dark pool was the previous launch-pad in April
Since then, price has pulled back on notably LOW VOLUME
Notice the massive sell-off just two weeks go- it’s the second largest candle on the screen, yet there’s hardly any volume behind it.
Retesting a previous area f accumulation, I think there’s a great chance we see a bounce here.
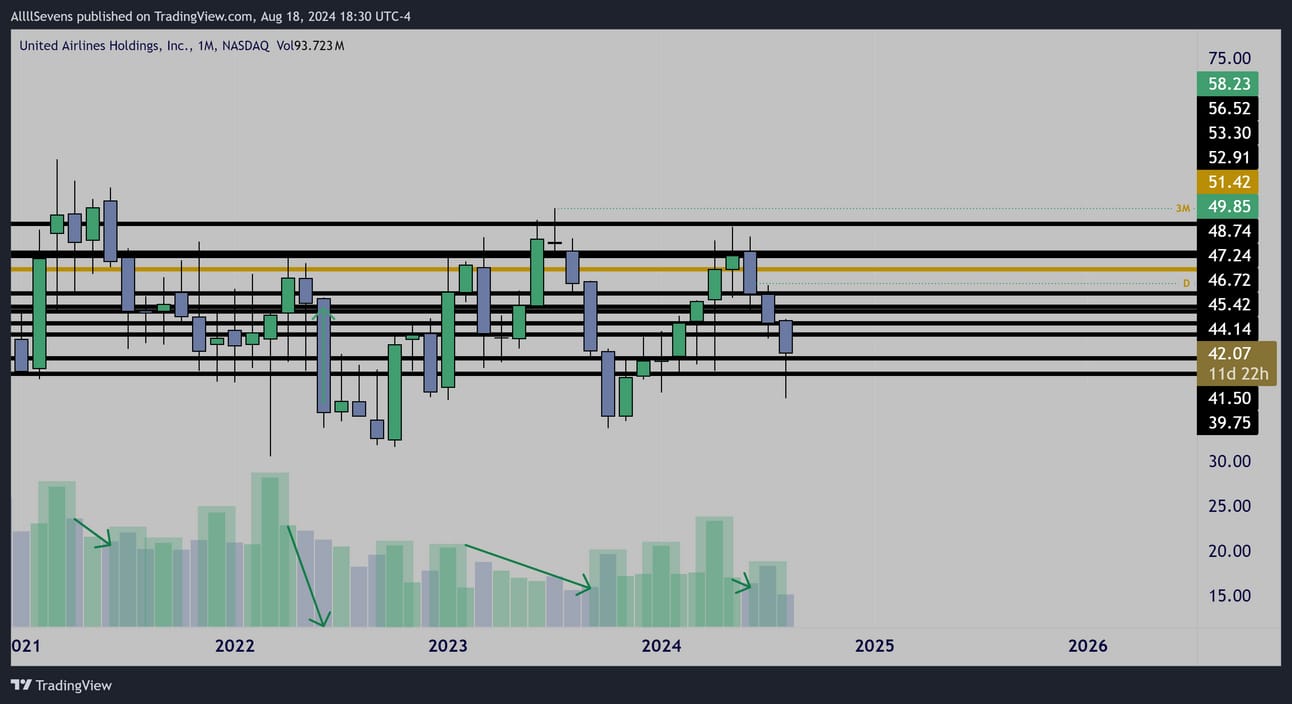
Monthly Interval
It looks like this has been accumulated for multiple years now.
Testing lowest dark pool support on record. Needs to hold here.
Best case scenario would be this month’s candle forming a tweezer bottom and reclaiming last month’s area of compression.
Notice last month’s candle was a small spread with increased volume showing buyers. For maximum momentum, that area gets reclaimed.
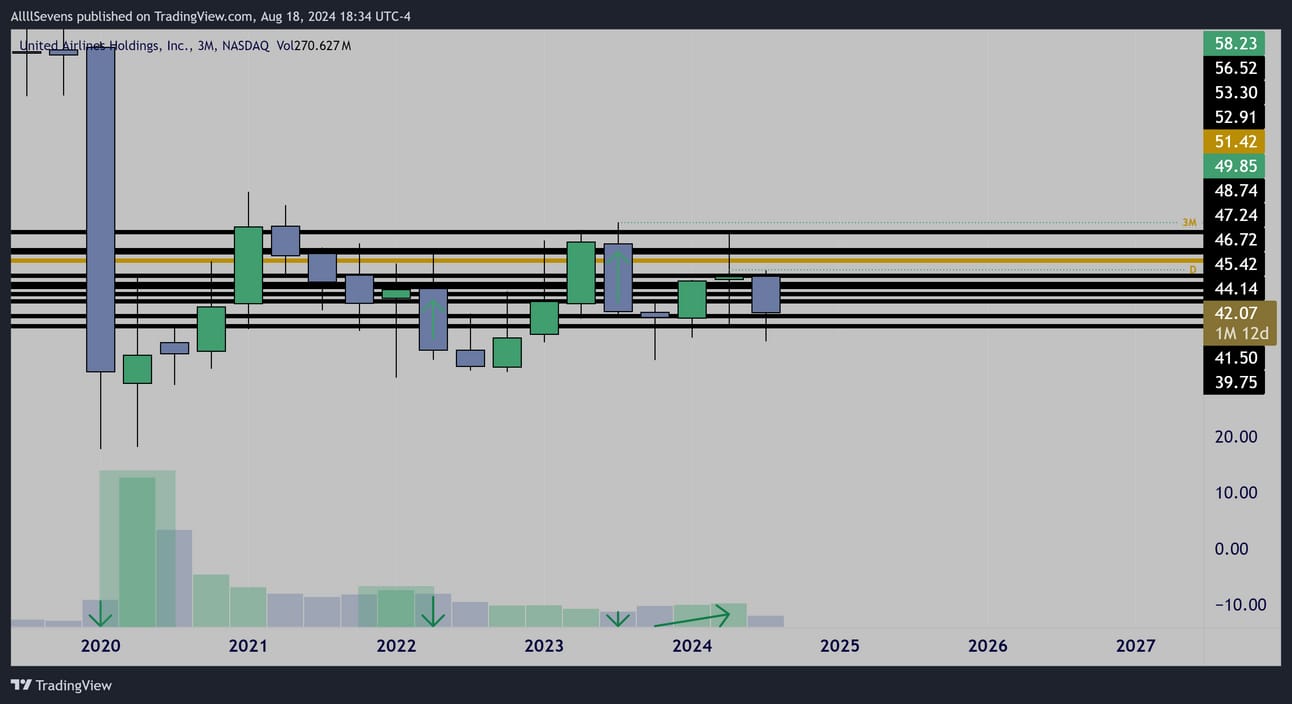
Quarterly Interval
Finally, when you we zoom out even further we can see that in 2020 this stock completely crashed and bottomed out on it’s highest volume since it’s 2006 IPO.
Just like the monthly, textbook accumulations are visible here.
I also notice the price range since the bottom is progressively getting tighter and tighter suggesting an expansion out of this compression is coming over the next few years.
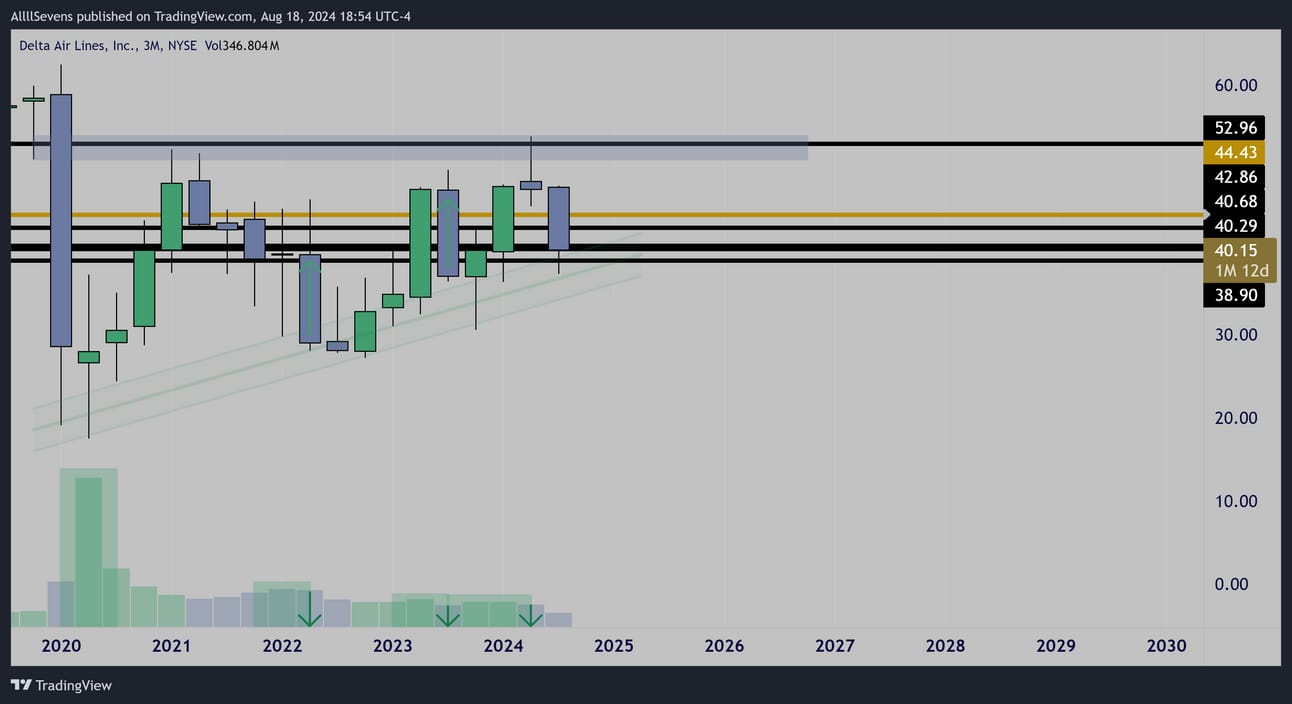
Notable Options Flow
$1.5M Bullish Flow for 8/30
$190K Bullish Flow for 10/18

$600K Bullish Flow for 9/20

$300K Bullish Flow for 12/20

$1.9M Bullish Flow for 12/18/26
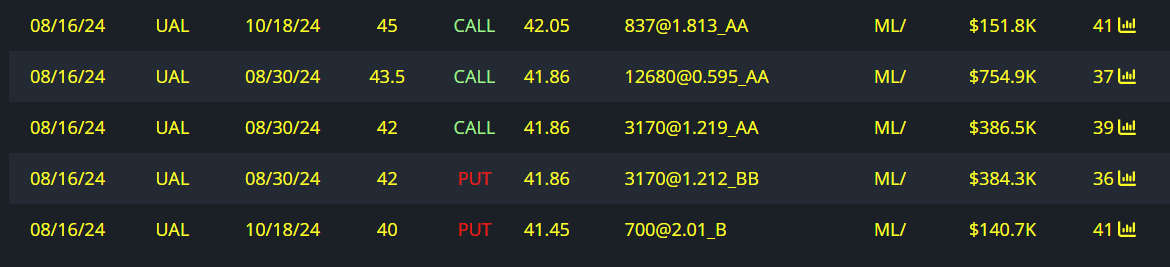
Side note-
Check out the entire airline sector. $JETS
Quarterly Interval
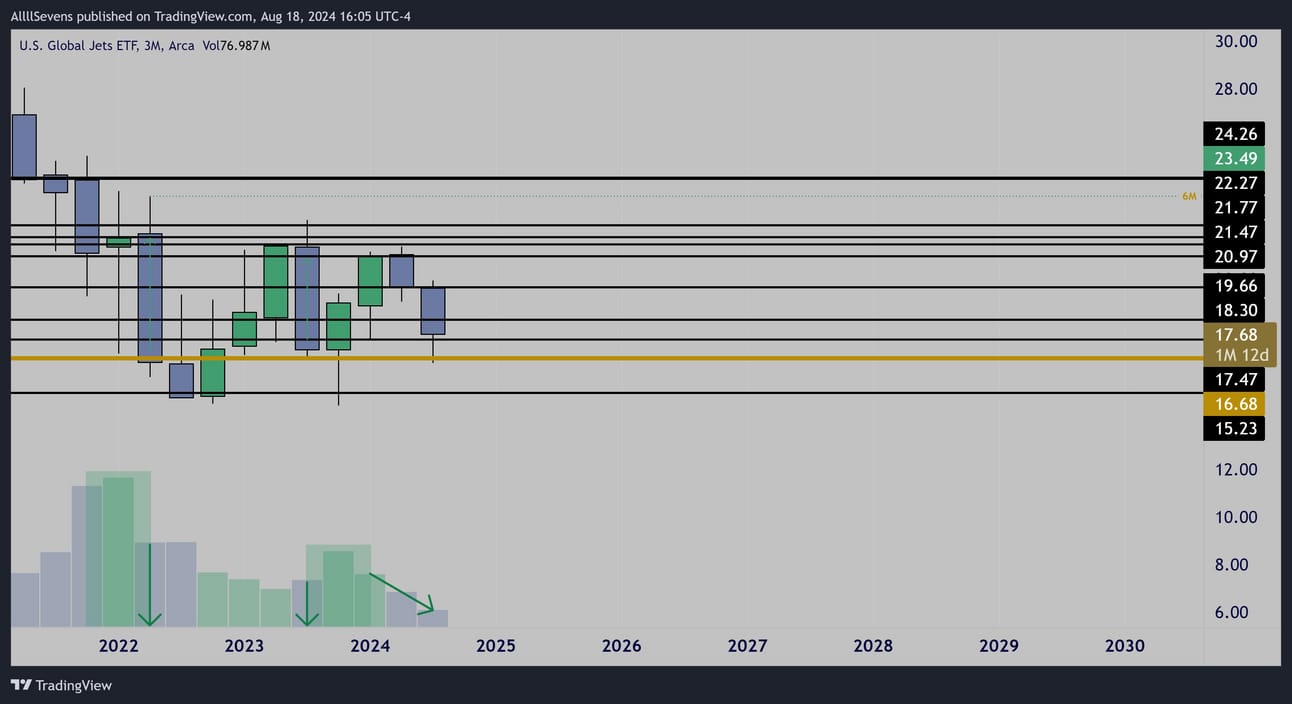
$DAL may actually be my favorite Airline-
Quarterly Interval
Daily Interval
Another side note-
Airlines are somewhat correlated with the Industrial sector which also happens to look great right now… More on that in a moment.
DE
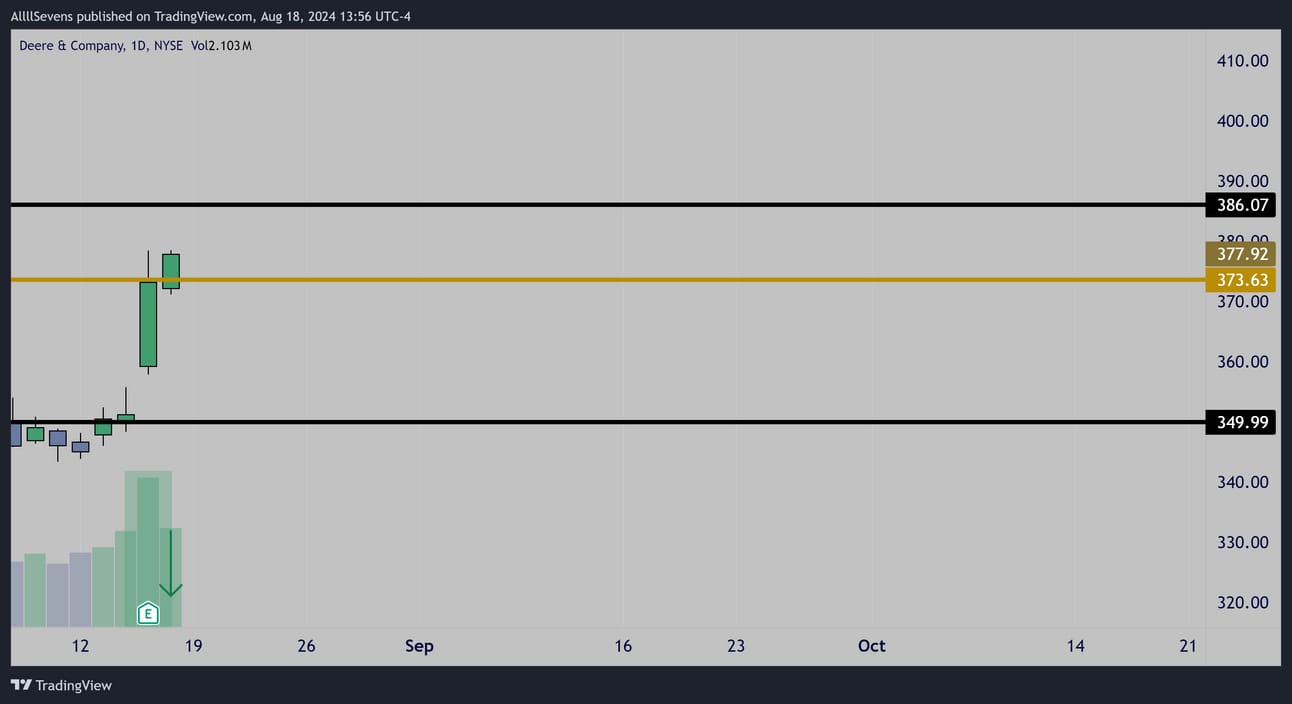
Daily Interval
‘PEG’ formation @ the stocks largest dark pool on record
Followed by a decreased volume inside candle over this level
If $373.63 holds, there’s a good chance to see continuation to $386.07
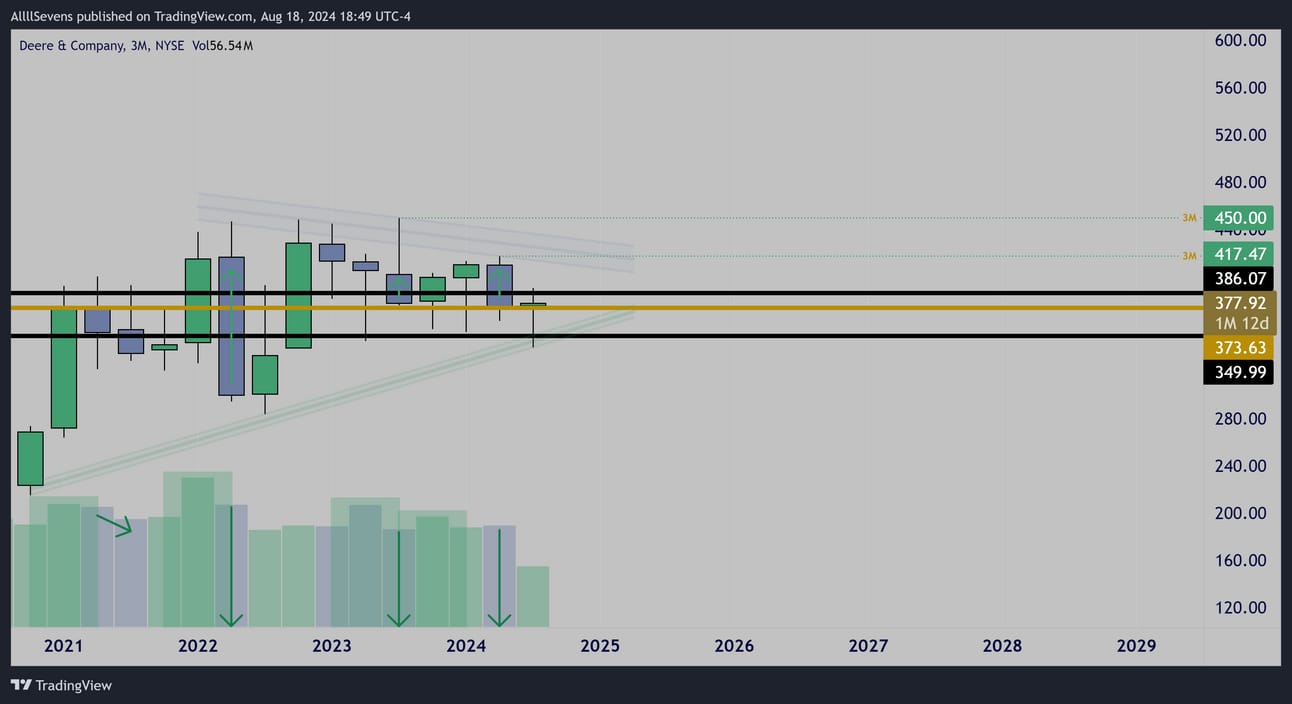
Quarterly Interval
Amazing accumulation patterns & price compression.
Currently attempting to hammer off it’s largest dark pool on record.
(gold level)
Notable Options Flow

$260K Call Buyer for 8/23
Overall, not a ton of flow on this name. Makes sense with general poor liquidity on the options for this ticker. I am more interested in the long-term potential on shares with a low / defined risk entry using this PEG
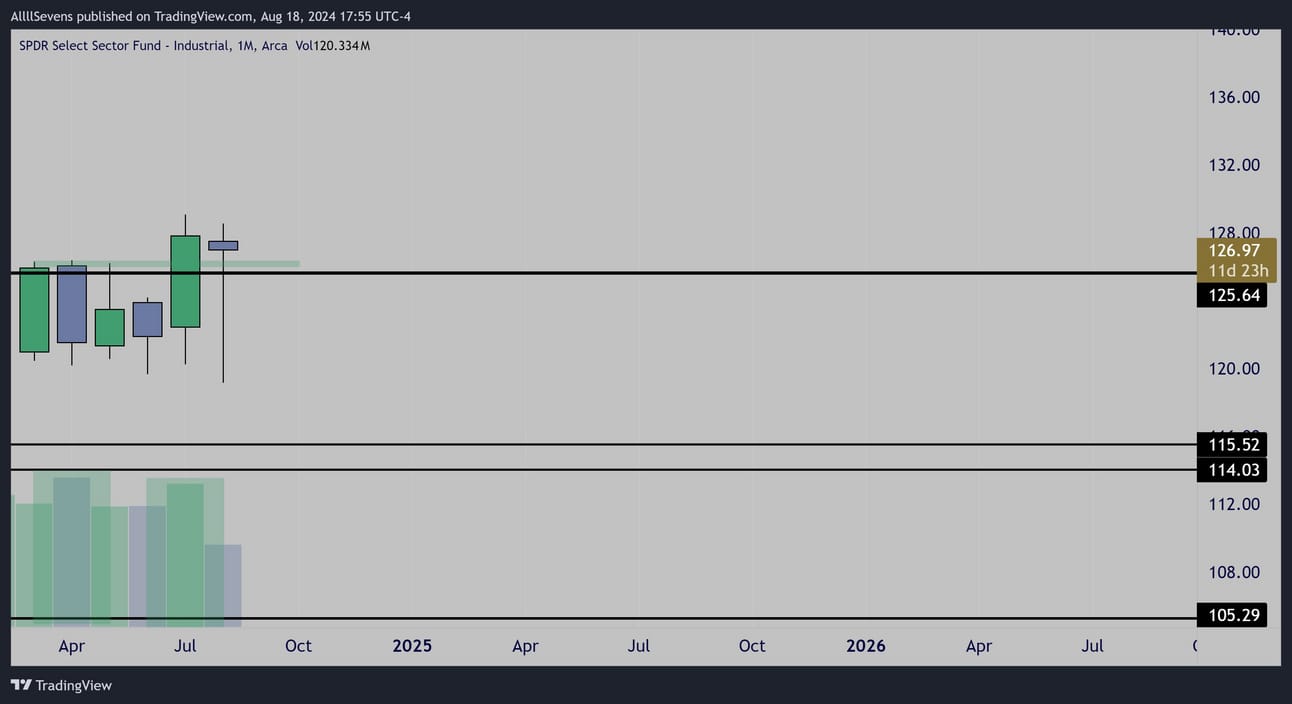
Side note-
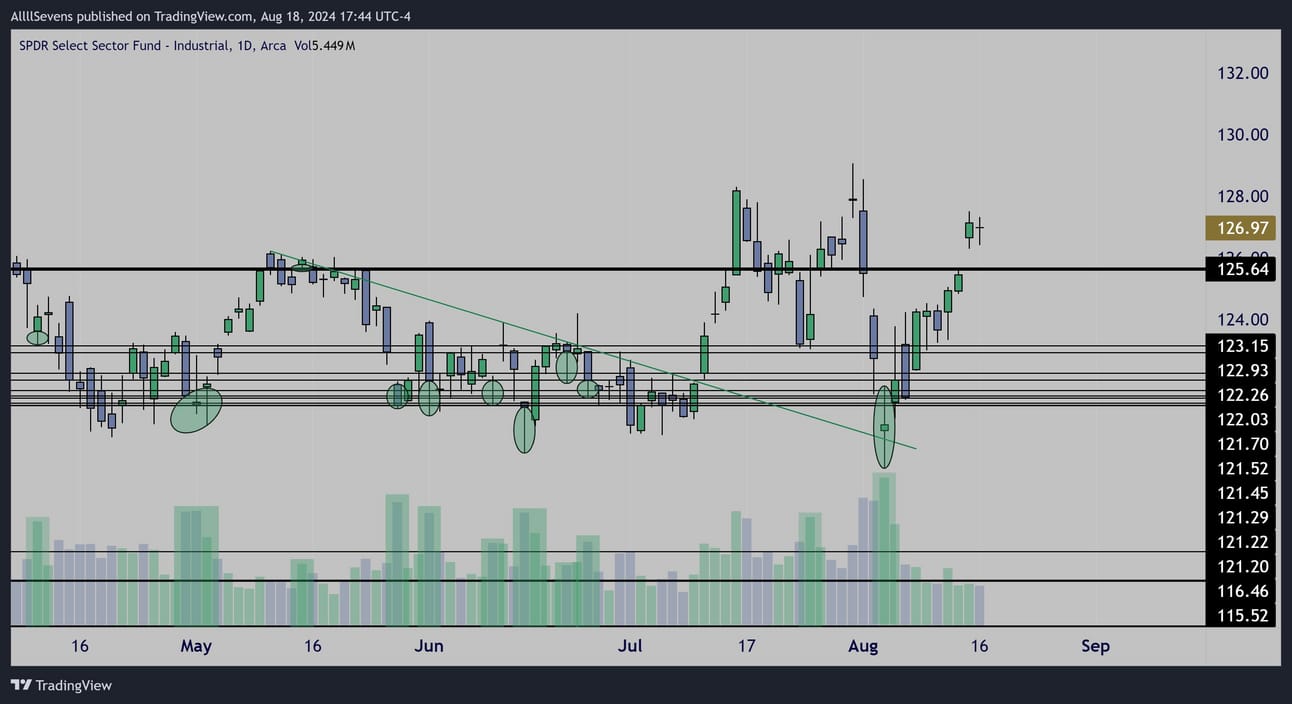
DE is in the industrial sector. $XLI
The XLI looks great right now, adding confluence to DE as well as the airline stocks mentioned above.
Monthly Interval
Daily Interval
DIS
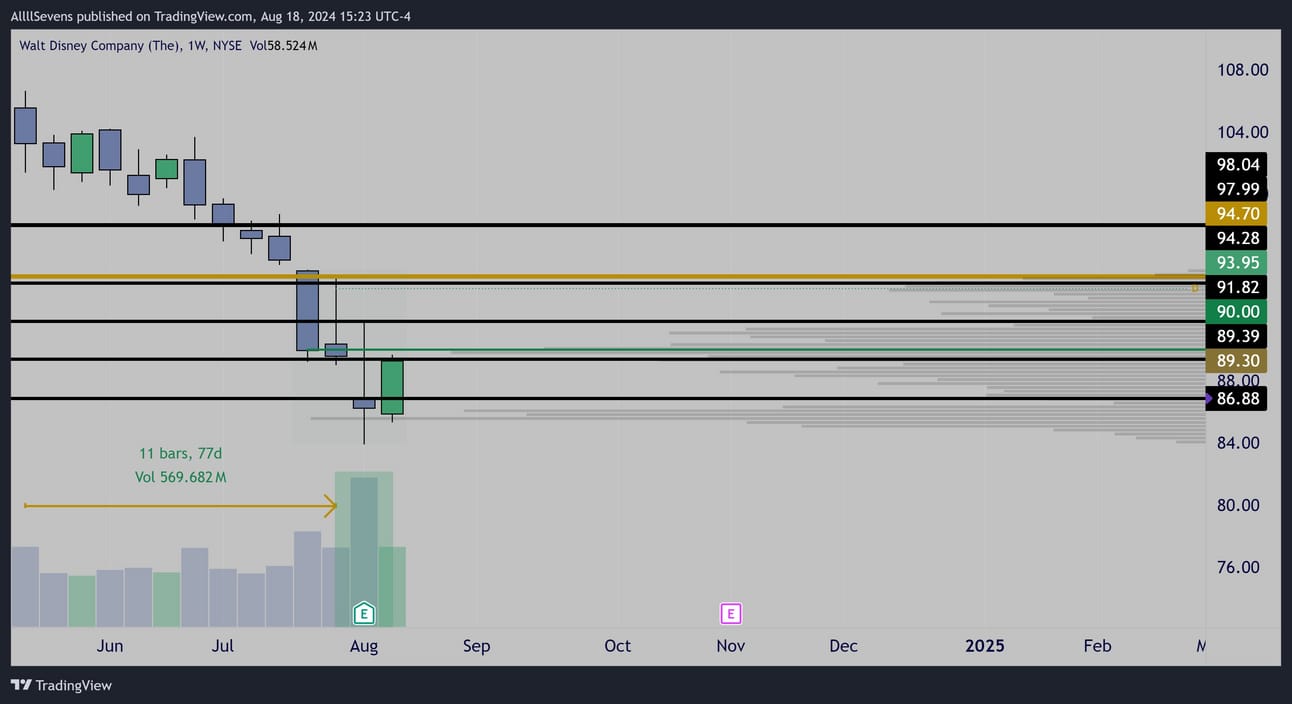
Weekly Interval
This past ER, $DIS announced that it’s streaming platform, Disney+ has FINALLY become profitable. This resulted in tons of volume pouring in to create an inverted hammer reversal pattern.
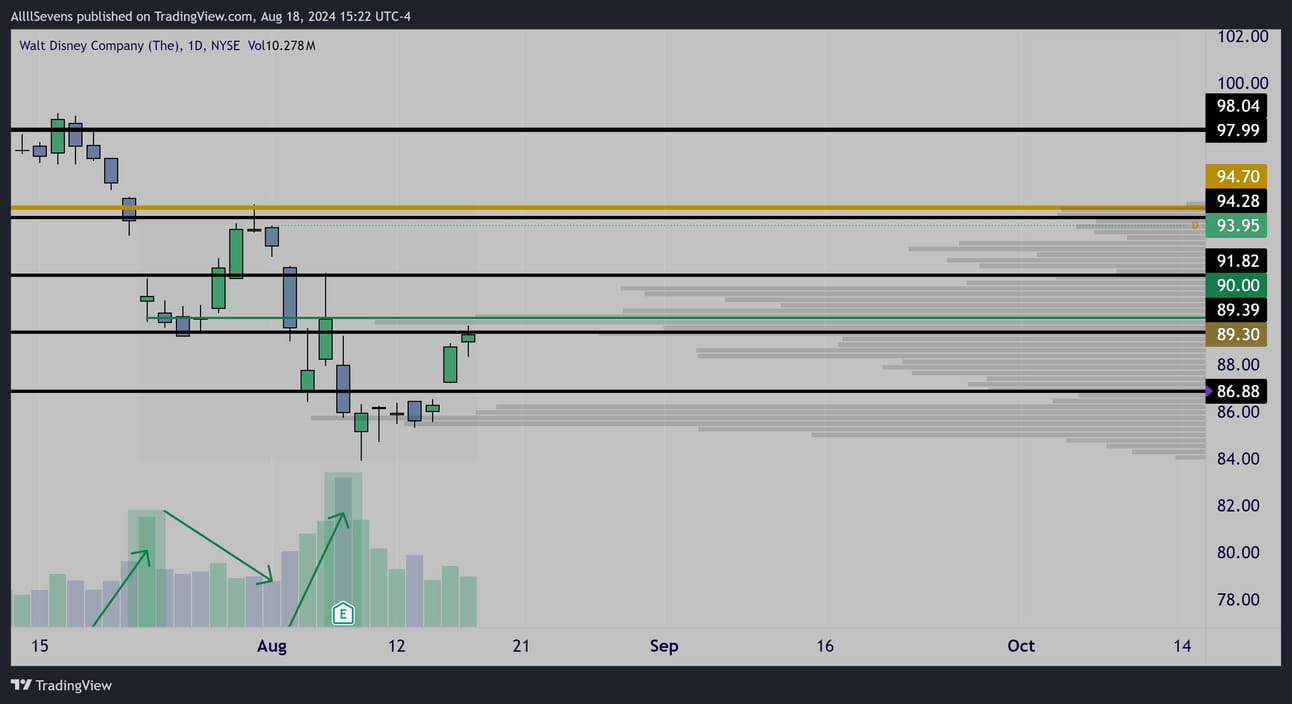
Daily Interval
The $90 level was accumulated in July and rejected the $94 dark pools on notable low volume leading to the ER “capitulation volume”
A reclaim of $90 should allow this to easily revisit and potentially break over the $94 resistance.
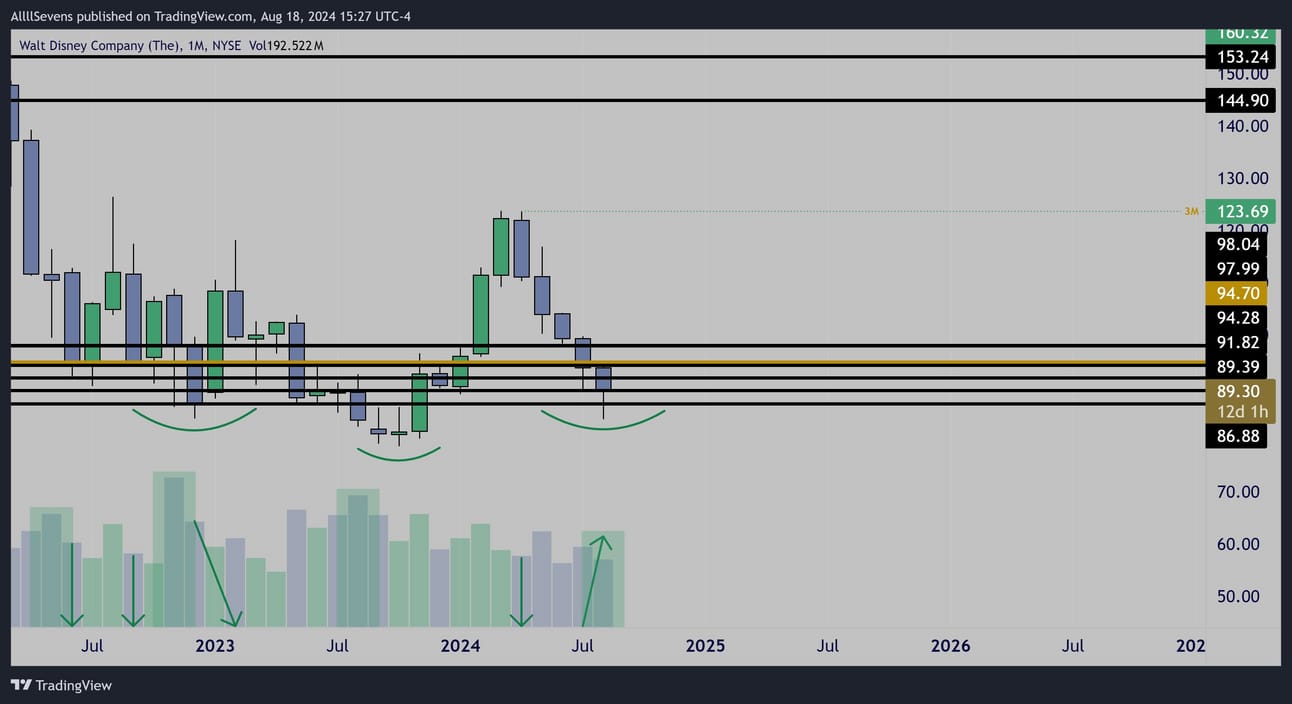
Monthly Interval
I think it is extremely important to zoom out here and note the potential long-term opportunity being presented.
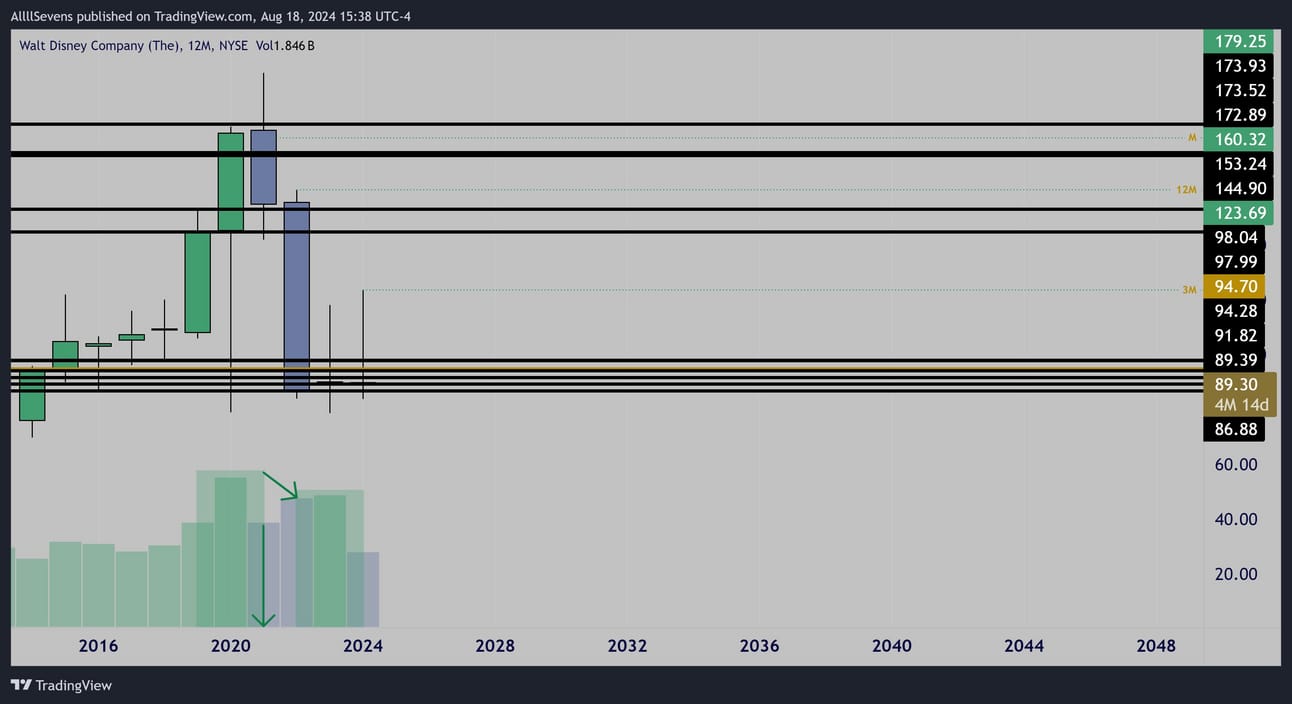
Yearly Interval
It appears this $90 dark pool cluster saw major accumulation during the 2020 “crash”
Then, in 2021 and 2022 it sold off on decreased volume, climaxing once again at the $90 demand, which on the month, displays continued accumulation patterns. Not only that, but an inverted H&S pattern for a potential upside reversal.
This month’s candle will surely display increased volume relative to last month- Best case scenario, it forms a hammer / tweezer bottom and reclaims last month’s levels very similar to what I suggested on UAL
This would lead to a reclaim of the largest DP on record @ $94.70 and truly confirm that a major low is being set on DIS stock.
Unsual Options Flow

$980K Call Buyer for November

$1M Insider Buy

$1.9M Bullish Order for October
This one came in a while ago, and the call side of the trade
is not doing great. Could these contracts recover?
Side note-
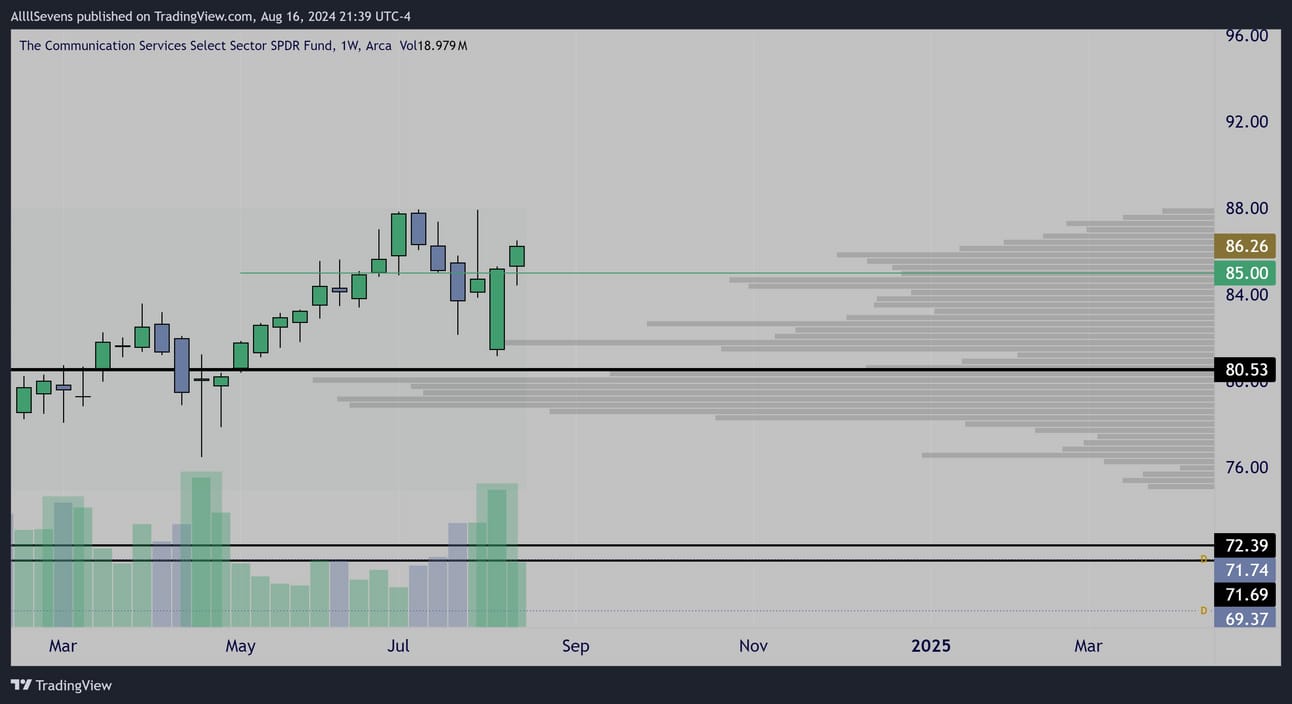
Weekly Interval
The XLC sector, which DIS can be categorized as, is one of the best looking sectors headed into next week.
Three very strong accumulations on the recent dips.
Last week, resting over $85 support in decreased volume potentially prepping for continued upside.
This adds confluence to two more charts, MTCH & CSCO which are also in the XLC sector.
CSCO
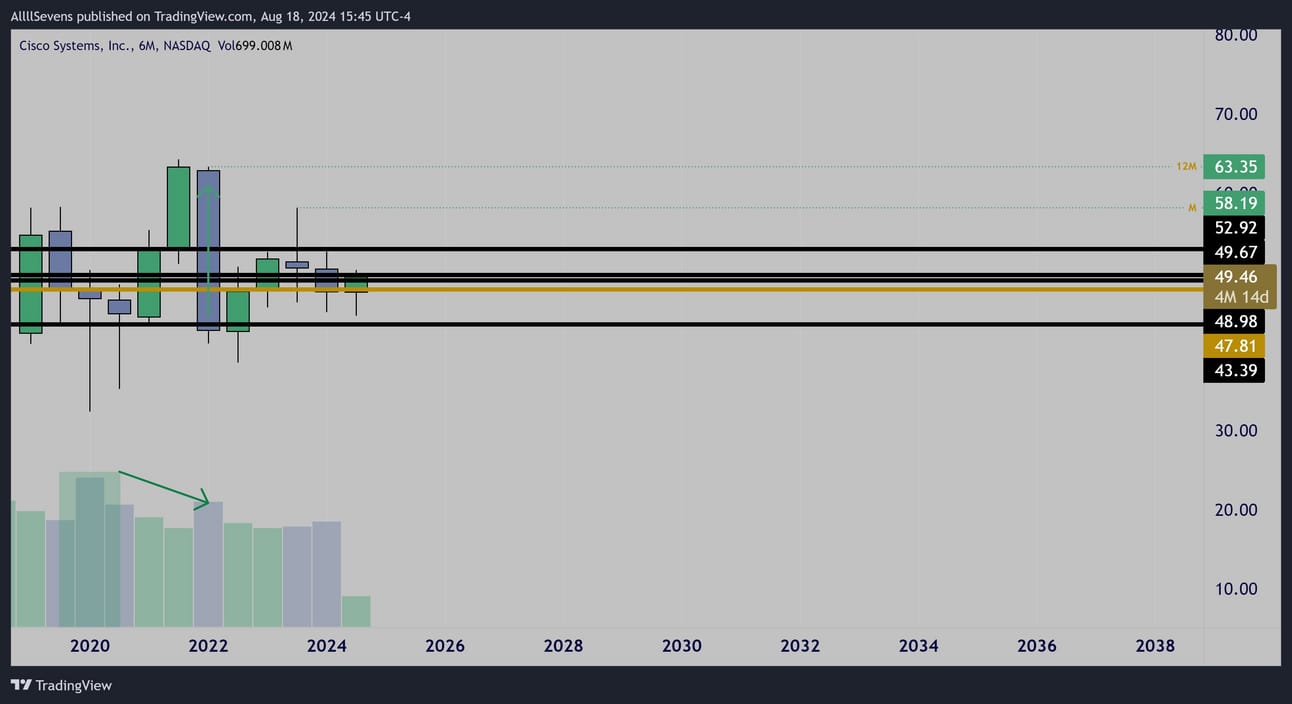
6 Month Interval
Major accumulation during the 2020 drop
Huge candle sell-off in 2022 backed by little volume
Leading to a multi-year price compression and potential higher low for a push back to ATH’s
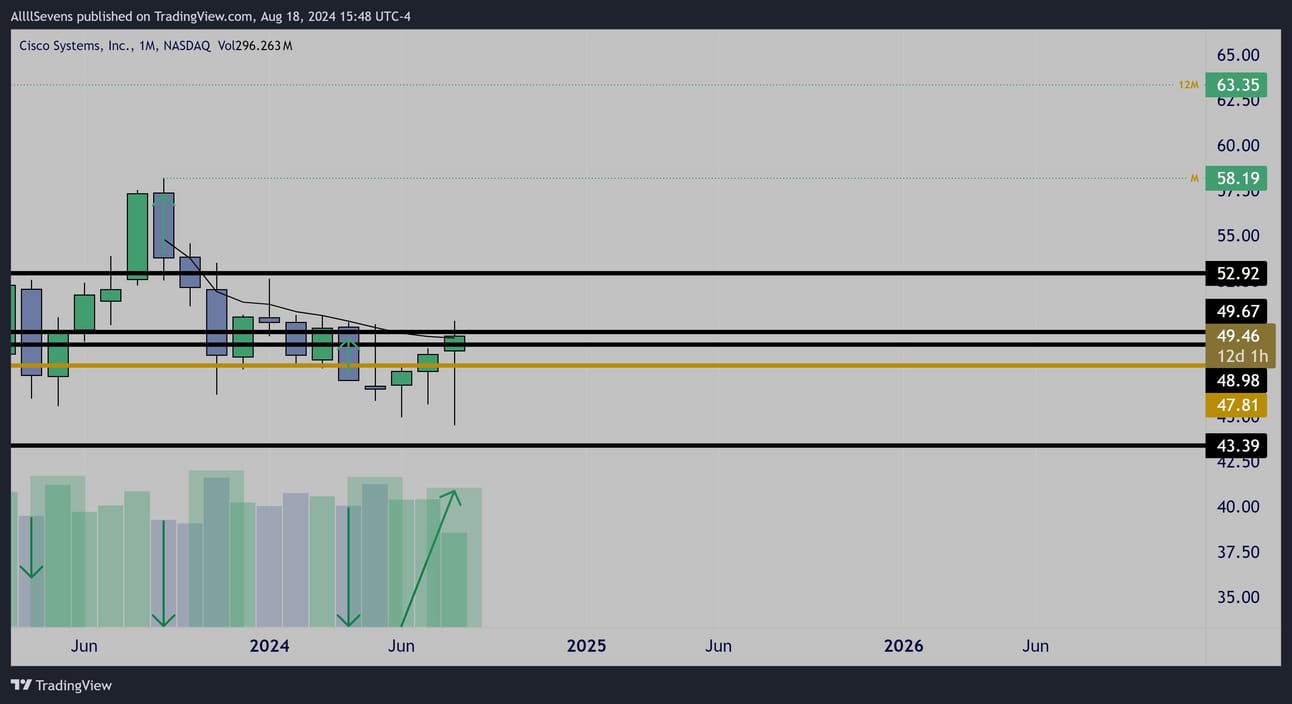
Monthly
A ten-month bull-flag with clear bullish volumes.
THIS MONTH’s candle could be making a statement.
Price hit it’s lowest point in almost two years earlier this month.
Then, a positive reaction to earnings occurred that now has the monthly candle attempting a bullish engulfing off the largest DP on record @ $47.81
If there was ever a time to breakout of this bull-flag it’s now.
Range to $52.92 at least.
It’s notable how low volume the September 2023 high is.
This adds conviction to the 6 month chart likely being able to break much higher over a long period of time.
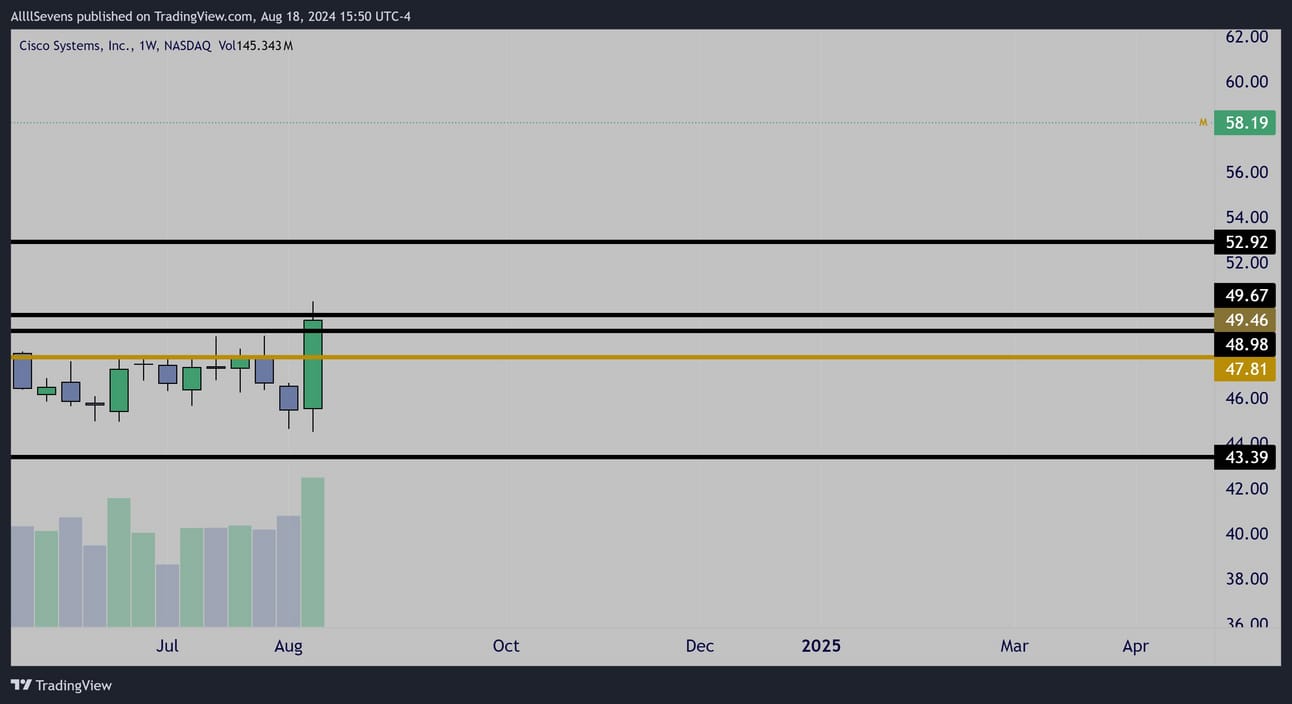
Weekly Interval
Massive volume bullish engulfing candle over largest DP on record.
$47.81 is what should be held if this monthly candle is going for the breakout.
Notable Options Flow

$1M Bullish Order for November

$200K Call Buyer for April
MTCH
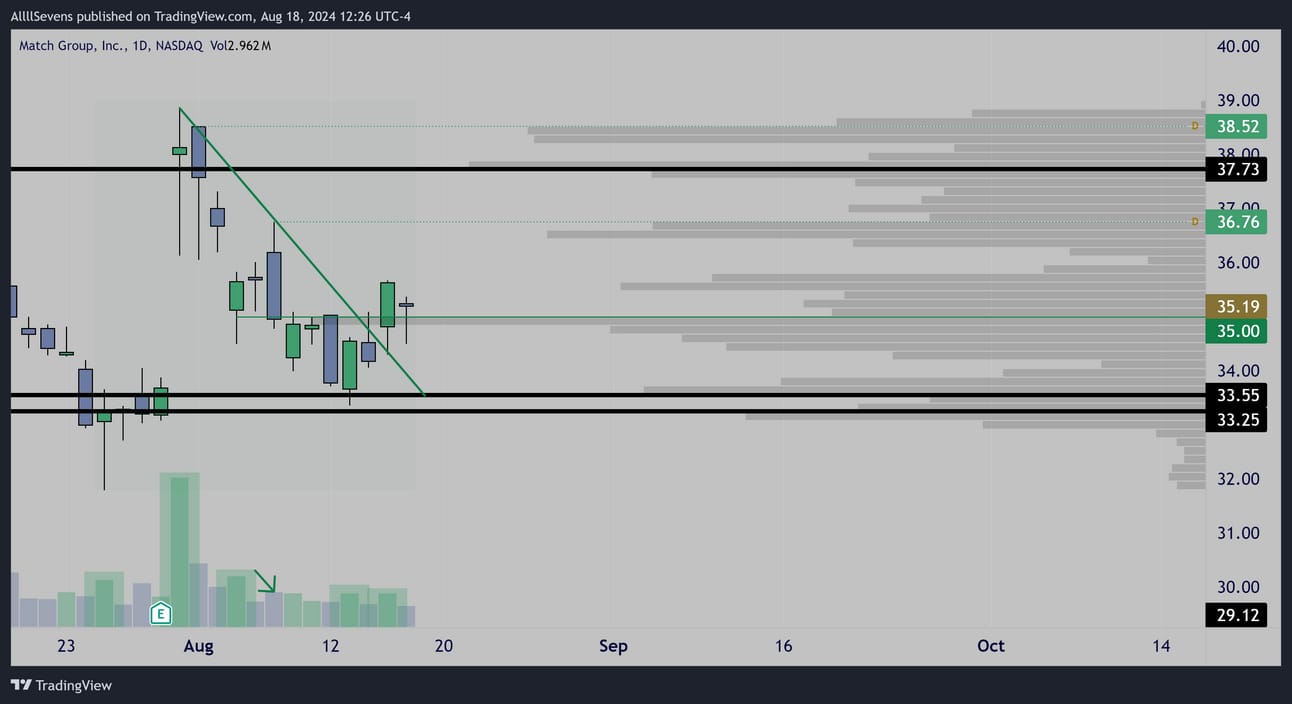
Daily Interval
‘PEG’ formation
Pulling back on decreased volume
Downtrend broke on increased volume
Low volume inside candle over VPOC
Primed for a push to $37.73 and likely higher if 35 holds
If $35 fails, can watch $33.25-.55 for buyers to step in
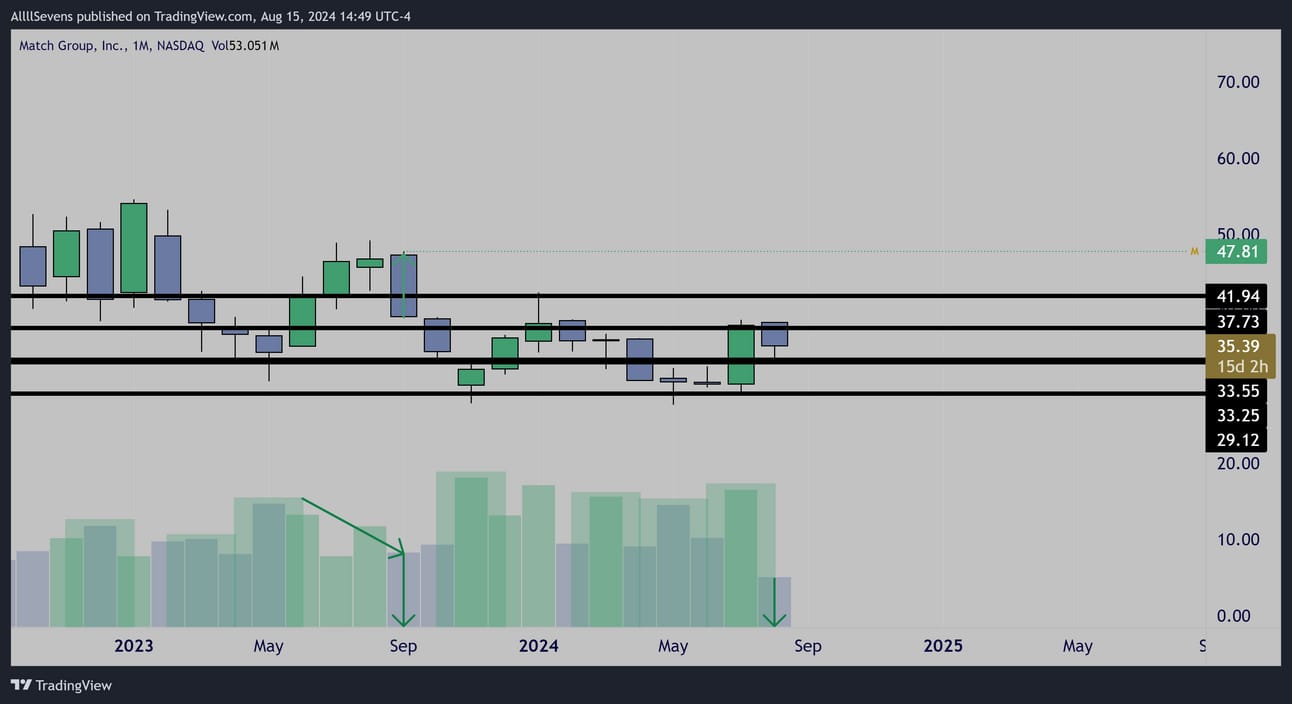
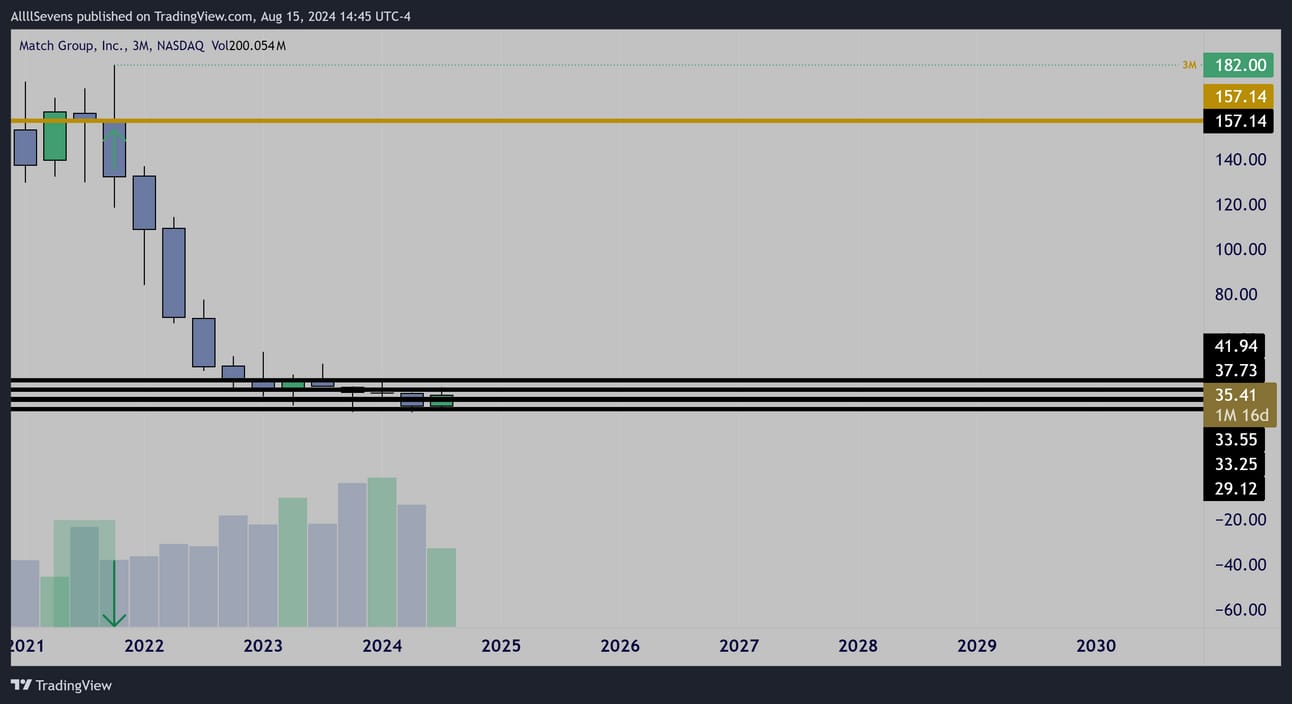
Monthly Interval
An absolutely stunning base has formed here over the last year.
Very clear accumulation patterns.
This month’s candle retesting support on low volume after a high volume bullish impulse last month.
Monthly Interval
These accumulation patterns on MTCH have been occurring for quite some time. A base this long with sch clear bullish volumes could result in a multi-year rally back into the $100’s
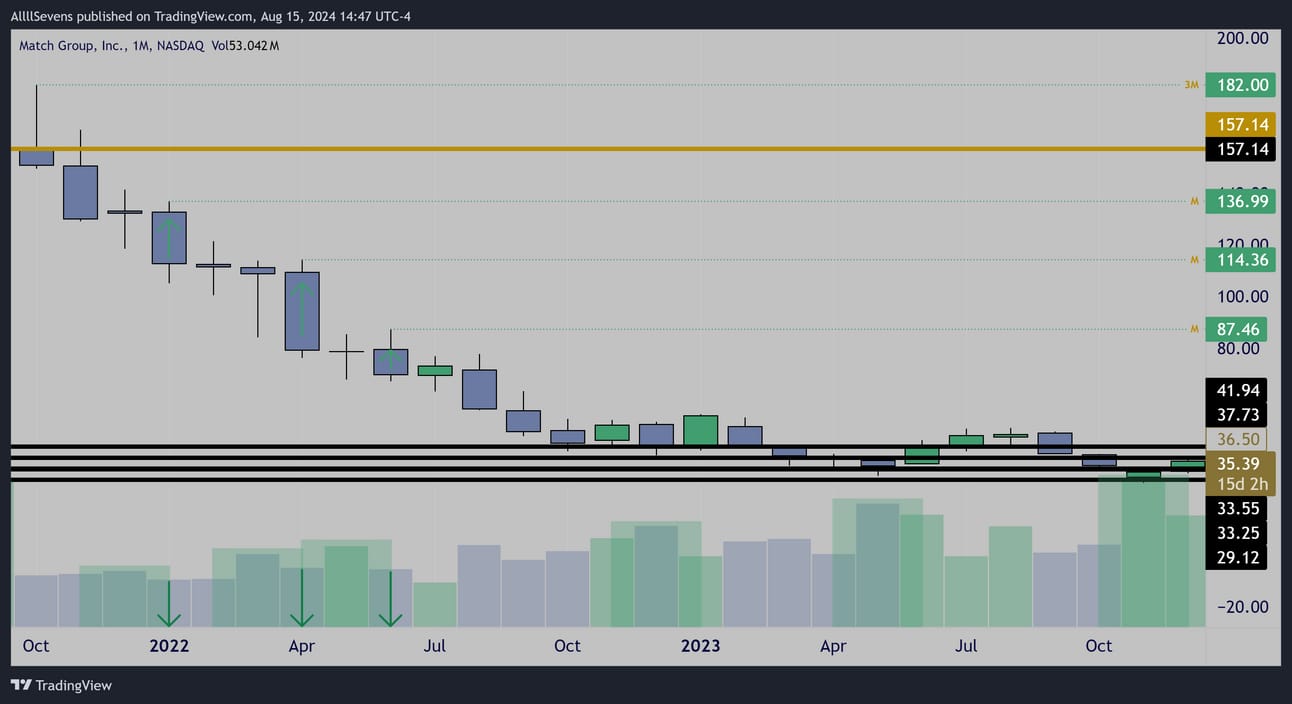
Quarterly Interval
I think the quarterly chart best displays the massive volume coming in at these levels over the last year.
The 6 month and Yearly charts also show increased volume and decreasing spreads as this area is tested.
Notable Options Flow

$400K Call Buyer for December
PYPL
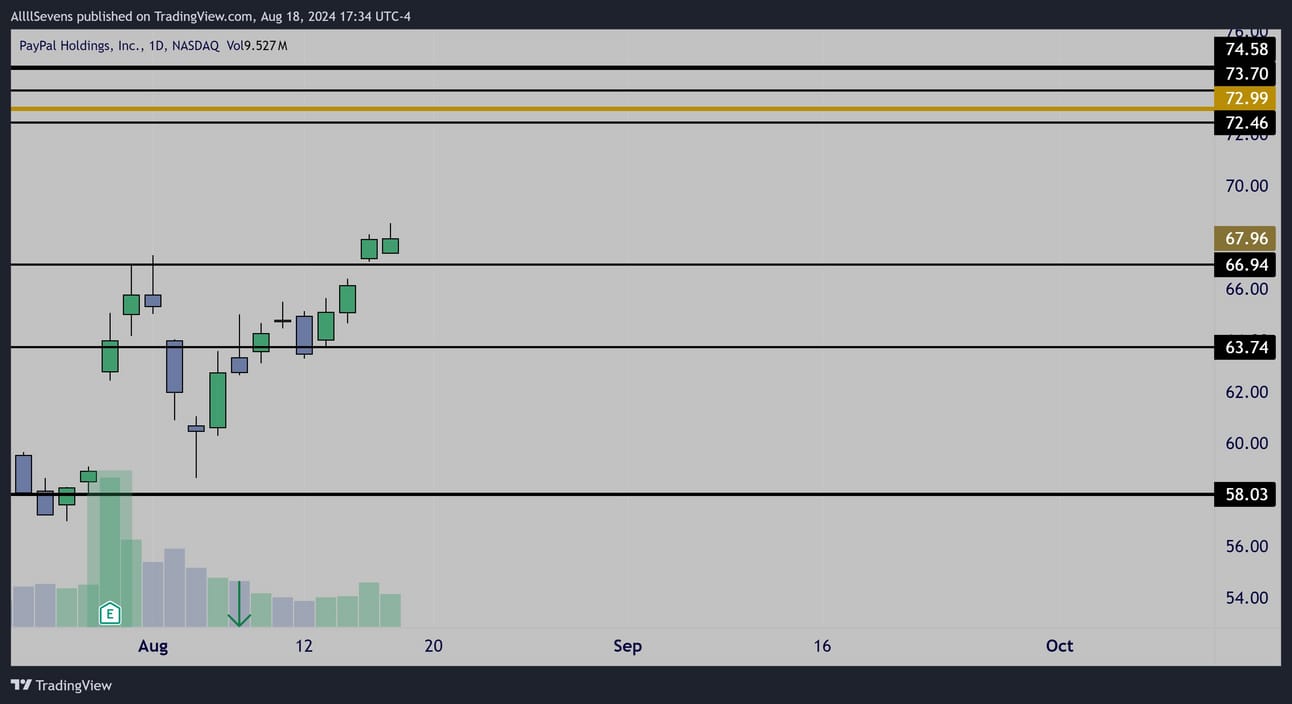
Daily Interval
‘PEG’ formation
Notable acceptance of the $63.74 dark pool
Could be a great level to use for risk on a long entry
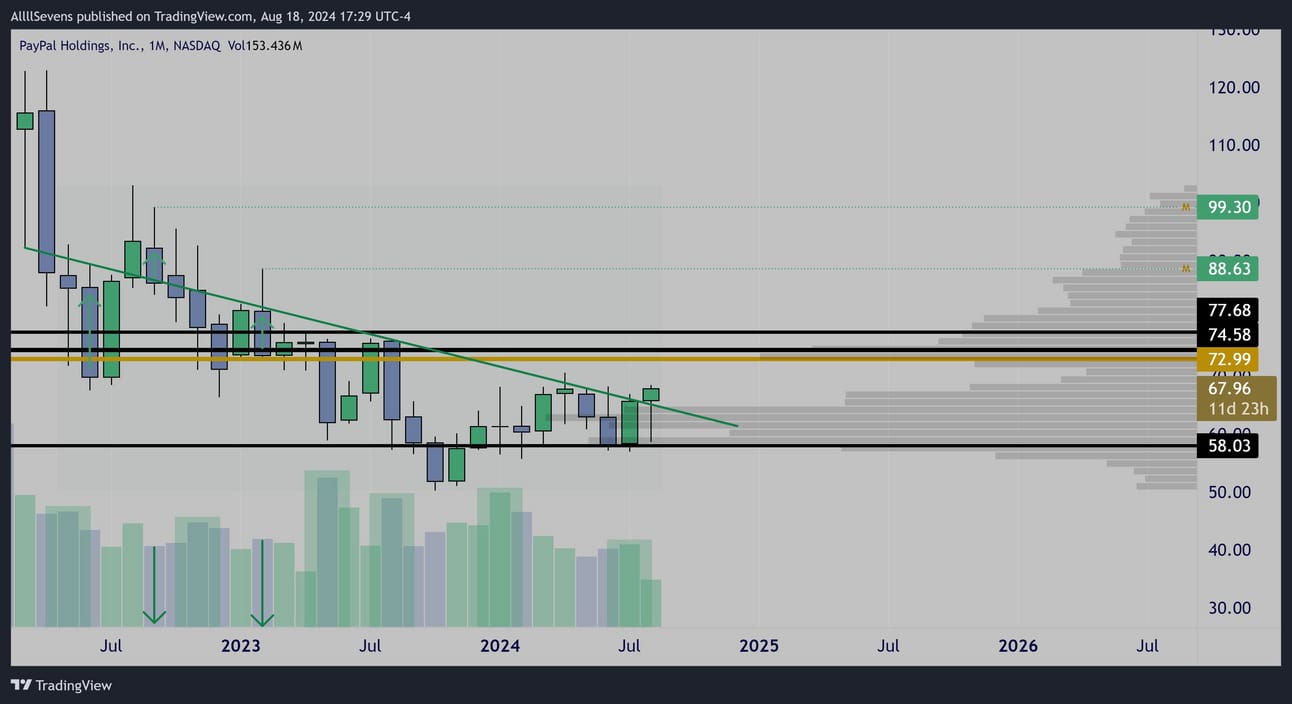
Monthly Interval
Absolutely textbook accumulation patterns
I have waited FOREVER to share my PYPL chart
This month’s formation is PERFECT
After last month’s bullish impulse over VPOC (volume shelf), price retested (this month) and held, now flipping green and giving range directly to $73
Remember, this is a retest and bounce off VPOC inside a Daily PEG
This is a truly incredible candle formation.
Unusual Options Flow
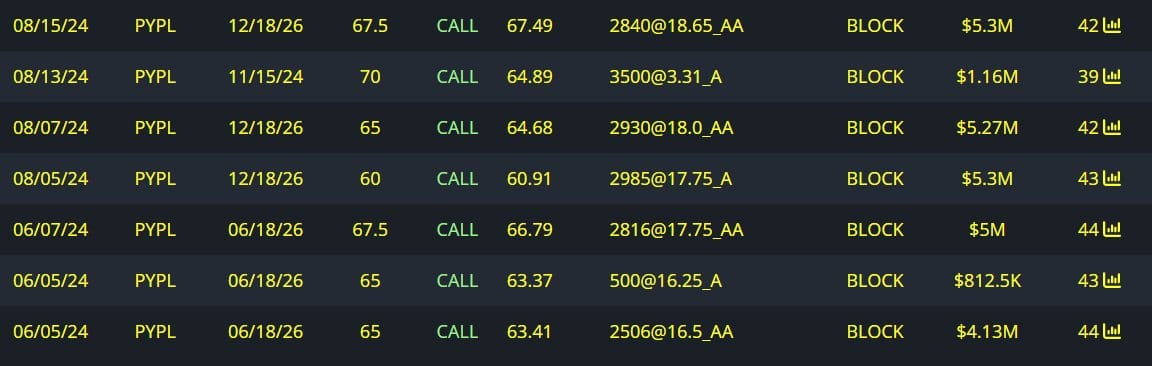
$26M Call Buyers for various LEAP expirations
Also a November Call Buyer
U
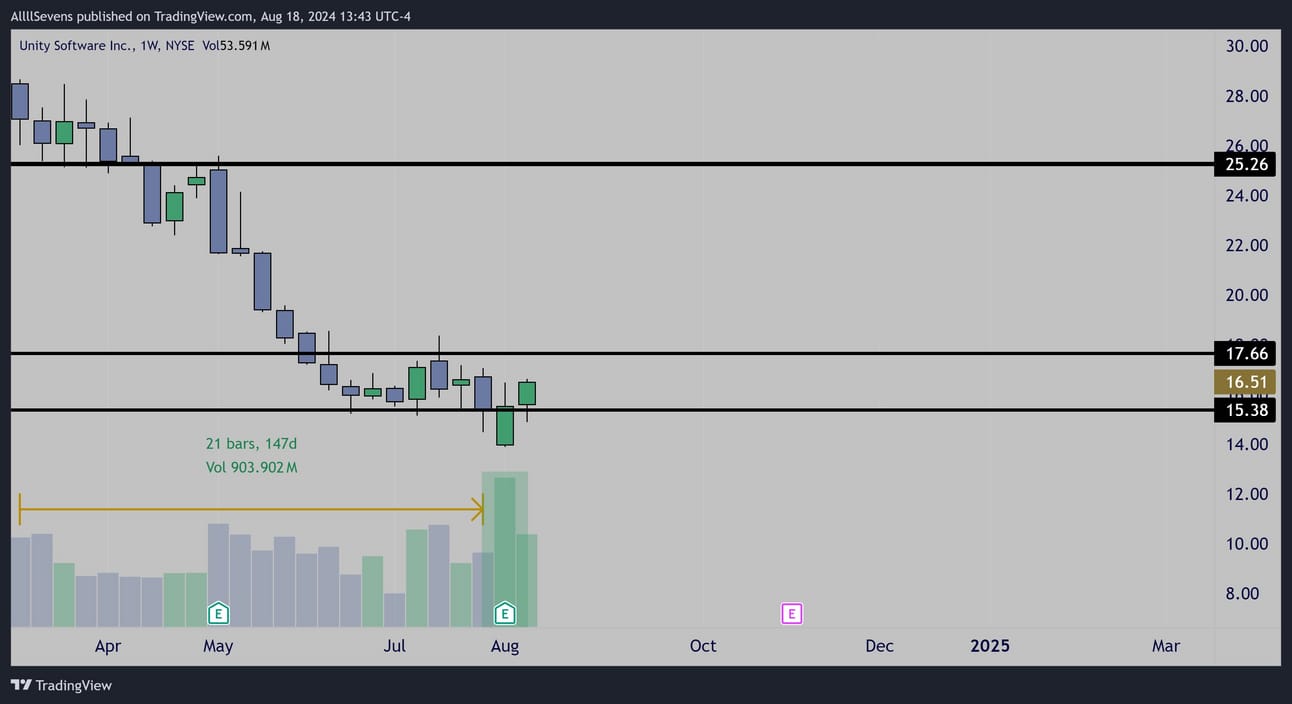
Weekly Interval
Highest volume in over 20 weeks climaxing off of a positive earnings reaction- A Daily PEG is also formed here.
Following this, is a decreased volume inside candle over support.
Perfect for a potential upside break over the next week or two.
Also notable, is these $15.38 & $17.66 dark pools are very recent.
Institutions are active.
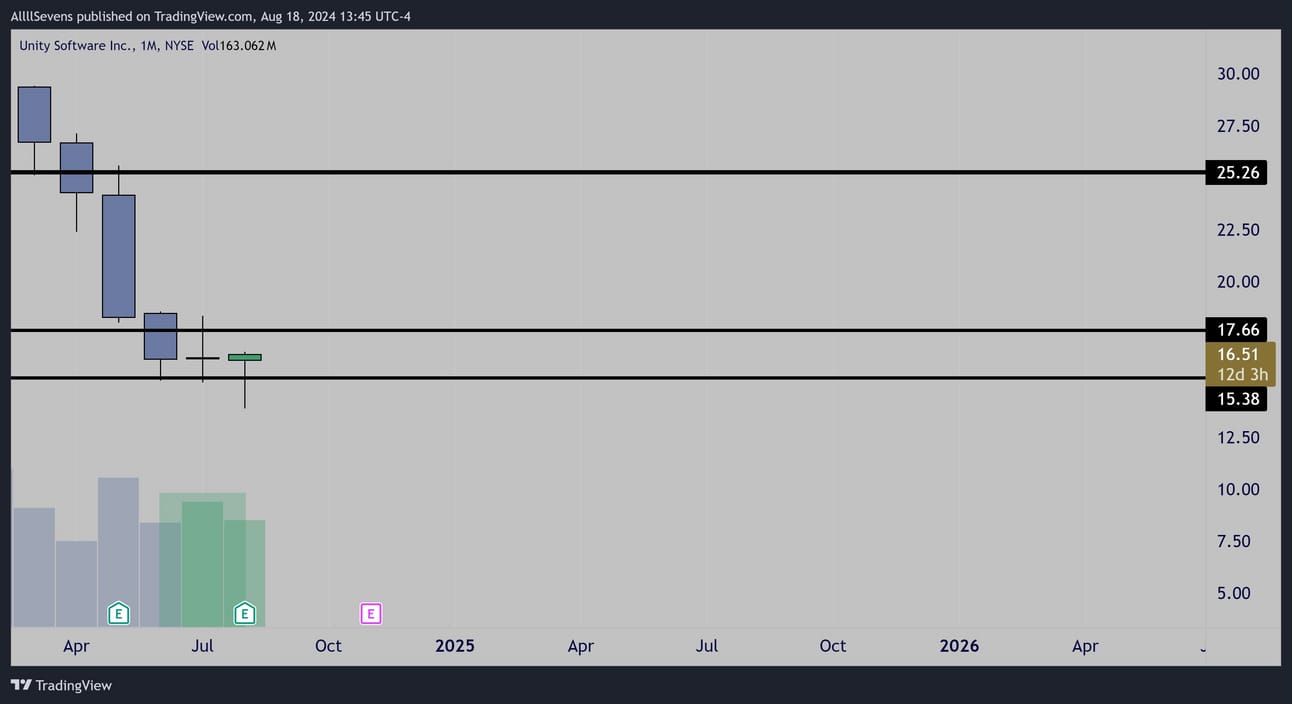
Monthly Interval
This is where I become extremely convicted that $U is going to see upside in the coming weeks.
This weekly climax & daily PEG formed on a sweep of last months low…
Last month was an increased volume inverted hammer off $15.38
ANOTHER bullish pattern
With this month’s candle having swept lows after a reversal pattern last month + weekly climax daily PEG it makes me very confident that this month’s candle can bullish engulf.
If this month can bullish engulf and fully reclaim $17.66, this could see a push back to $25 over even more time. Hopefully, a further base forms before that type of move occurs and I will write another newsletter specifically dedicated to $U with large bull flows active.
Right now, there is not a ton of bull flow.
Weird, because the setup is amazing.
I figure if I am right about this month’s candle, there will be some kind of base over $17.66 where more bull flows will execute.
Unusual Options Flow

$250K Call Buyer for November

$200K Call Buyer for June
I can hardly put into words how much I appreciate you taking your extremely valuable time to reading my newsletter.
If you found value,
Make sure you’re subscribed for my next newsletter!
This was a WEEKLY NEWSLETTER
I will also be writing “spotlight” newsletters dedicated to specific stocks, ETF’s, or sectors in the future.
Follow me on 𝕏/Twitter @SevenParr
If you really really like my work-
Upgrade your subscription to AllllSevems+ for just $7.77 per month
I will occasionally send a premium newsletter & you will also get access to my Discord where I gather and collect my data throughout the week.
Overall, premium is just a way to show your support.
It’s cheap for a reason. Most of the value I provide is for free.
This is just a way to give back!
If you’re interested in tracking dark pool data and unusual options flow yourself, here’s my affiliate link for BlackBoxStocks, the platform I use:
http://staygreen.blackboxstocks.com/SHQh
If you like how my charts look, here’s my affiliate link for Trading View, the platform I use:
https://www.tradingview.com/pricing/?share_your_love=sevenparr
Feel free to DM me on twitter for the colors I use.
Lastly, if you’re looking for a Brokerage to trade stocks & options, here’s my referral link for Webull. They give you (and me) free stocks when you make an account and deposit money with this link:
https://a.webull.com/Nwcp9cTCDSzfJtjWL4
Reply