- AllllSevens
- Posts
- Weekly Newsletter
Weekly Newsletter
Understanding the potential for a continued bear market, but also acknowledging the unprecedented long-term buy opportunity in front of me that cannot be ignored.
Seven Parr
April 27, 2025
Disclaimer
This newsletter presents my technical analysis and insights for informational purposes only. It is not financial, investment, or trading advice, nor is it a recommendation to buy, sell, or hold any asset. I am not a licensed financial advisor.
All content reflects my own personal opinions based on publicly available data as of April 27th, 2025. I am not liable for any losses incurred by others.
Preface:
The horizontal lines on my charts represent dark pool transactions, marking institutional volume shelfs / points of control, marked with approximate notional values on the right hand side. These levels serve as a critical tool to gauge the level of institutional investment in any asset, guiding my investment and trading decisions with data-driven insights.
S&P500
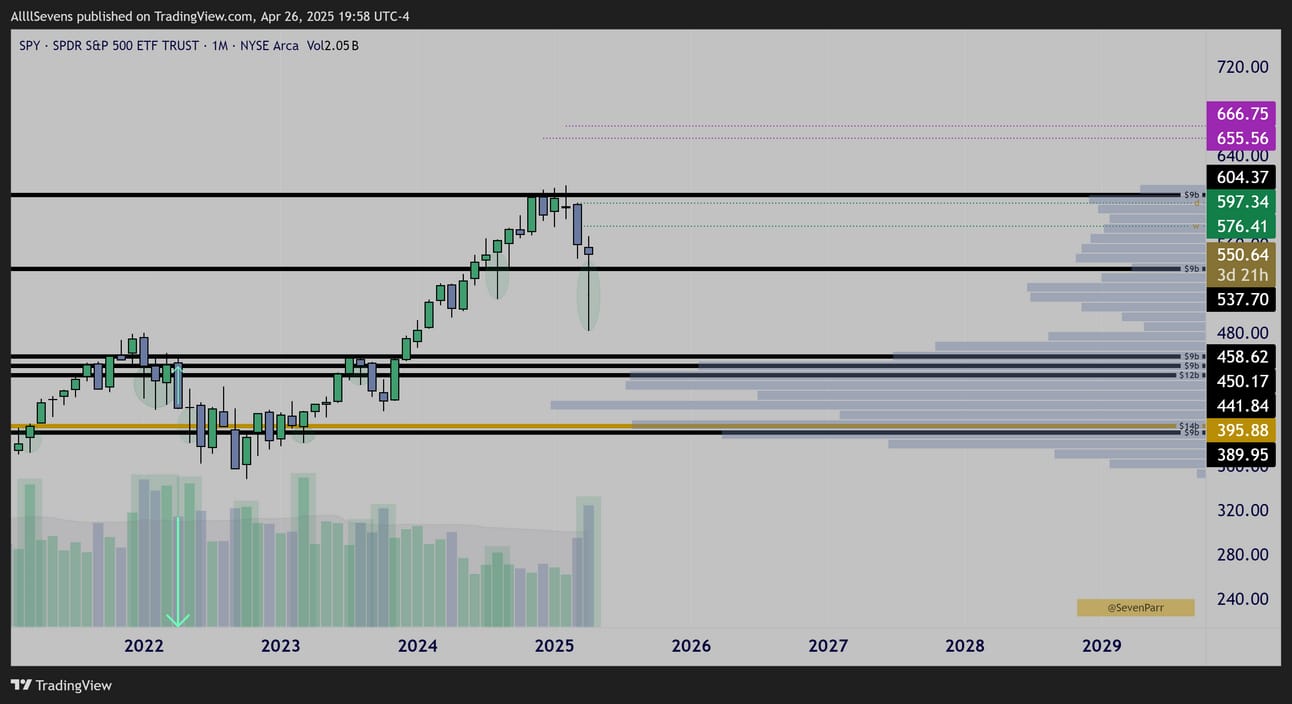
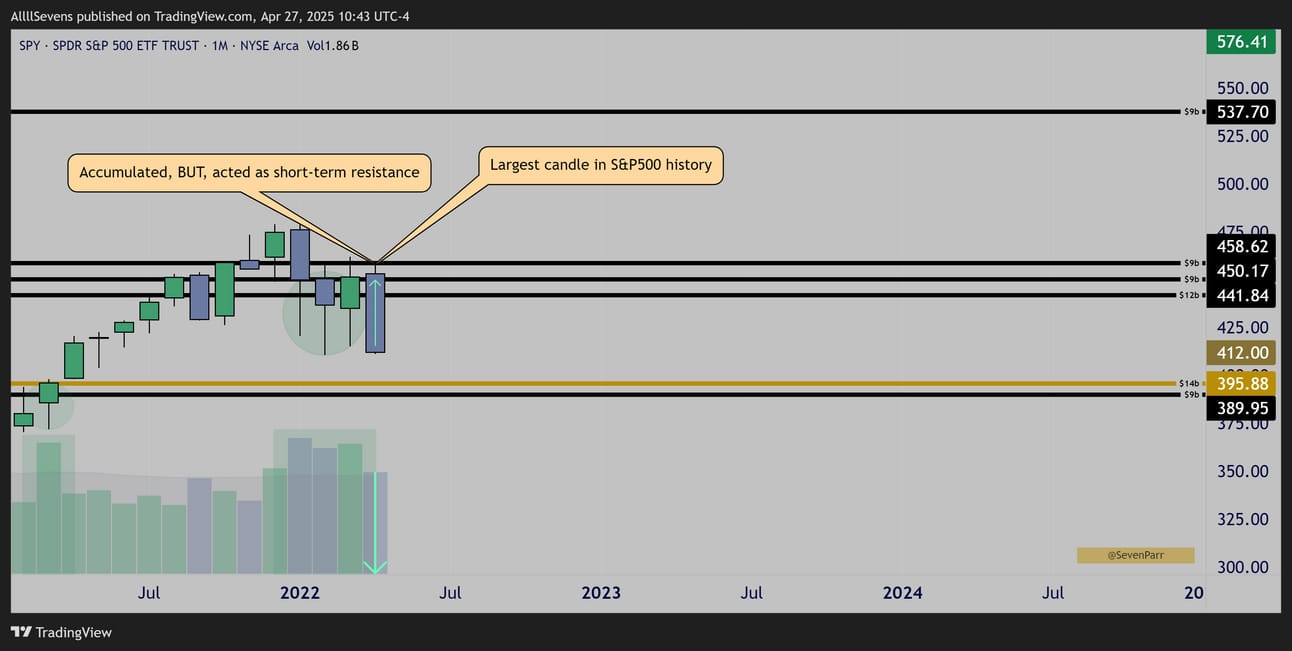
$SPY ( ▲ 0.45% ) Monthly Candles
The stock market is being accumulated by institutional investors to a degree unseen since the 2022 bear market. In fact, I’m going to argue they’re buying substantially MORE than they did during that period.
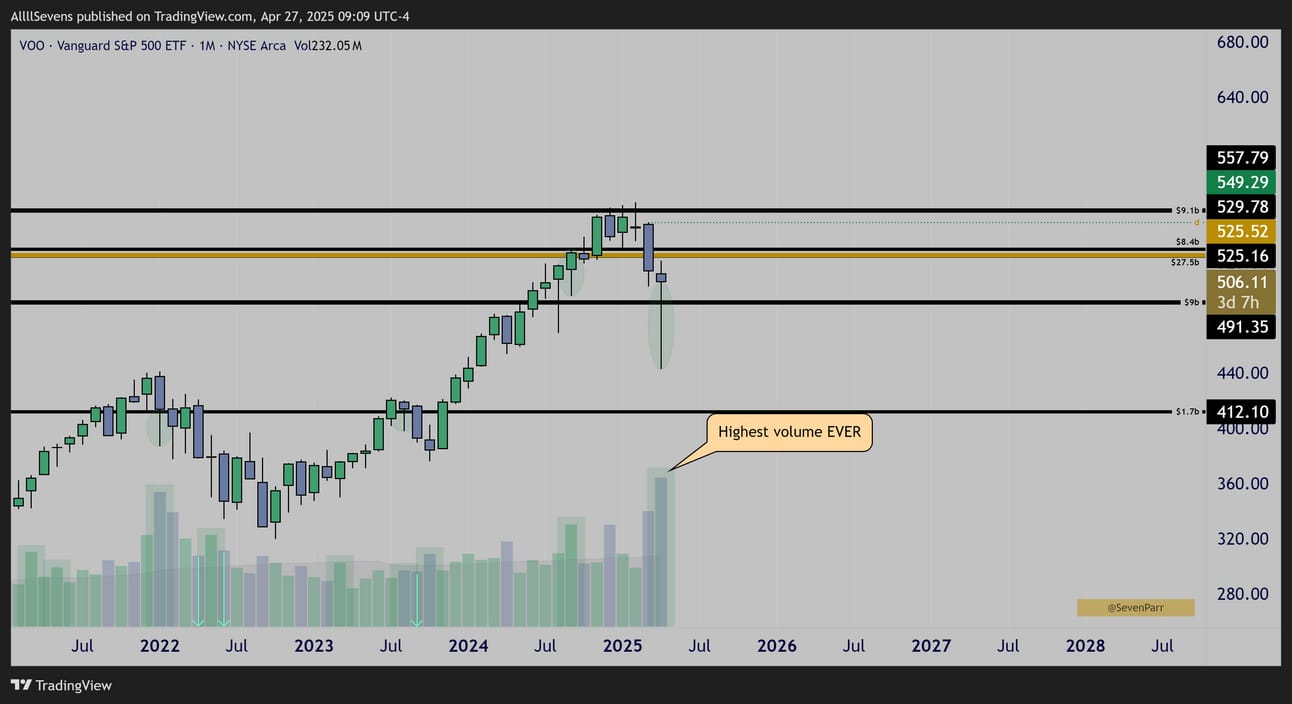
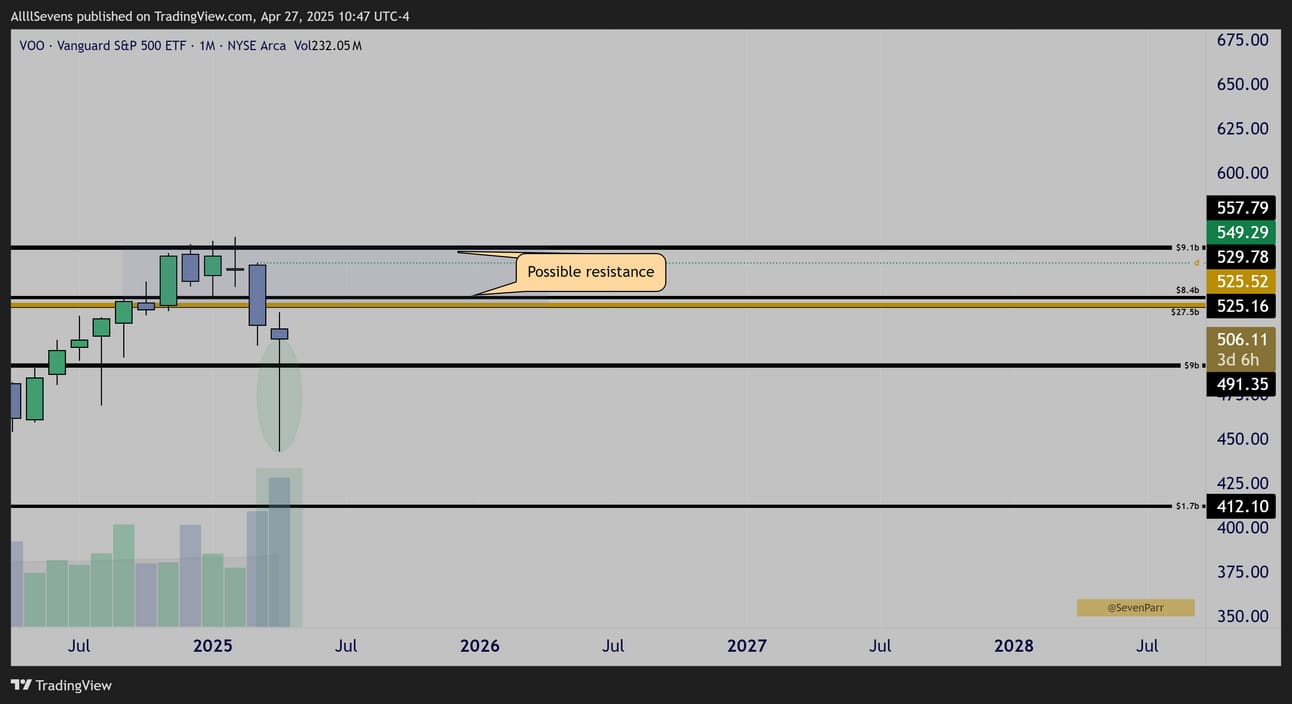
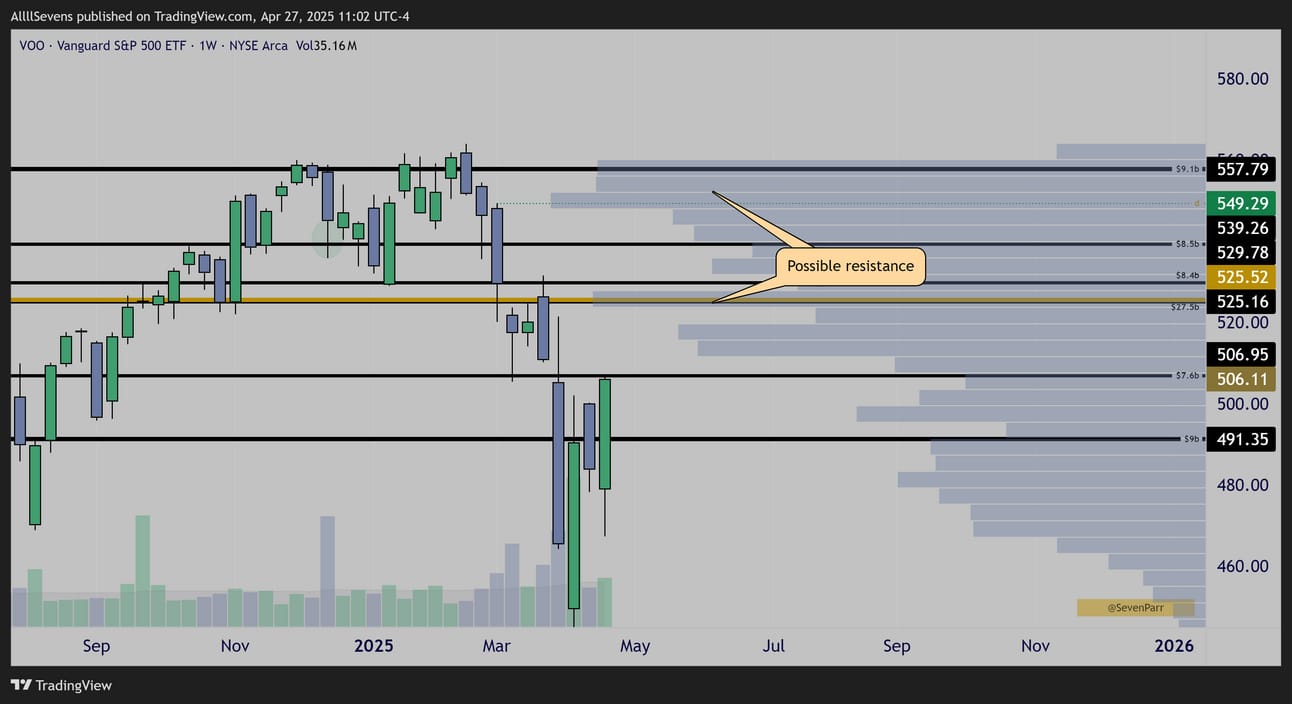
$VOO ( ▲ 0.38% ) Monthly Candles
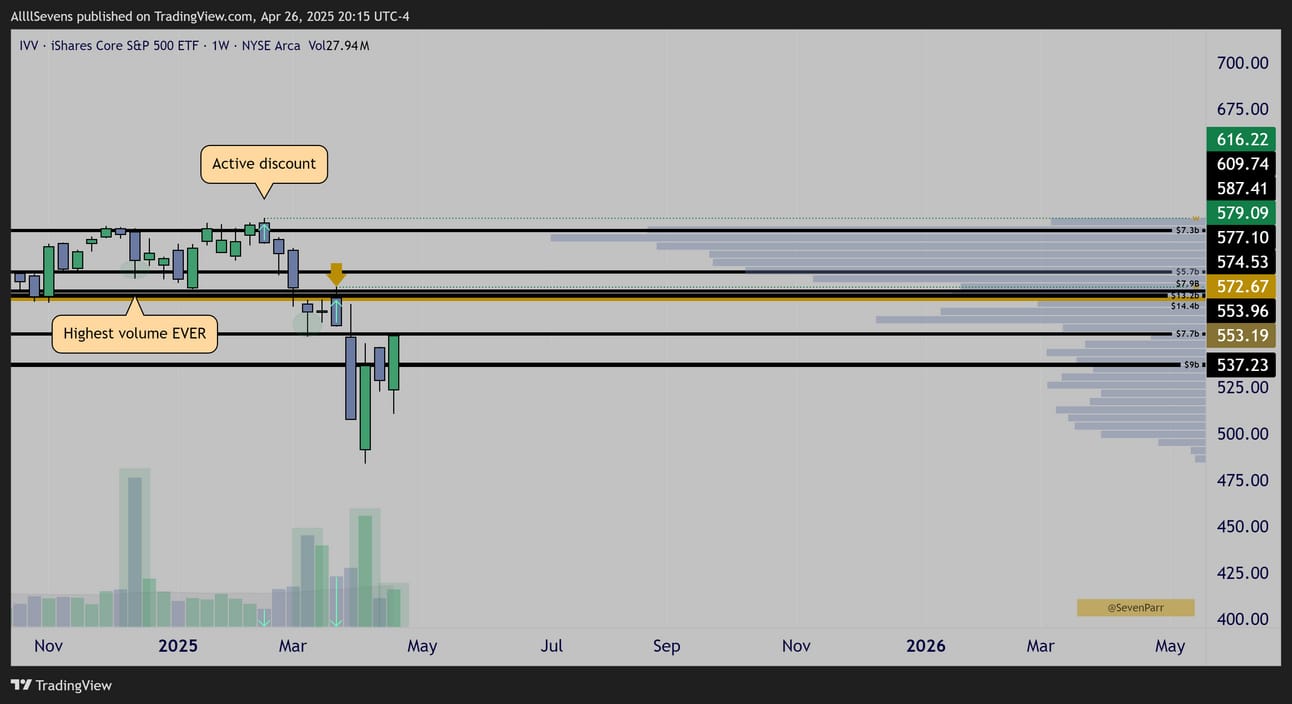
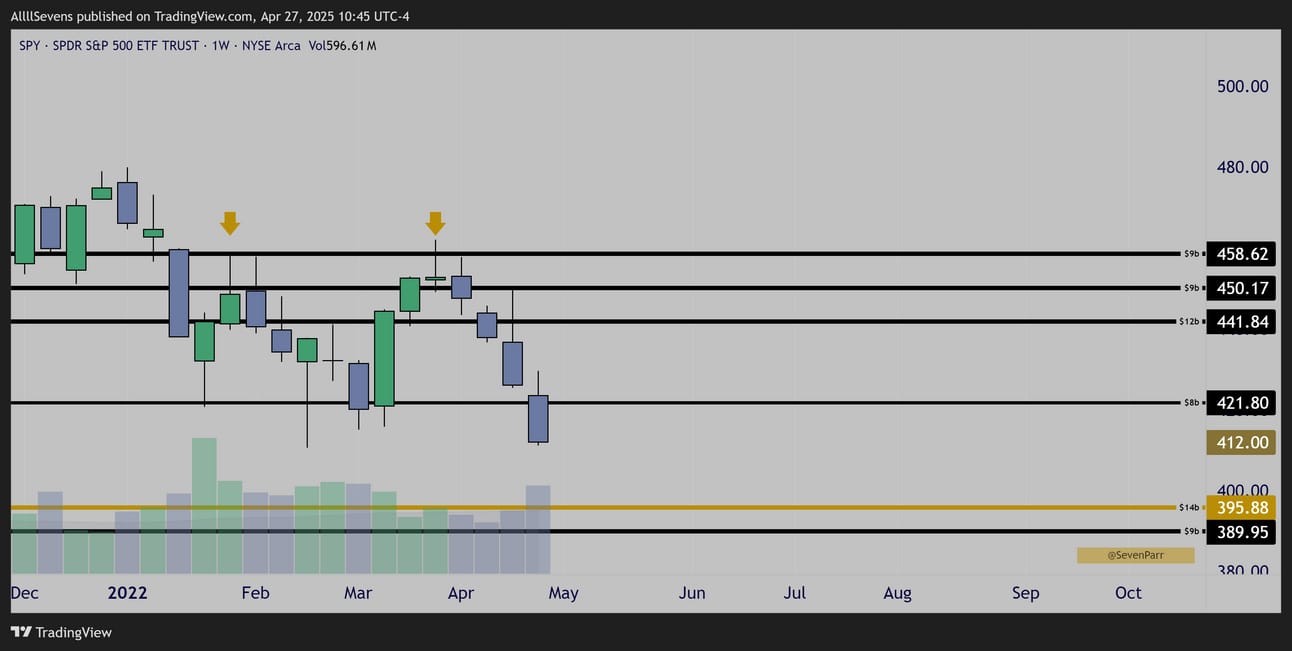
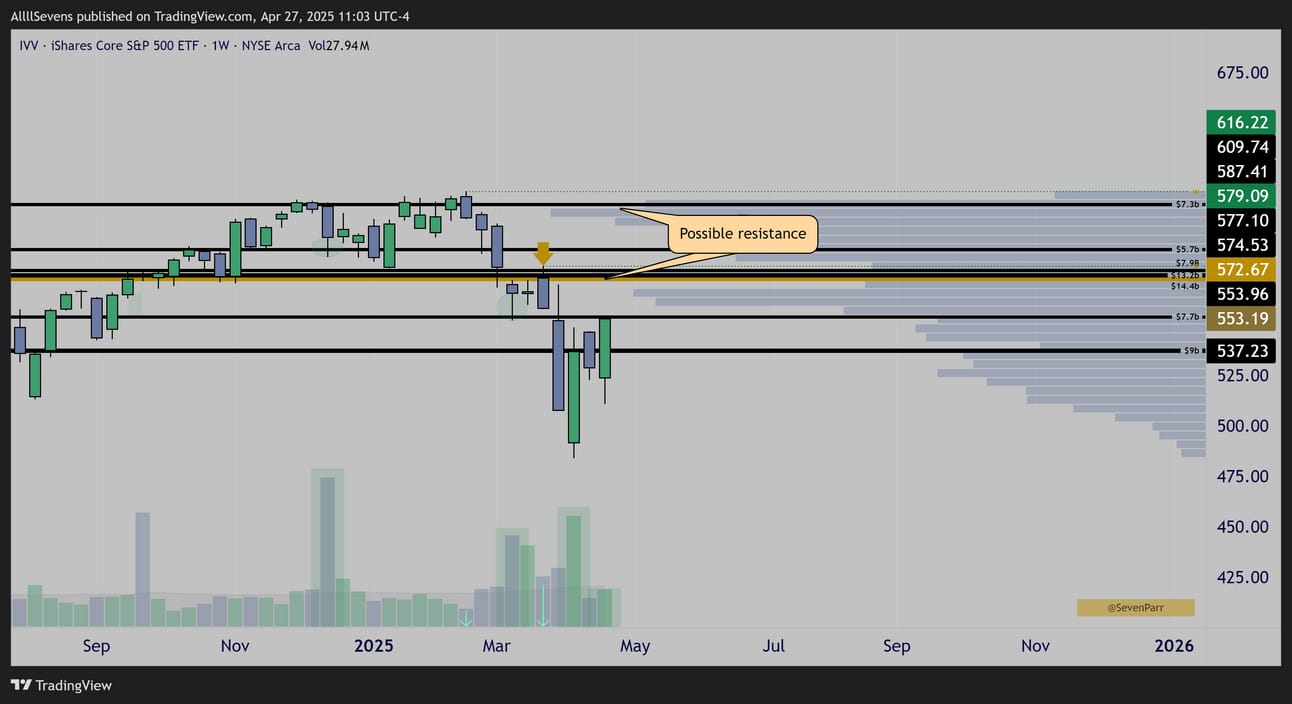
$IVV ( ▲ 0.42% ) Weekly Candles
The next two next largest ETF’s tracking the S&P500 after $SPY ( ▲ 0.45% ) are $IVV ( ▲ 0.42% ) & $VOO ( ▲ 0.38% )
They’ve recently seen dark pool activity that dwarfs anything observed during the 2021-2022 accumulation phase. These dark pools are already being accumulated on the ETF’s highest volumes EVER, marking an unprecedented level of institutional investment taking place.
This suggest that the current dip in the market will turn out to be even more lucrative than the one in 2022…
The scale of this accumulation points to an extremely strong conviction among institutional investors during a time of severe economic uncertainty.
Despite the decline in price ever since these dark pools were transacted, the candle stick & volume patterns reveal a compelling narrative of institutional behaviour. High volume lower wicks appearing precisely at dark pool levels signal clear accumulation. Meanwhile, larger candle sticks pushing price lower are occuring on notably decreased volume, indicating a lack of institutional participation.
The candle I want you to really pay attention to above is on IVV, which shows a bearish engulfing pattern rejecting the ETF’s largest-ever dark pool cluster—a $35 billion level @ $572.67 right after accumulation just two weeks prior. Notice the significantly reduced volume on this sell-off. The absence of volume specifically at the most substantial institutional levels ever recorded, is highly revealing: institutions are not / did not participate in the selling. Even as the market clearly broke, retested, and rejected their levels, they held strong on their prior accumulations, and over the last 3 weeks we saw them continue to accumulate record amounts ($VOO Monthly wick). Market-wide, following that IVV rejection candle, stocks collapsed and record volumes came in to soak the dips. It could not be more clear that the recent crash was “manipulated” in a way, or at least, simply driven by short-term speculators, and NOT institutions.
This may be hard to believe- that institutions did not participate in such a drastic and large price movement to the downside, but I promise, this is the reality of the stock market. Short-term participants have much more power over price than you have been lead to believe. The largest participants, these institutional investors, do not always have to be involved. I will prove this further in an example below.
I like to think there are two main market participants:
#1 -Risk-seeking, long-term focused institutional participants / investors.
These participants trade with MASSIVE volume, so much so that they must utilize a private exchange, the dark pool.
#2 -Risk-averse, short-term focused participants. Whether this be large institutional traders, or just retail traders and “investors” , they trade with much lower volume and they account for a majority of day-to-day fluctuations, as the institutional participant only steps in at advantageous moments, like now.
We haven’t seen dark pool activity like this in years.
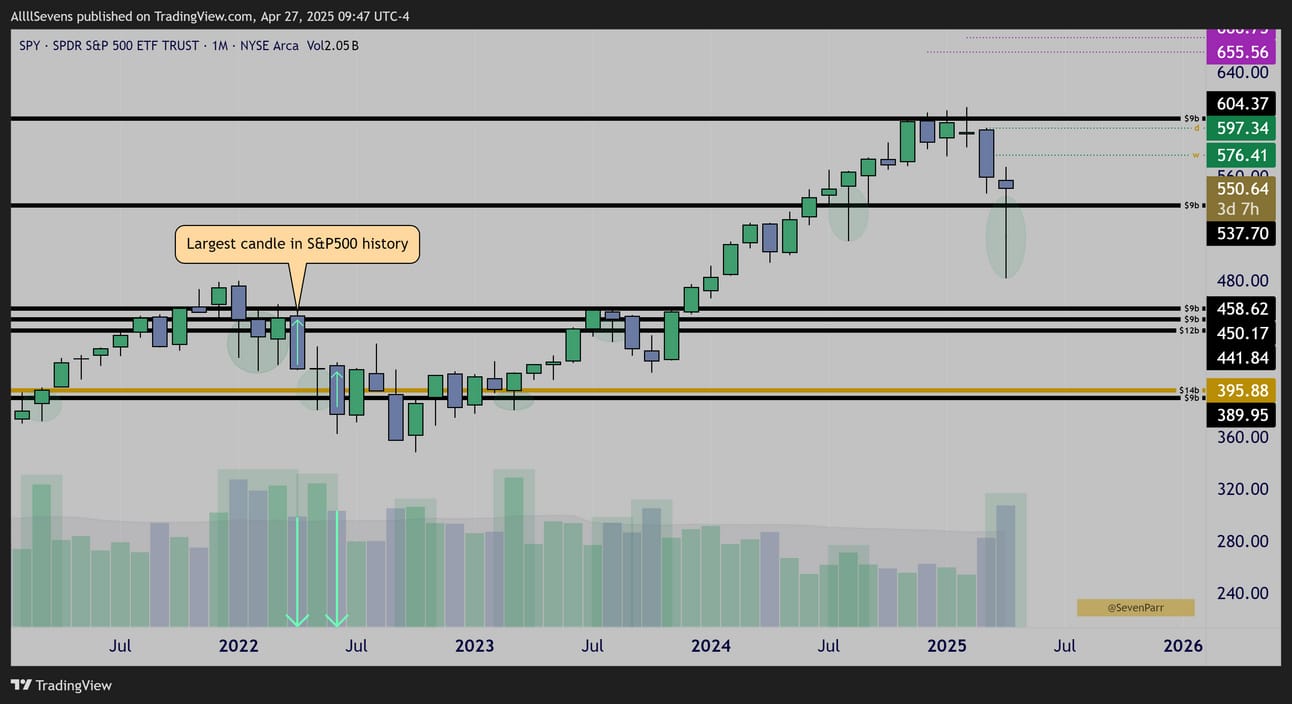
$SPY ( ▲ 0.45% ) Monthly Candles
April 2022
The largest sell candle in S&P500 by dollar amount, was traded on decreased volume, surrounded by massive volume lower wicks at dark pools signaling substantial long-term institutional investment occuring.
A historically large and fast move, was NOT driven by the largest participants in the stock market, institutional investors.
Again, this might seem hard to believe, but it’s just a fact.
The weekly candle on IVV I’ve highlighted above is the same.
The largest, most profitable participants in the stock market are institutional investors utilizing the dark pool for “long-term” gains.
While short-term speculation can offer extremely lucrative and more frequent opportunity for gains, I just want everyone to be aware of the real mechanism that the stock market is:
A wealth transferring machine, from the risk-averse short-term specuator, to the risk-seeking long-term institutional investor.
So.
I am clearly a long-term buyer here.
$IVV ( ▲ 0.42% ) is trading at a 10%+ discount anywhere below ATH’s and being accumulated on it’s highest volumes ever.
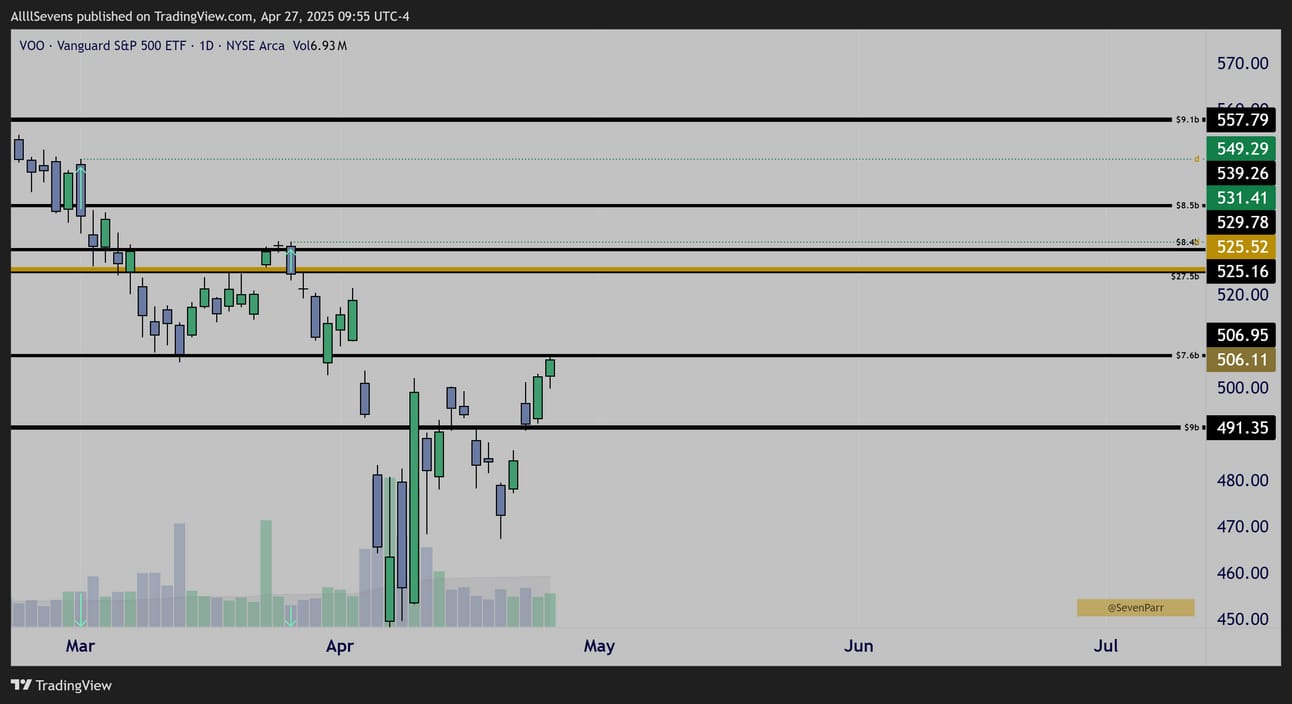
$VOO ( ▲ 0.38% ) Daily Interval
$VOO ( ▲ 0.38% ) is discounted below $549.29 and also being accumulated on it’s highest volume ever this month. It would be insane to not also be building a long-term position here alongside institutions.
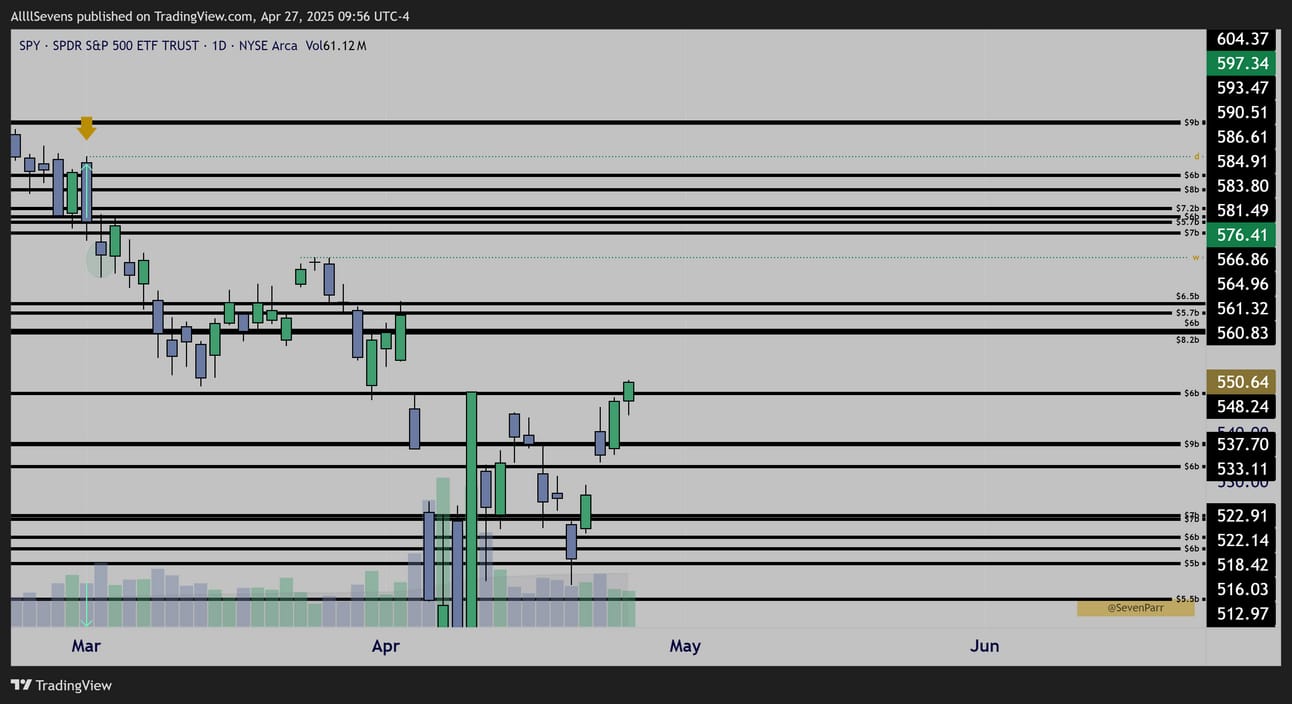
$SPY ( ▲ 0.45% ) Daily Intervals
$SPY ( ▲ 0.45% ) is discounted from the same candle as $VOO ( ▲ 0.38% )
Below $597.34, there is a significant long-term edge for investors
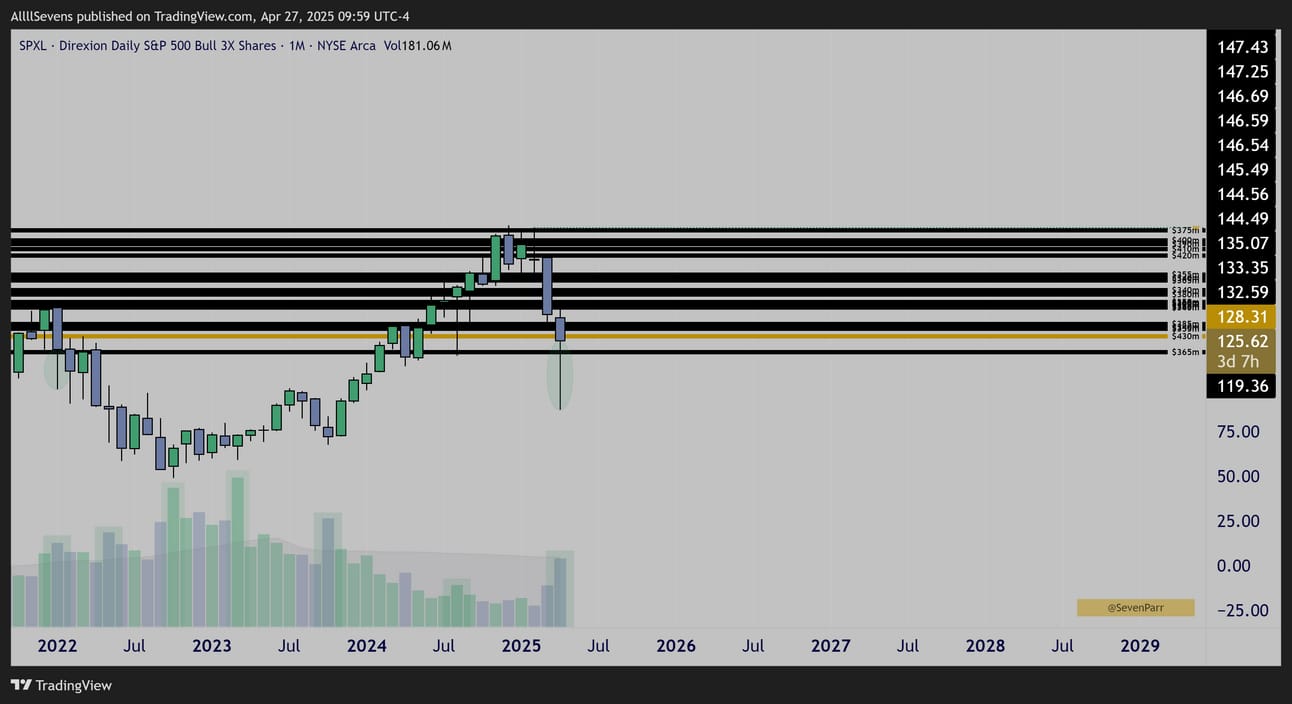
$SPXL ( ▲ 1.18% ) Monthly Candles
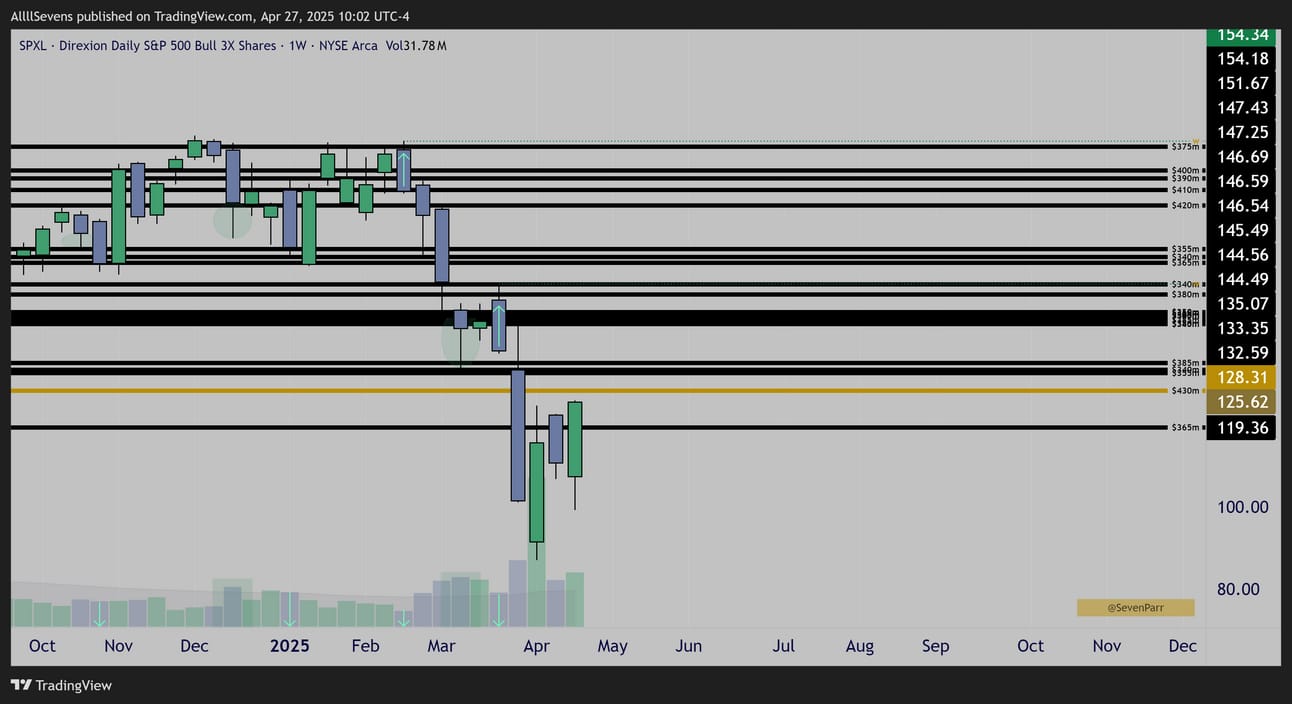
$SPXL ( ▲ 1.18% ) Weekly
Even the triple leveraged S&P500 index is being accumulated by institutional investors and trading at an extremely significant 50% discount from ATH’s just like $IVV ( ▲ 0.42% )
Two weeks ago, just like many assets, it climaxed on it’s highest volume since March of 2023 which ignited a near 200% rally…
With the discounts above, and the monthly wick potentially forming off the ETF’s largest dark pool on record at $128.31, I am absolutely a buyer here.
NOTE:
The size of the dark pools on SPXL are significantly smaller than anything on the un-leveraged index. Logically, this means they are investing significantly less money here. This information is absolutely crucial to me when diversifying my portfolio and deciding which assets to buy more of and which ones to by less of.
Now, I’ve stated that I am clearly a long-term buyer as institutional investors are also making never before seen investment into the S&P500, but, as we know from late 2021 to early 2022 accumulations, this does not always result in short-term upside. In fact, when those accumulations first began, the $SPY ( ▲ 0.45% ) declined by over 20% over a period of 9 months (recall April 2022)
Why did this happen, and could it happen again?
$SPY ( ▲ 0.45% ) Monthly Candles
$SPY ( ▲ 0.45% ) Weekly Candles
While major long-term accumulation was taking place, it occured in the lower portion of the dark pools that had recently been transacted…
Sort of exactly like the large accumulations we saw just two weeks ago on the recent low. This resulted in limited upside, a double top, and a bear market, including April 2022, the largest monthly down candle in history.
$VOO ( ▲ 0.38% ) Monthly Candles
$IVV ( ▲ 0.42% ) Weekly Candles
$VOO ( ▲ 0.38% ) Weekly Candles
Objectively speaking, we are in nearly an identical scenario as January of 2022
It is very much possible that economic uncertainties persist over the coming months, price rejects this area, and another April 2022 style drop occurs- potentially even larger, considering this accumulation is drastically larger.
The short-term market environment is undeniably uncertain, and it would be unwise to “go all in” right now, even if price simply reclaims the levels above with no issue and a bull market ensues. Hindsight will always be obvious.
With the data in front of me right now, I am 100% buying stocks for the long-term and I’m even expecting short-term upside at the moment, but if and when price hits levels above and rejects, I will be very open to the possibility of a further decline. We will see when we get there.
Two weeks ago we traded our highest volumes in years, traded an inside week, and then last week, bullish engulfed. I expect a continued V-Shape recovery until sellers potentially show themselves at resistance.
Use my referral link for BlackBoxStocks, the single service I use to collect flow & dark pool data http://staygreen.blackboxstocks.com/SHQo
If the S&P500 is seeing historic institutional investment, you better bet there are indivudal stocks seeing the same patterns, and possibly providing more upside potential with more risk, or deeper discounts with relatively the same risk.
There are also some stocks being accumulated, but not sharing the same potential resistance above. So, if the market does remain uncertain, these sectors or stocks might actually remain strong and outperform.
I have a ton of data to discuss in the remainder of this newsletter.
It is extremely valuable.
Because it is all speculation, and my personal opinions / commentary and not actual investment advice or recommendations, I charge just $7.77
You’ll get my analysis on the dark pool data & options flow that I cam eacross this past week for 15 different tickers including TSLA, AAPL, AMZN, MSFT, and AVGO. I also talk about a very unique defensive ETF seeing extremely unusual dark pool activity right now. Then, a handful of compelling setups, some with flow, some without, but all assets I either bought last week or have the intention to buy this week.
You’ll also gain access to my discord where even more research is shared.
I can not always fit everything into these newsletters.
Sign up here, log in, and read the rest of this newsletter.
Reply