- AllllSevens
- Posts
- Weekly Newsletter
Weekly Newsletter
Unprecedented Dark Pool Activity + The Financial Sector
Seven Parr
September 29, 2024
Disclaimer
Before you read this newsletter, it is crucial to understand the following:
-Background: I am a 22 year old college dropout with no formal education or professional experience in the fields of finance, investing, or stock market operations.
-Content Nature: All information I share is purely speculative and represents my personal, abstract opinions.
-Take With Caution: Approach the ideas, concepts, and data presented with a healthy dose of skepticism. They should not to be considered as definitive or accurate information.
-Not Financial Advice: This content should in no way be interpreted as financial or investment advice. It does not constitute a recommendation to buy, sell, or hold any securities or financial instruments.
-Investment Risk: Investing and trading the stock market involves significant risk, including the potential for substantial financial loss.
-Professional Consultation: Always consult with a licensed financial advisor or perform thorough personal research before any financial decisions involving the market.
-Liability Disclaimer: I bear no liability for any financial losses that could result from actions taken based on the information provided.
Preface:
On September 20, 2024, you may have noticed abnormally large volumes across many individual stocks in the market. This was due to a significant spike in Dark Pool activity. The Dark Pool is a private exchange not accessible to you or me, where large institutional investors transact shares to avoid market slippage and to provide anonymity. This recent surge was widely due to the S&P 500 undergoing its largest rebalance in over four years. The rebalance involved the inclusion of companies like Palantir (PLTR) and Dell (DELL) into the S&P 500, alongside changes in weightings for established giants like Apple (AAPL) and Microsoft (MSFT) - just to name a few.
Despite this DP activity being visible across hundreds of indivudal stocks, the SPY itself did not see any…
This is because institutions made their trades using the VOO and the IVV which also track the S&P500.
In this newsletter, I will speculate as to why they are being “sneaky” and what it may mean for future prices.
Here’s the data👇
Price, Volume, % of Avg. Daily Volume, and Notional $ Amount
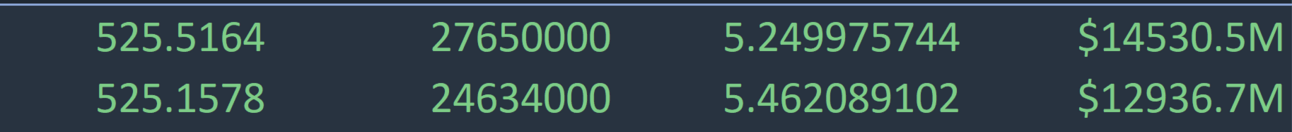
$VOO Dark Pools
$27B+ (52M+ Shares) @ $525.52 & $525.16
500%+ of it’s average Daily Volume
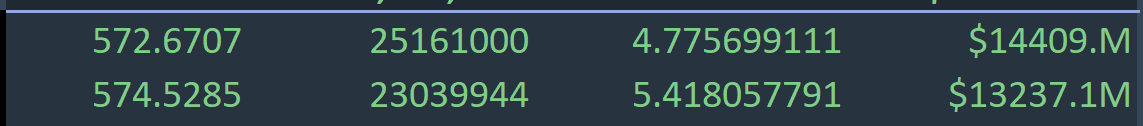
$IVV Dark Pools
$27B+ (48M+ Shares) @ $572.67 & $574.53
Also roughly 500% of Average Daily Volume
Over $50B in Dark Pool activity across just four transactions very close to each other. This is a stark difference in the SPY’s current largest DP’s on record:
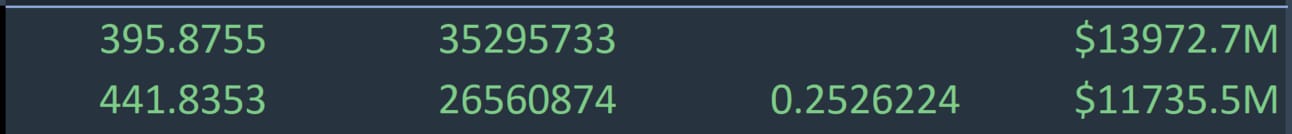
$SPY Dark Pools
$13.9B+ (35M+ Shares) @ $395.88
$11.7B (26.5M+ Shares) @ $441.84
$SPY’s Dark Pools came in during 2022 and were multiple months in between…
The activity we are seeing here on VOO and IVV is absolutely insane because it is a combined 4x as larger than either of these indivudal prints and all coming in within a few days from each other at the roughly the same prices.
These price levels on VOO and IVV establish critical support & resistance.
What’s more important though, analyzing the relationship between the candle bodys, their wicks, and the volume behind them at these levels.
This allows for educated speculation on whether institutions are accumulating or distributing their holdings through these Dark Pools.
Considering how shockingly large these transactions are, they should be incredibly impactful for the market moving forward.
VOO / IVV /SPY
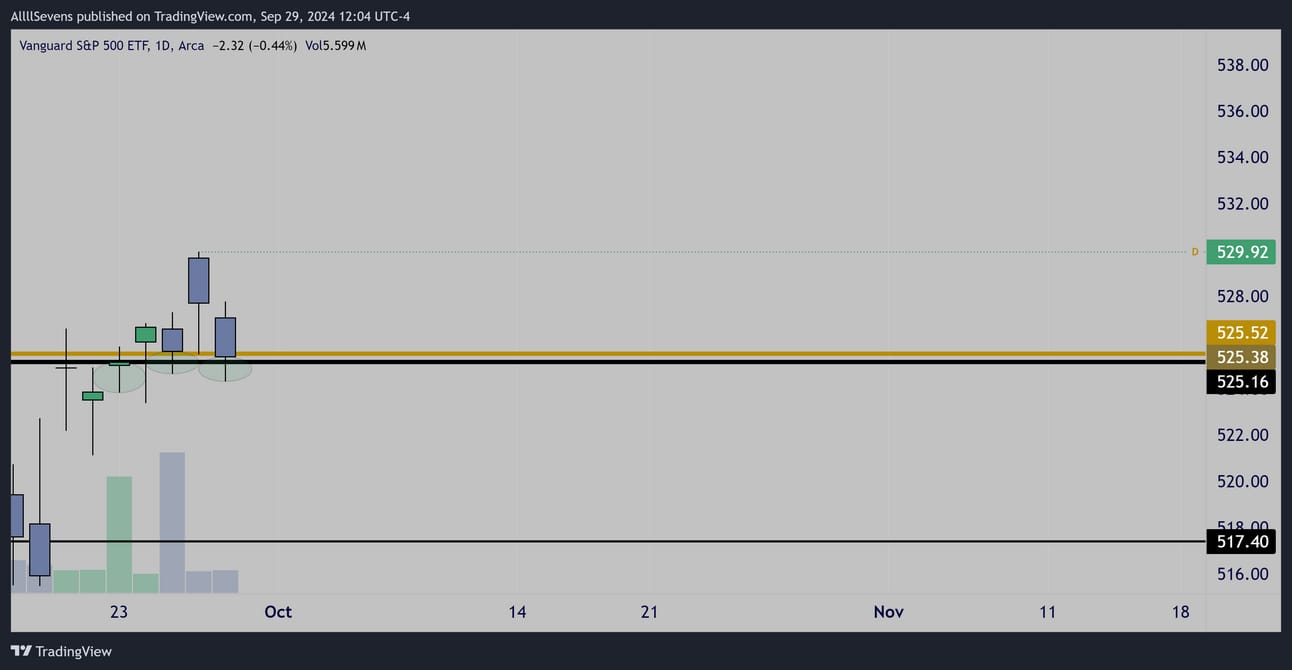
$VOO Daily Interval
Based on the lower wicks on volume formed at these levels, I am already under the impression institutions are accumulating long-term positions.
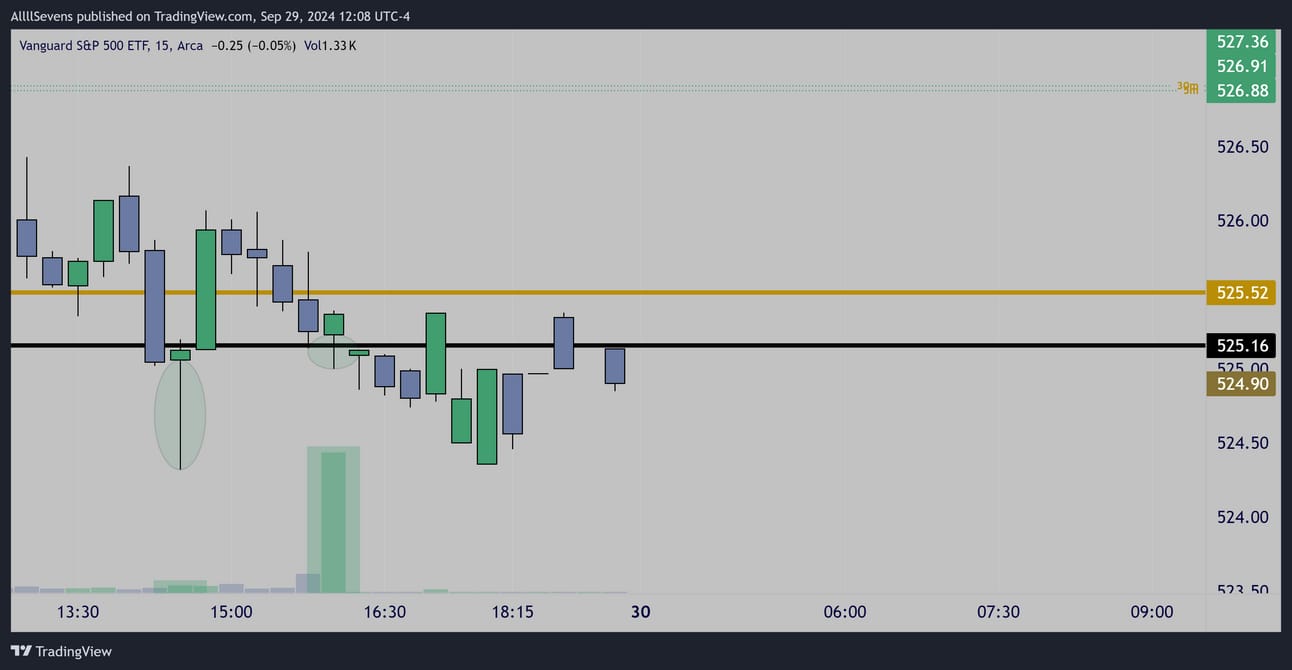
$VOO 15m Interval
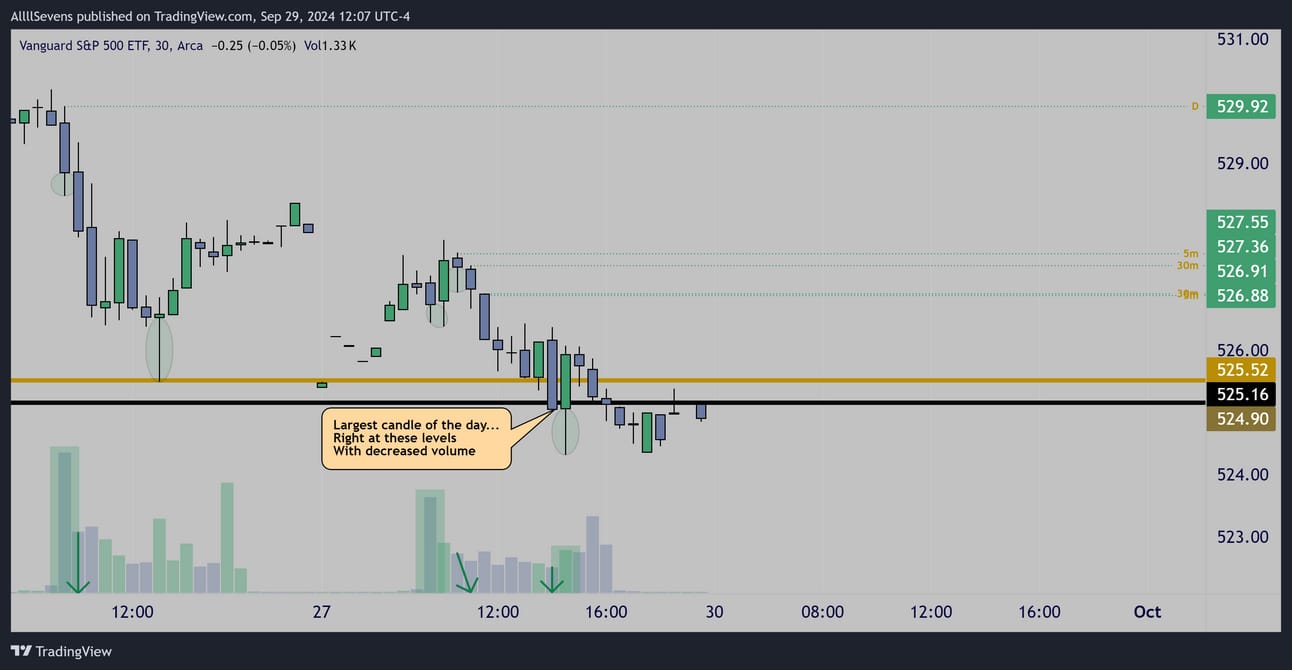
$VOO 30m Interval
The intraday volumes the last two sessions following the prints further confirms this idea.
On the Daily interval, these levels are clearly support for price as of now.
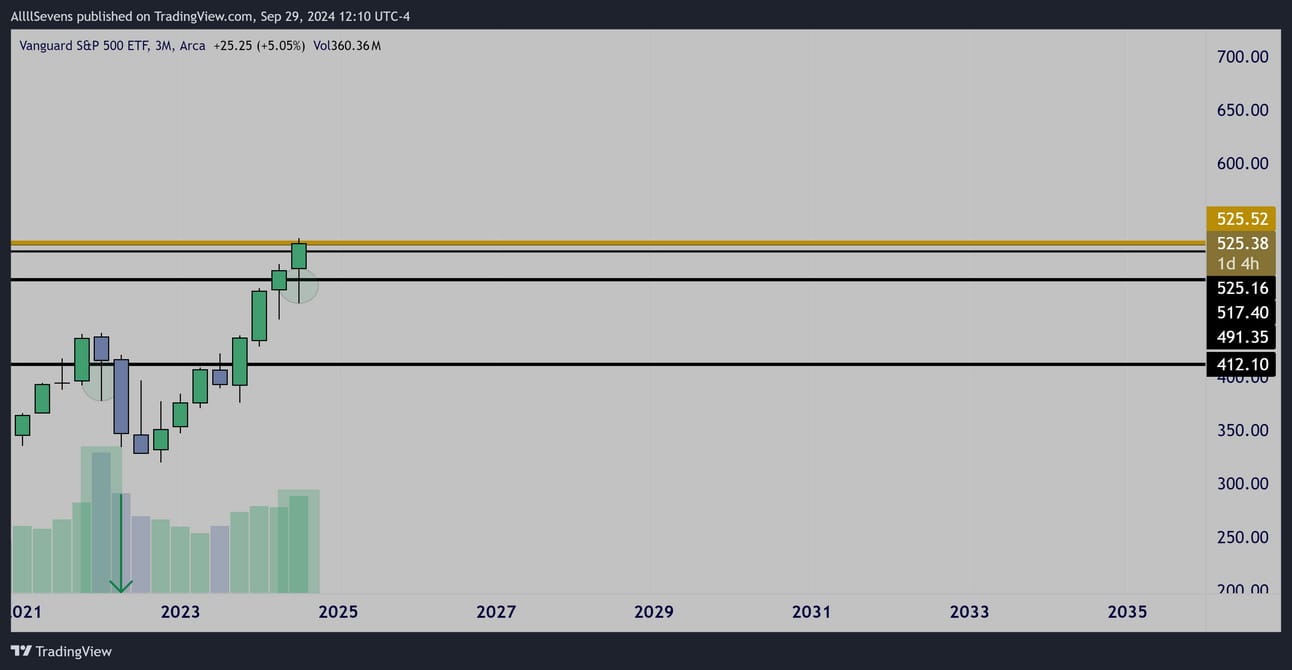
$VOO Quarterly Interval
On the higher time frame, accumulation is also visible.
This looks explosive.
If price can also turn this cluster into support on the monthly and quarterly time frames, we have incredible upside potential on the horizon.
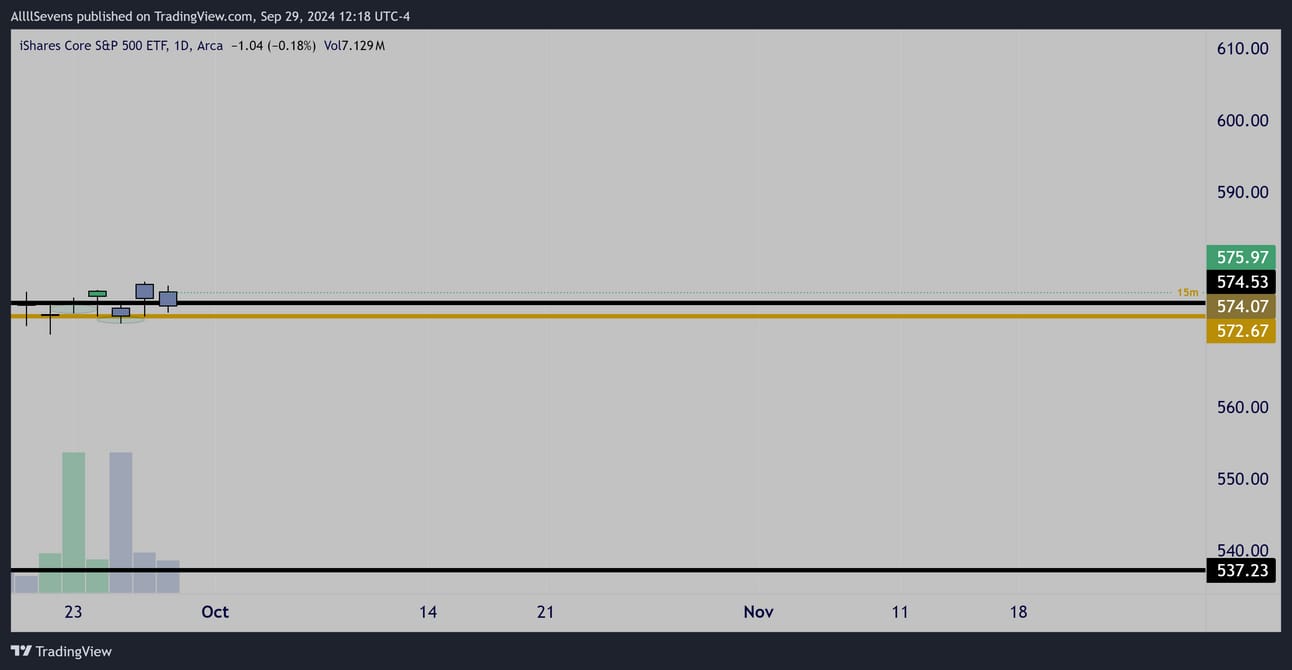
$VOO Daily Interval
The same lower wicks. Again, it’s very clear to me that these are long-term bullish positions being built. The same lower time frame accumulations as well as the higher time frame accumulation is also visible here, so I will spare sharing more of the same exact charts.
From the information provided above, as well as my recent newsletters, I believe here is absolutely no long-term bearish argument here.
These dark pools are extremely long-term bullish.
More on that in a moment.
In the short-term, the markets direction is highly speculative, and
there is always a probabilistic argument for either direction, so lets talk about it.
As of now, these levels are Daily support. Bulls want to see them hold and transition into weekly, monthly, and potentially quarterly supports.
Now, consider a short-term bearish scenario where these supports fail.
if lost as support, they get turned into resistance. which would put short-term active retail bulls at a major disadvantage to bullish, passive institutional participants.
If these levels were lost, they are so large that retail participants may struggle to reclaim them, which would allow for institutions to exploit the situation.
It would create a short-term resistance for retail to reject, while institutions accumulate each and every dip until eventually there are no more shares willing to be sold and retail has the ability to break back through resistance and continue the long-term trend.
Which scenario is more probable?
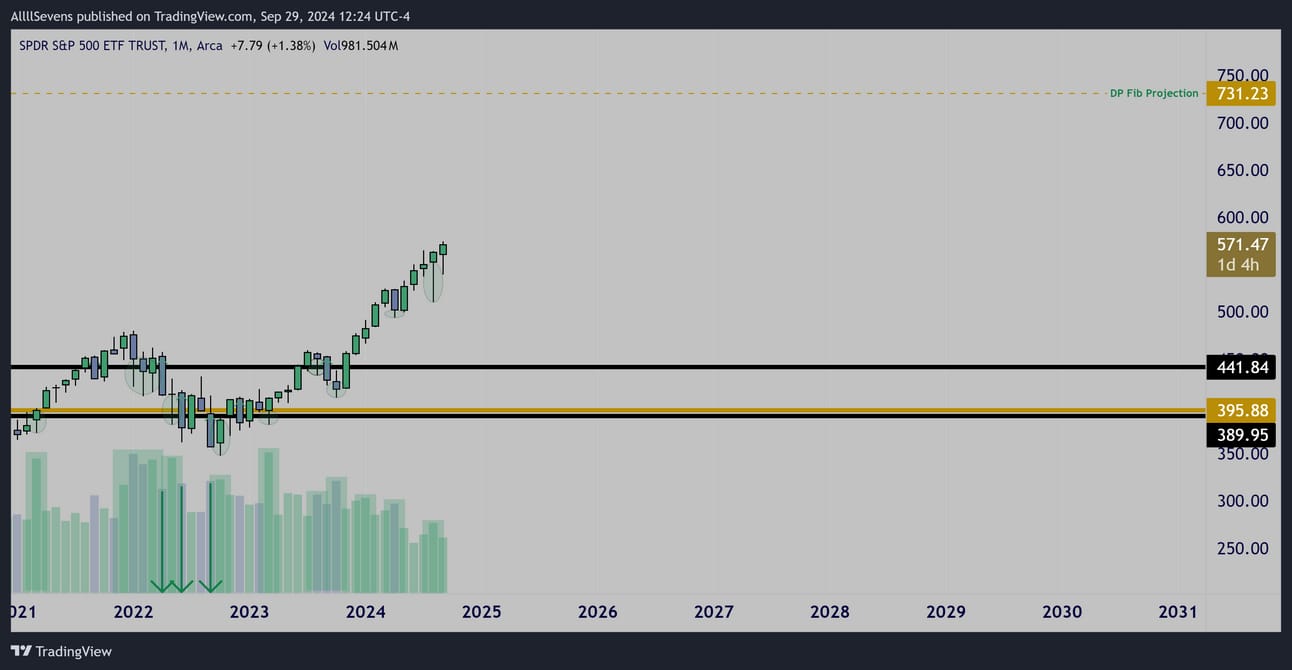
$SPY Monthly Interval
While we have the possibility for VOO and IVV to be face short-term resistance if these levels are not respected as support-
The SPY, the larger S&P500 vehicle, does not have this dynamic.
It is in clear skies with a strong upwards trajectory.
This is why I think short-term bullish continuation remains the higher probability.
I am thinking the intention behind institutions transacting these trades on the VOO and IVV is so that their primary vehicle (SPY) will remain unphased not still not have any resistance for it’s long term projection of $731.23
I remain under the impression that this is The Dawn of The Bull Market
Seeing this absolutely unprecedented amount of Dark Pool activity in the S&P500 act as support could potentially serve as THE signal that my newsletter above is correct, and the bull market has only just began.
It is possible I am completely wrong short-term!
I would not be surprised if I were, because this is a game of speculation and probabilities. Anything can happen and I am aware of this. Because I am aware of this I hold no FEAR towards the market’s potential outcomes.
I will maneuver with the market as it sees fit.
For now, I continue to think probabilities favor aggressive short-term upwards expansion. If you have not read my previous newsletters leading up to this one, I think it’s very important to do so in order to grasp the entire situation.
You can find them on my website here.
Make sure to sign up for future emails.
Before we move on, I guess I should also outline some of the bullish flow that has been coming in, specifically for the SPX.
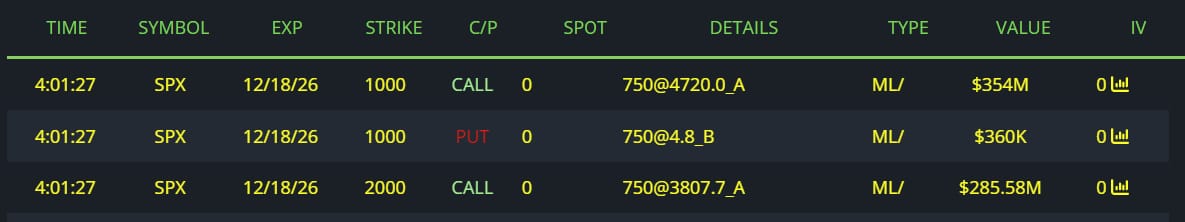
$640M Bullish Positioning Into 12/18/26
Call options that are this deep ITM and cost $380K+ per contract are obviously not even in consideration for for retail traders like ourselves, but it reinforces the short-term bullish probability in play, by showing a large fund clearly agrees.
I have one bone I am going to throw to short-term bears.
It’s funny, because even where a setup favors them, they don’t have the greatest probabilities of success right now. Let’s check it out👇
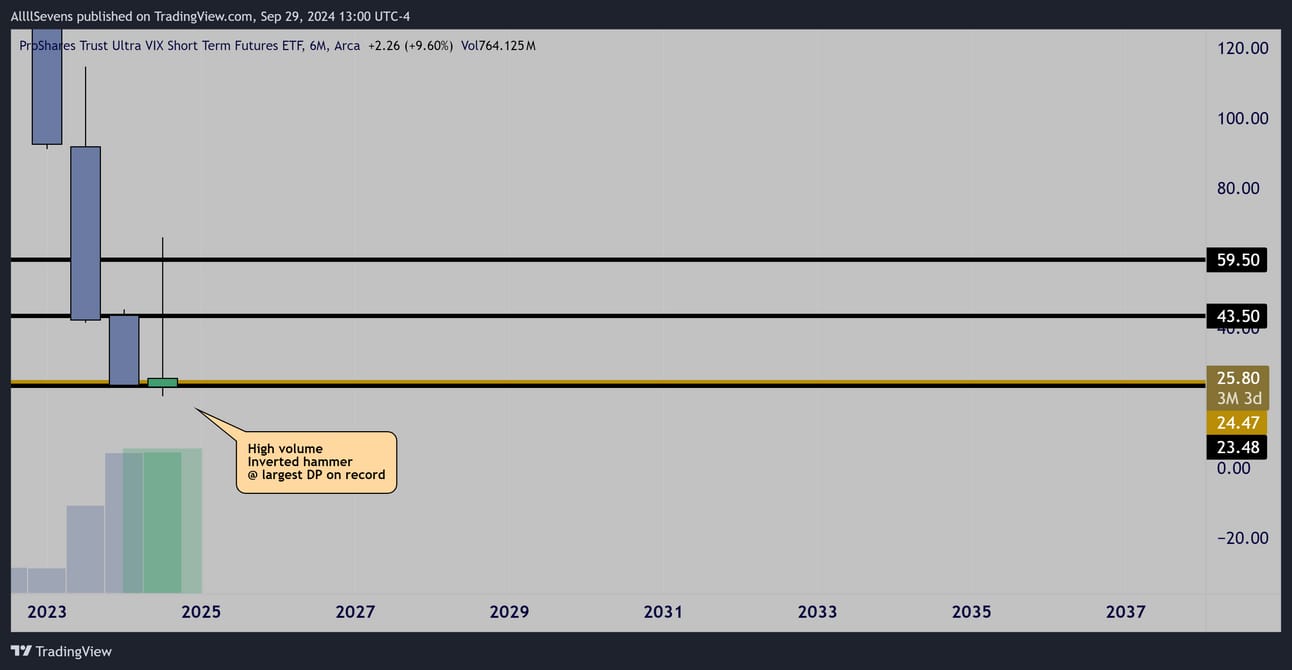
$UVXY 6 Month Interval
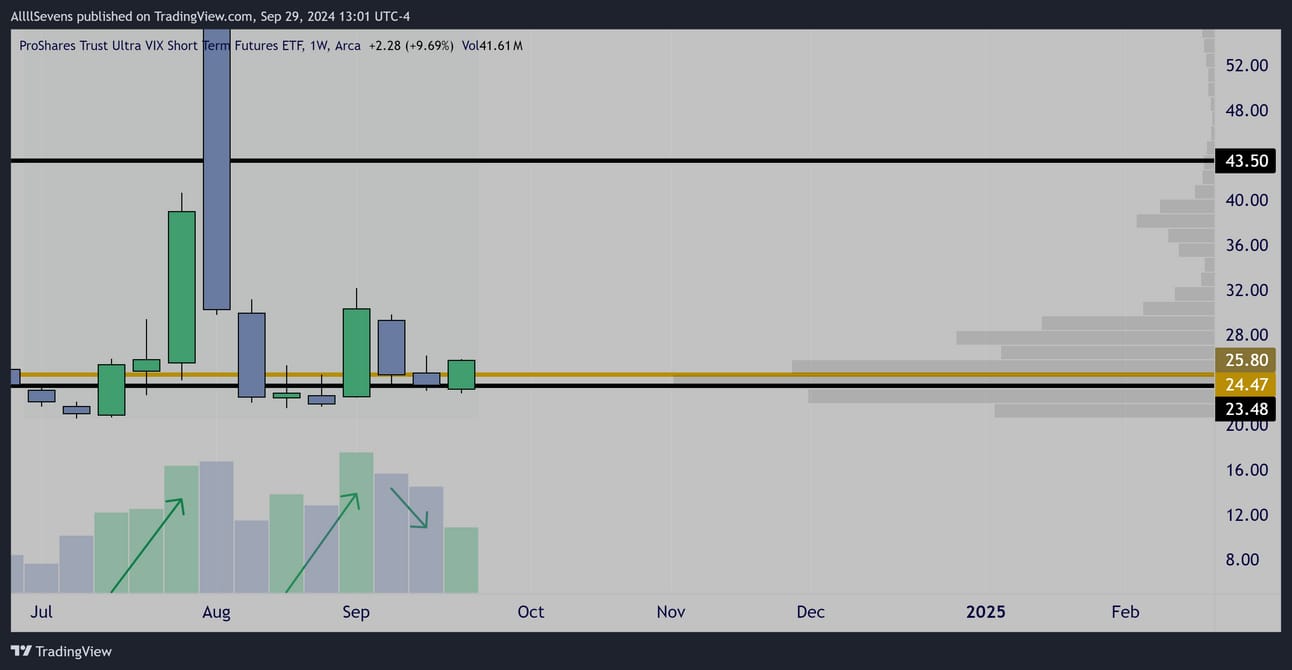
$UVXY Weekly Interval
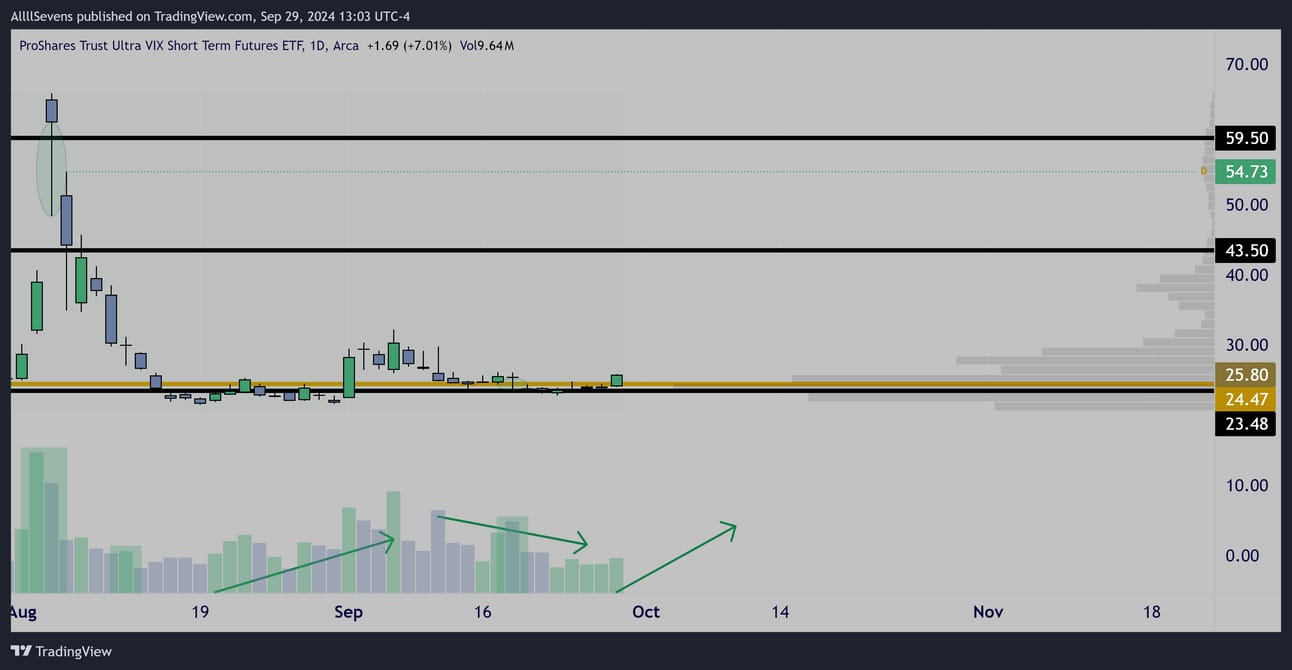
$UVXY Daily Interval
Just a few weeks ago, the VIX spiked to levels not seen since the COVID “crash”
Extremely notable. There are clearly some market participants on the edge of their seats as we get closer and closer to elections.
The UVXY displayed above is a leveraged version of the VIX that has Dark Pool.
The VIX & UVXY goes up when market volatility, usually driven by fear, goes up. This can be short-term bearish for the SPY.
The patterns here are textbook bullish. There’s really no denying it.
There is a chance that volatility is about to spike and cause the VOO and IVV to enter the bearish scenario.
But, before you get all bearish, lets consider something…
This $23.48-$24.47 Dark Pool support being accumulated on UVXY represents a measly $20M institutional transaction…
Compare that to the $50B+ support on $VOO and $IVV which is simultaneously being accumulated. Also, the $650M Bullish leap positioning for $SPX
There is a very small HEDGE being built here on the UVXY
The patterns are extremely clean and have merit but it is overall a very small amount of money buying, and in theory, the UVXY should continue to lose value over the long-term. It is not an investment vehicle. Just a short-term hedge.
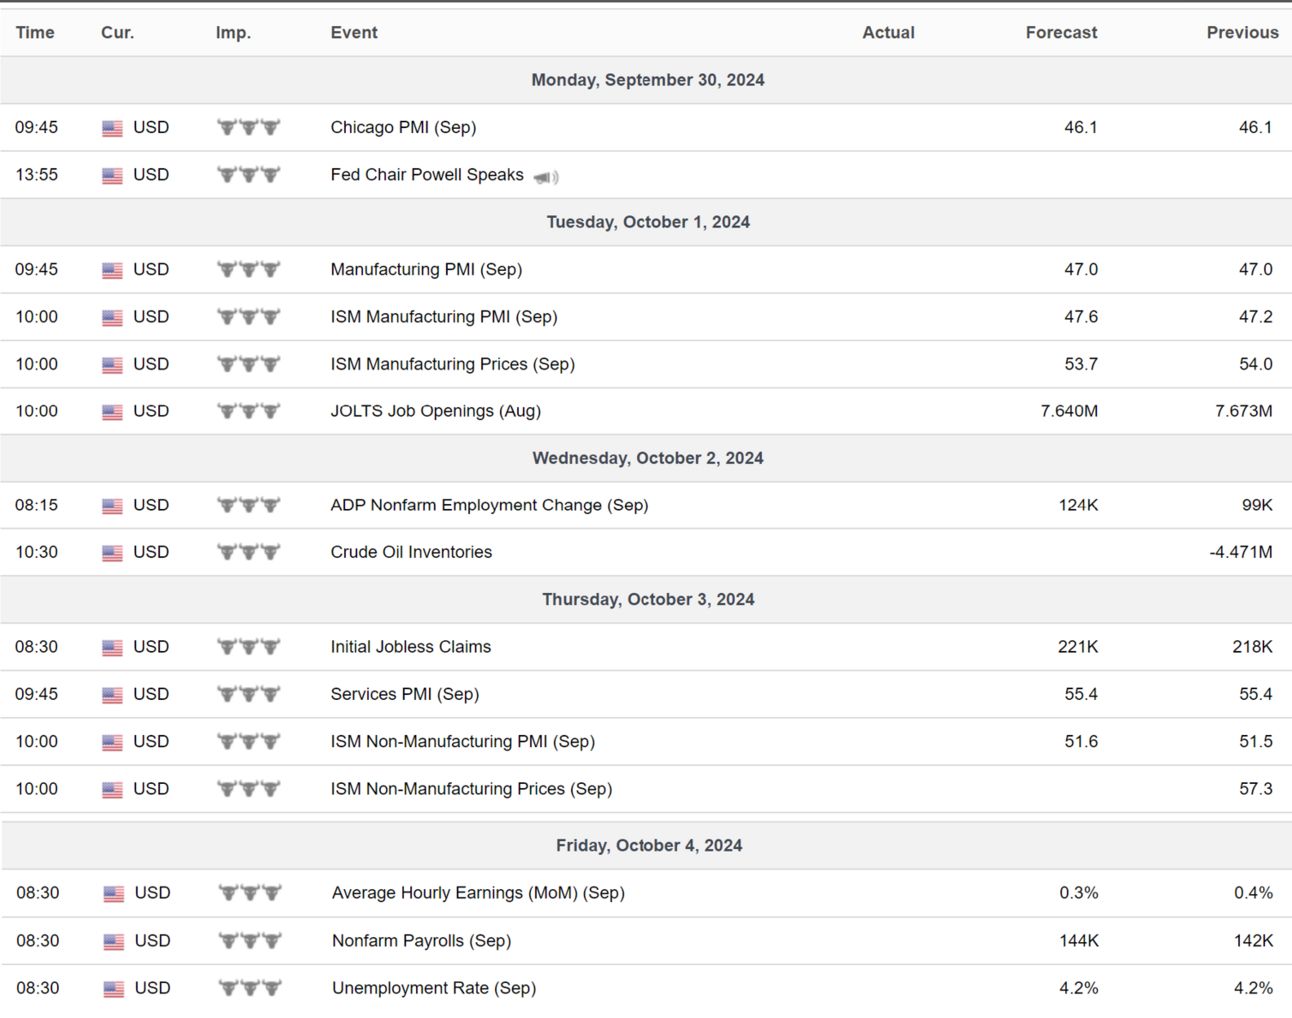
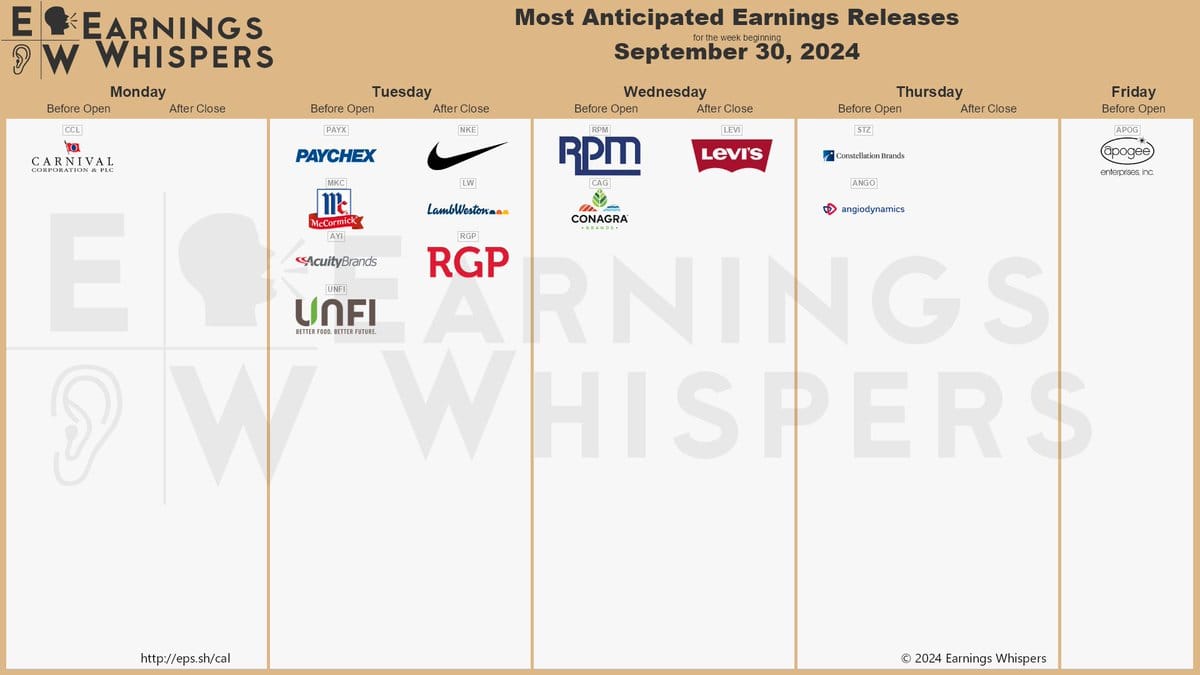
Here are the High Impact Economic Events for the week ahead that may create some volatility, as well as The Most Anticipated Earnings Releases:
XLF
Last week, I mentioned volume rotation into The Financial Sector.
Let’s start from the top, because this is profound.
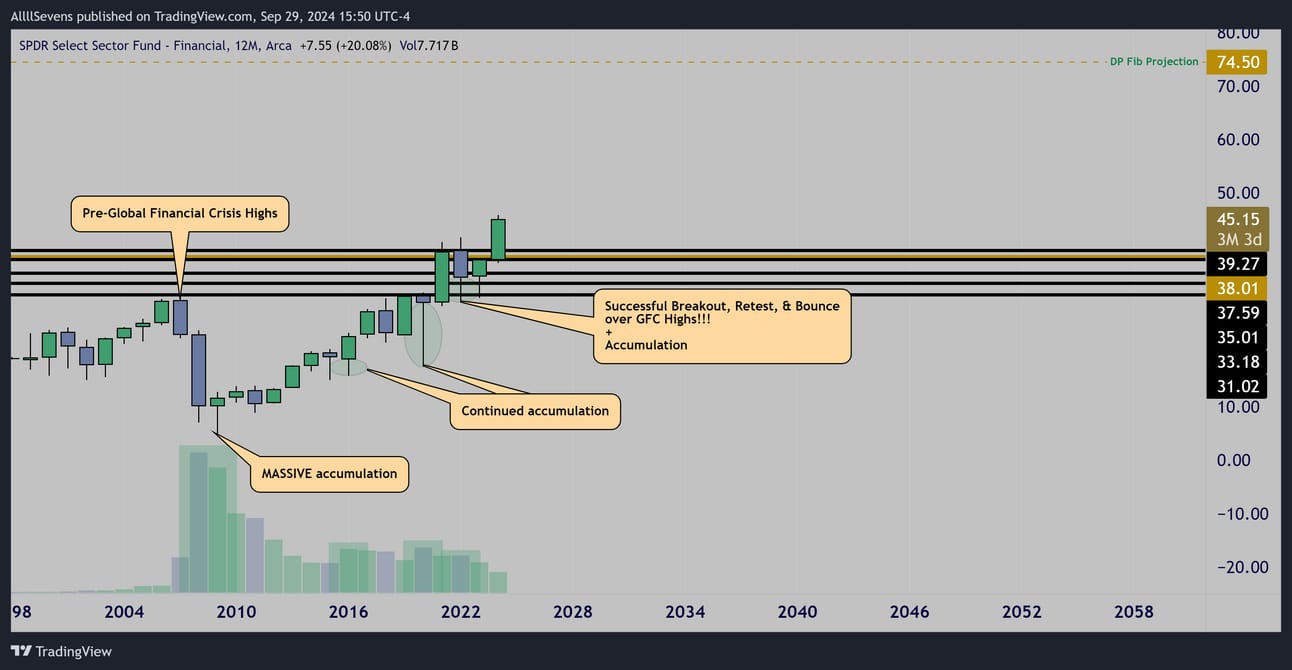
$XLF Yearly Interval
I believe a truly robust long-term uptrend is emerging in the $XLF.
Few are acknowledging the significance of it’s recent bounce from pre-Global Financial Crisis highs. To me, this rebound indicates remarkable resilience and could mark the beginning of a parabolic advance in a sector that has long lagged behind the broader market.
I project this is headed for $74.50, a 65% rise in price.
Here’s something else that further reinforces the unique explosiveness of this specific sector. Don’t sleep on this:
Out of every sector ETF in the SPY, the XLF has BY FAR the most dark pool interest, totalling over $120B compared to the $XLK & $XLI’s $40B, or the $XLV’s $50B. This is extremely notable in my opinion and shows while the average market participant is more focused on leading sectors like tech for the past few years, institutions have been building potentially oversized positions in financials.
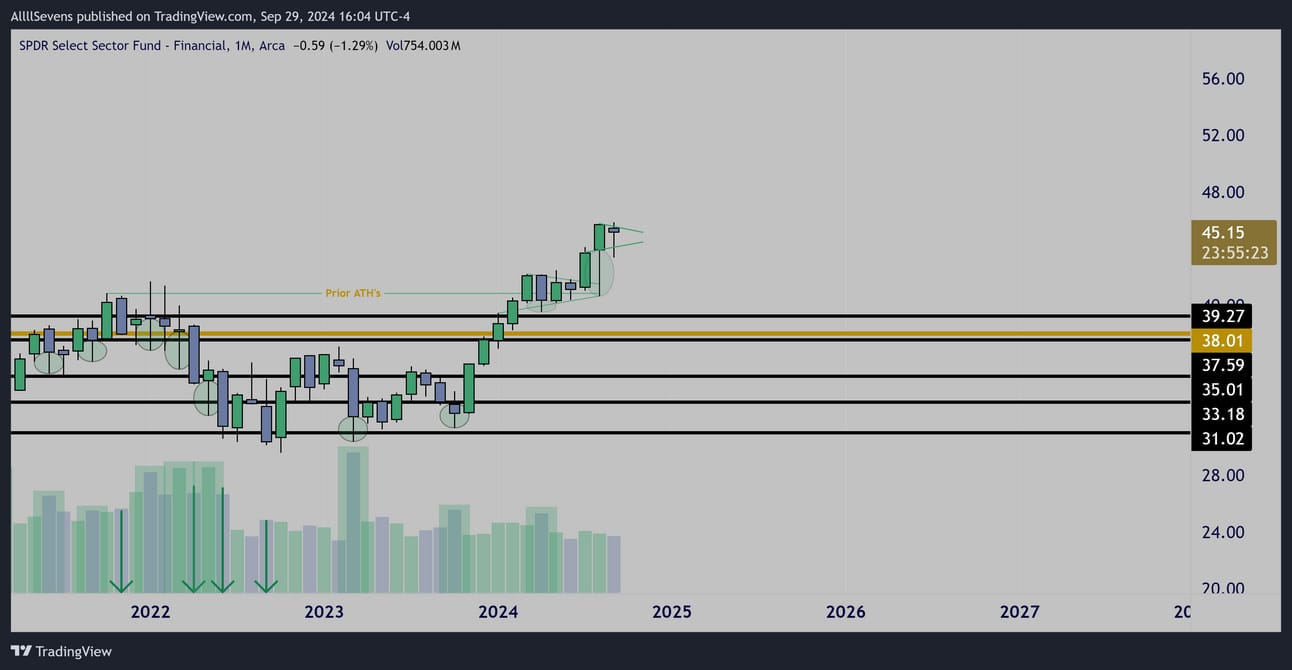
$XLF Monthly Interval
The monthly chart shows the extremely precise institutional accumulation patterns that occurred directly at Dark Pools during the recent yearly pullback and retest of pre-GFC highs.
It also shows a four-month price compression at prior ATH’s that just successful breakout, retest, and bounced headed into Q4
Currently, in September, price is undergoing another phase of congestion, creating potential again for yet again, an imminent and significant upward surge in price.
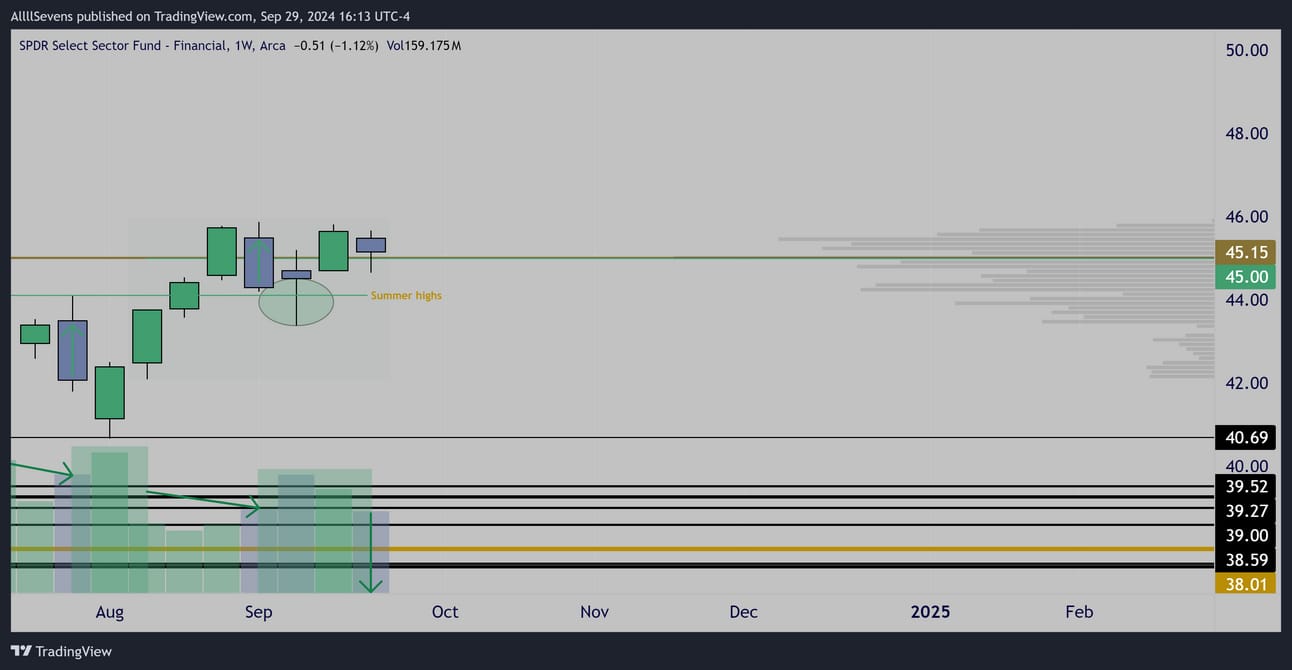
$XLF Weekly Interval
Price successfully retested and bounced from July highs on volume.
Last week, price compressed, forming a decreased volume inside candle over a developing volume shelf at $45.00, creating the probability for explosive upside continuation.
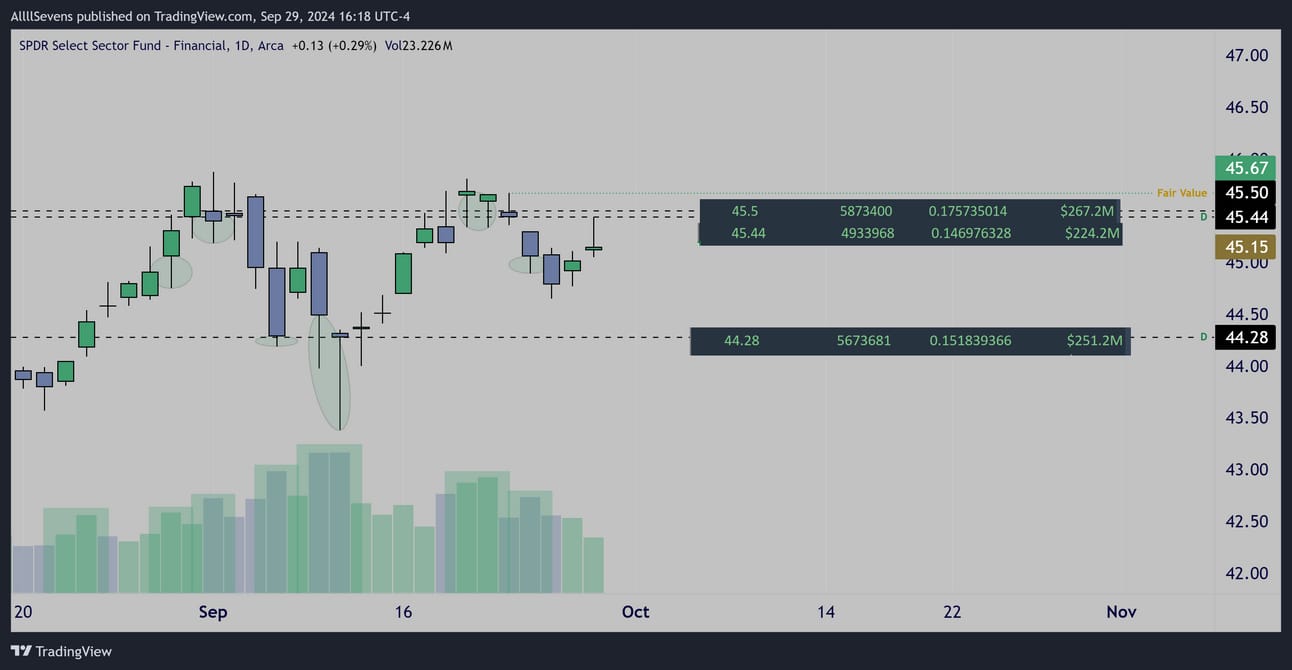
$XLF Daily Interval
This is where we can see exactly what levels institutions are adding risk from, as well as a key resistance for confirmation of a weekly breakout.
Over the already accumulated $45.44 & $45.50 Dark pools, price could begin expanding rapidly.
Unusual Options Flow
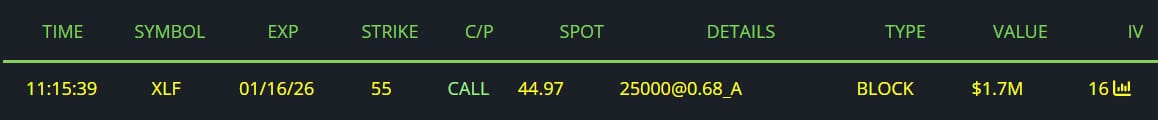
Transacted 9/26/24
$1.7M Call Buyer into The 1/16/26 55c’s @ .68

Transacted on 9/27/24
$4.25M Call Buyer into The 11/15/24 30c’s @ 5.66
$82.5K Put Seller into The 11/15/24 40p’s @ .11
Tied to a $33M Dark Pool

Transacted 9/19/24
$350K Leveraged ($FAS) Call Buyer into The 10/18/24 145c @ 1.85
Let’s check out the $FAS:
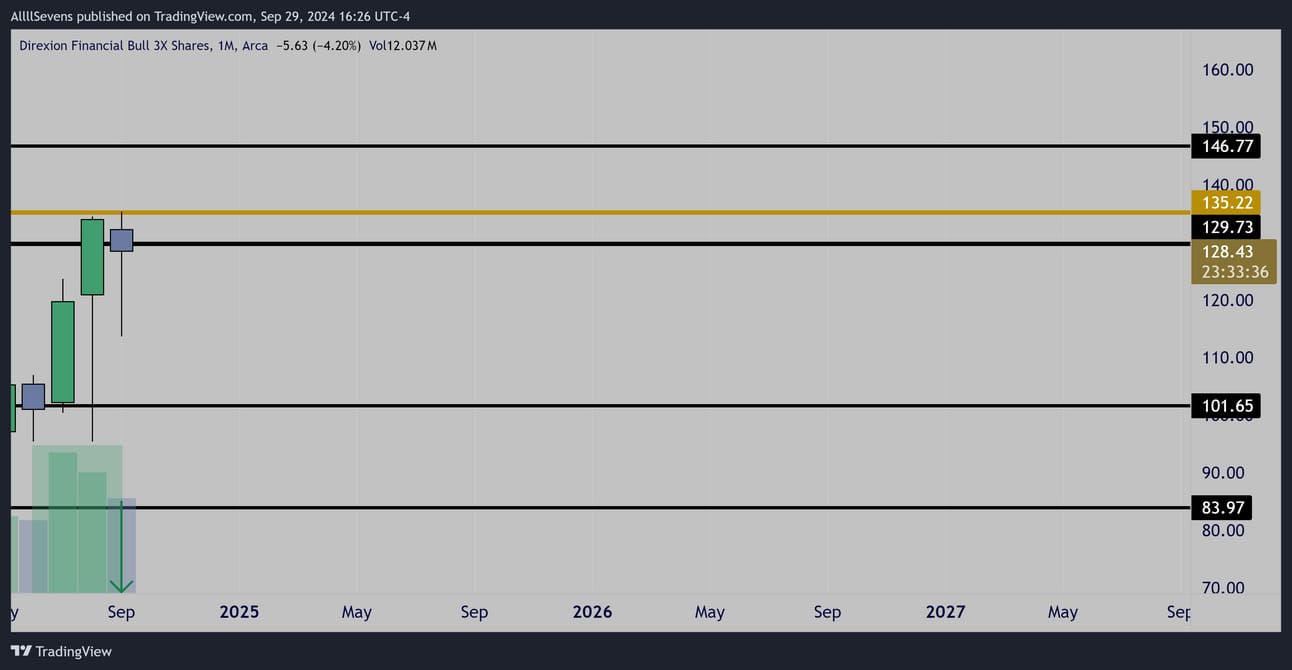
$FAS Monthly Interval
After an above average volume move up in July & August off the $101.65 DP, price has experienced had a low volume rejection of the $129.73-$135.22 resistance, forming an inside candle potentially favoring upside continuation much like the $XLF weekly candle. Bonus points if this can close and open ver $129.73 into October. One session remains.
This resistance price is looking to break is very notable. $135.22 is the largest Dark Pool on record for $FAS. If $XLF can confirm a breakout over $44.44-$44.50 alongside FAS breaking this level, we could see a serious move beginning.
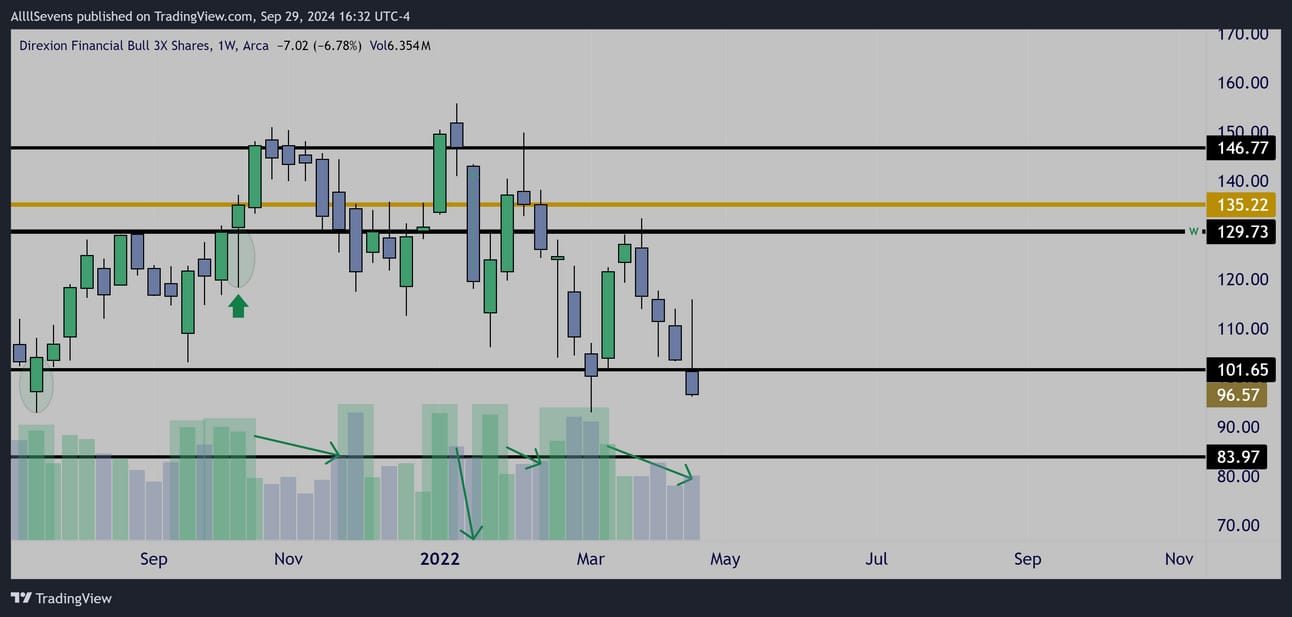
$FAS Weekly Interval
Last time price was in this area, institutions accumulated, and retail sold.
This adds conviction that s uccesful l reclaim would have fuel for large upside potential, best illustrated on the HTF $XLF chart.
It’s key to note that there’s no true confirmation of momentum in this sector yet.
It is very much sideways and while last week’s candle provides potential for a breakout this week, it needs confirmed over resistance, otherwise this could chop more before the breakout. We also have a monthly inside candle here.
Sign up for my next newsletter here.
It’s free.
Very soon, I plan to write a newsletter covering the China theme.
$FXI, $KWEB, $BABA, etc.
Once this $XLF breakout gets going, I will also be going in depth on some individual stocks inside the sector that may outperform.
One of those is $MA, which I will post about on X shortly.
I have already been tweeting about it a lot.
Make sure you follow me on X.
If you truly find value in my work, please consider upgrading your free subscription to AllllSevens+ for just $7.77 per month.
Click here to upgrade.
Some exclusive newsletter content is on the horizon.
Only AllllSevens+ members will be able to read it.
Upon upgrading, you will also get access to my Discord where I gather and collect my data throughout the week. It is NOT an alert service.
I take chart requests at any time in my Discord!
If you’re interested in tracking dark pool data and unusual options flow yourself, here’s my affiliate link for BlackBoxStocks, the platform I use:
http://staygreen.blackboxstocks.com/SHQh
If you like how my charts look, here’s my affiliate link for Trading View, the platform I use:
https://www.tradingview.com/pricing/?share_your_love=sevenparr
Feel free to DM me on twitter for the colors I use.
Lastly, if you’re looking for a Brokerage to trade stocks & options, here’s my referral link for Webull. They give you (and me) free stocks when you make an account and deposit money with this link:
https://a.webull.com/Nwcp9cTCDSzfJtjWL4
Reply