- AllllSevens
- Posts
- Speculators Run, Institutions Rule
Speculators Run, Institutions Rule
Unveiling $80B+ in Hidden Moves Across The S&P500
Seven Parr
February 26, 2025
Disclaimer
This newsletter presents my technical analysis and insights for informational purposes only. It is not financial, investment, or trading advice, nor is it a recommendation to buy, sell, or hold any asset. I am not a licensed financial advisor.
All content reflects my own personal opinions based on publicly available data as of February 26, 2025. I am not liable for any losses incurred by others.
Past performance is not indicative of future results.
Preface:
Short-term speculators are dumping the market while institutional players are making truly historic moves, accumulating massive positions through Dark Pools.
The horizontal lines on the charts I’m about to share represent the largest Dark Pool levels ever recorded each asset I’m analyzing—real institutional footprints, not magical technical analysis lines. On the right side of these levels, I’ve noted the dollar value behind them.
By analyzing candlestick patterns and the volume behind them at these levels, I uncover how institutions are positioning themselves, distinguishing meaningful moves from false or exploitable ones.
If you find the information in this newsletter valuable, subscribe with the link below and join my email list for more insights delivered straight to your inbox.
Also, make sure you’re following me on X (formerly Twitter): @SevenParr
👇
👉 https://allllsevensnewsletter.beehiiv.com/subscribe 👈
The S&P500
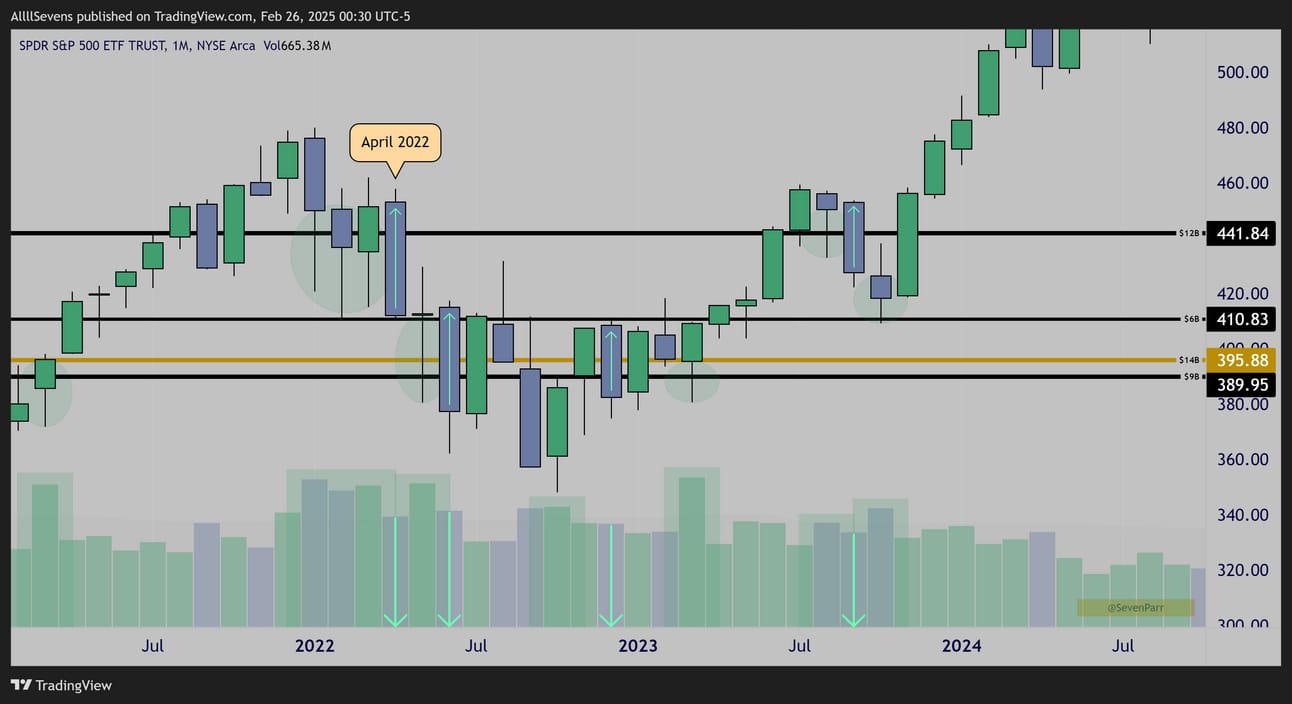
$SPY Monthly
The patterns above are the foundation of all my market research.
Let me explain what you’re looking at:
The horizontal lines are the largest Dark Pools ever recorded for $SPY.
High-volume lower wicks at these levels show institutional accumulation.
When subsequent candles push price lower on decreased volume, it actually confirms the accumulation taking place and creates “discounts”.
Every “loss of support” on this chart above—really just institutional discounts—paved the way for the epic 2024 bull market.
I want you to notice the size of the discount candles.
April of 2022 was THE largest candle in S&P500 history by dollar amount ( not percentage), and it was driven by short-term speculators—not institutions.
They did not participate.
This speaks VOLUMES (pun intended) about the stock market:
It is a wealth transferring machine, shifting money from short-term speculators to true long-term investors. Mind-blowing, really.
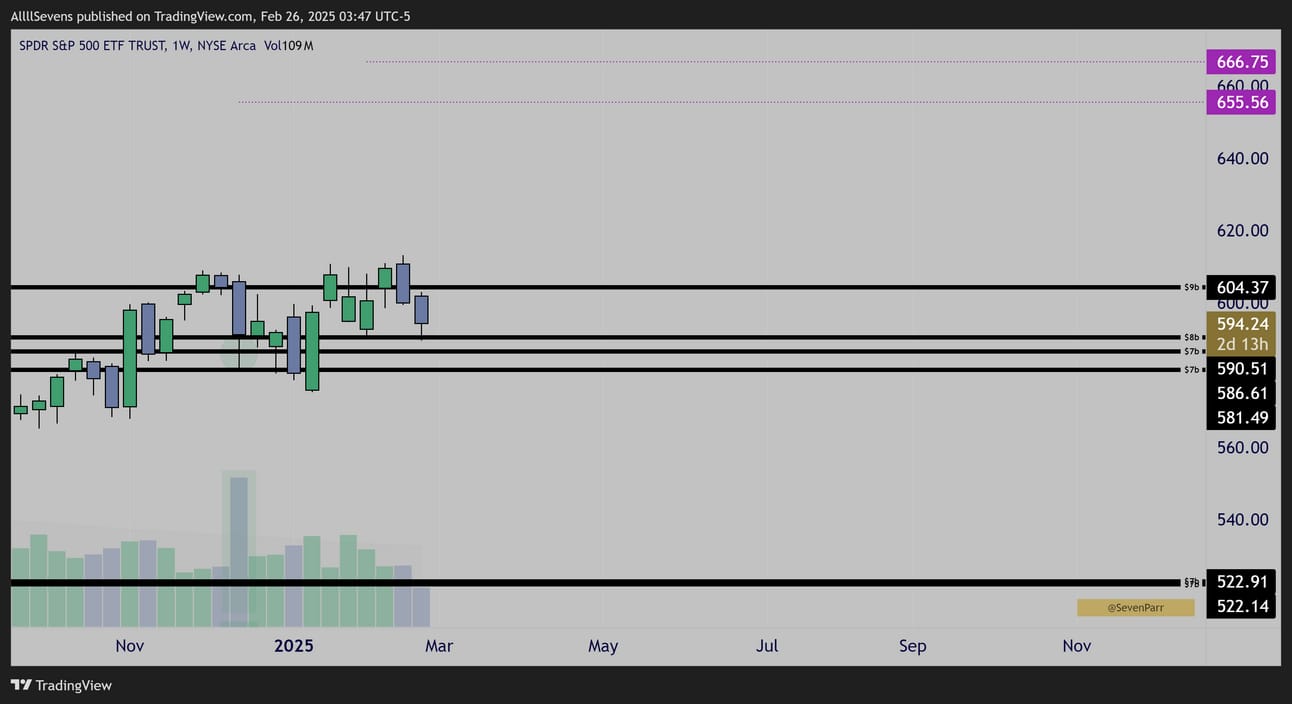
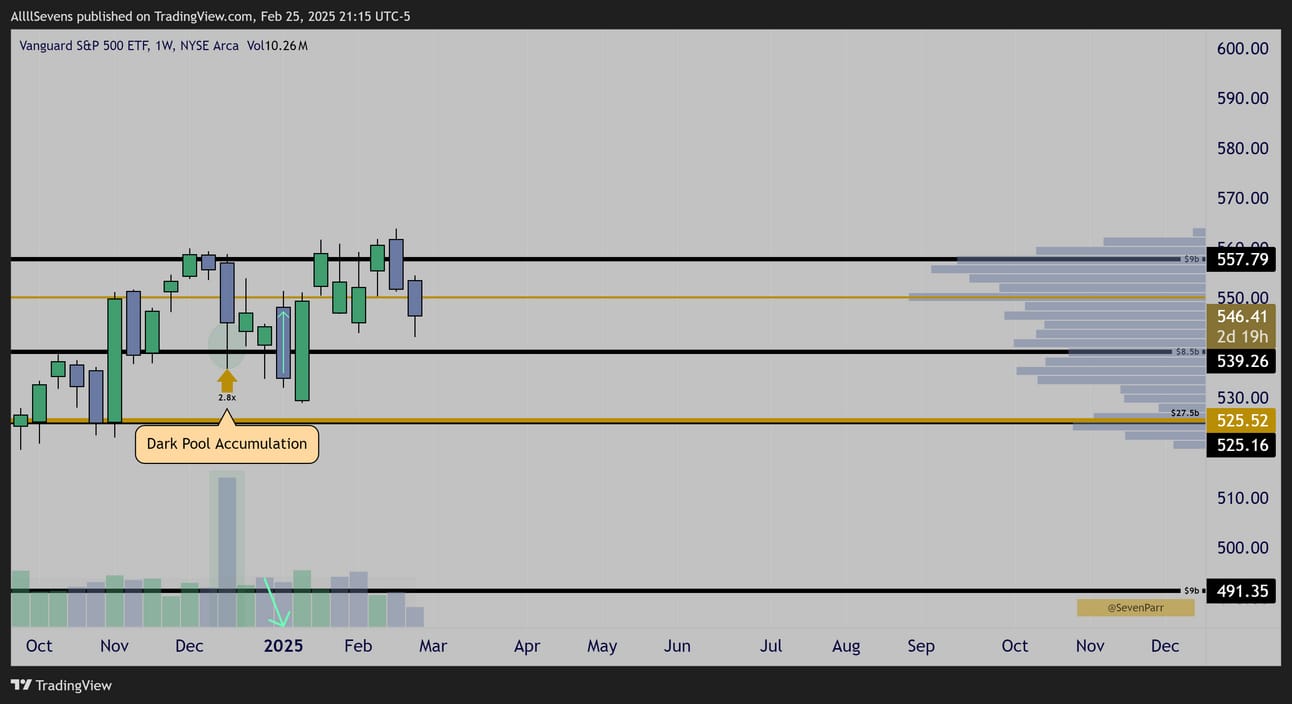
$SPY Weekly
Back in December, a very large Dark Pool accumulation campaign began.
And there’s way more to unpack here.
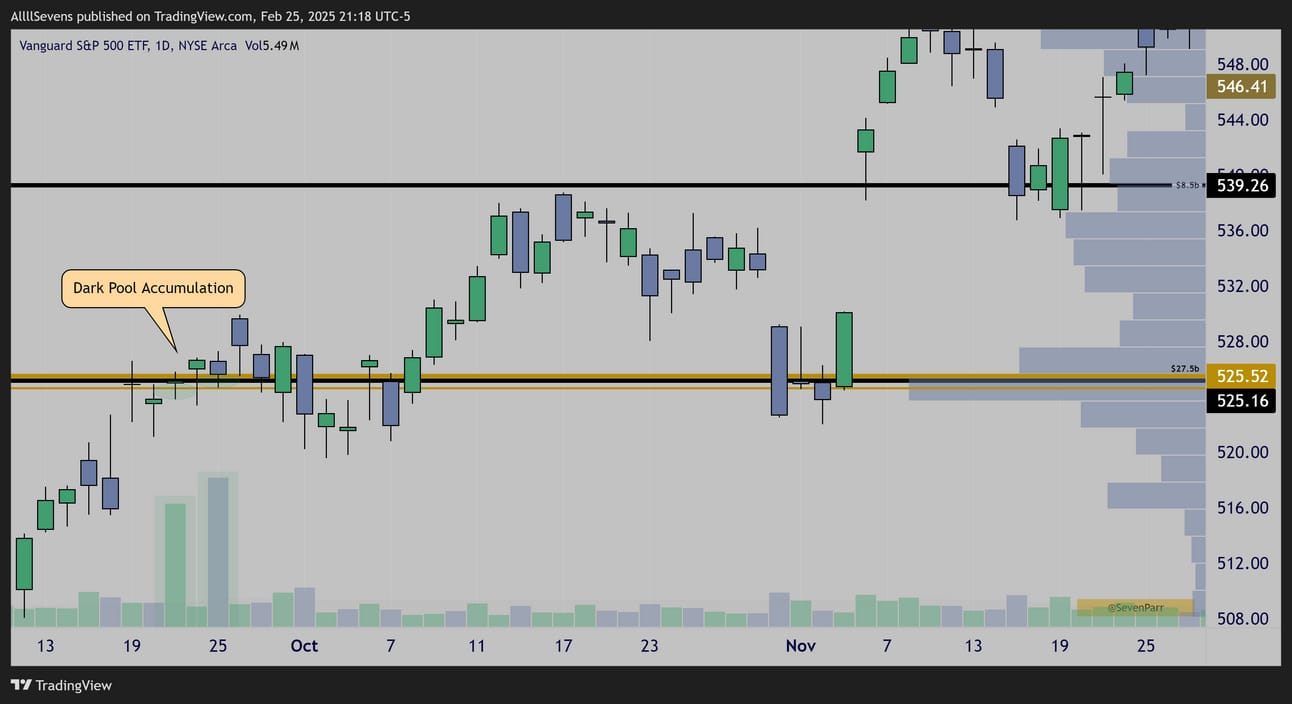
$VOO Daily
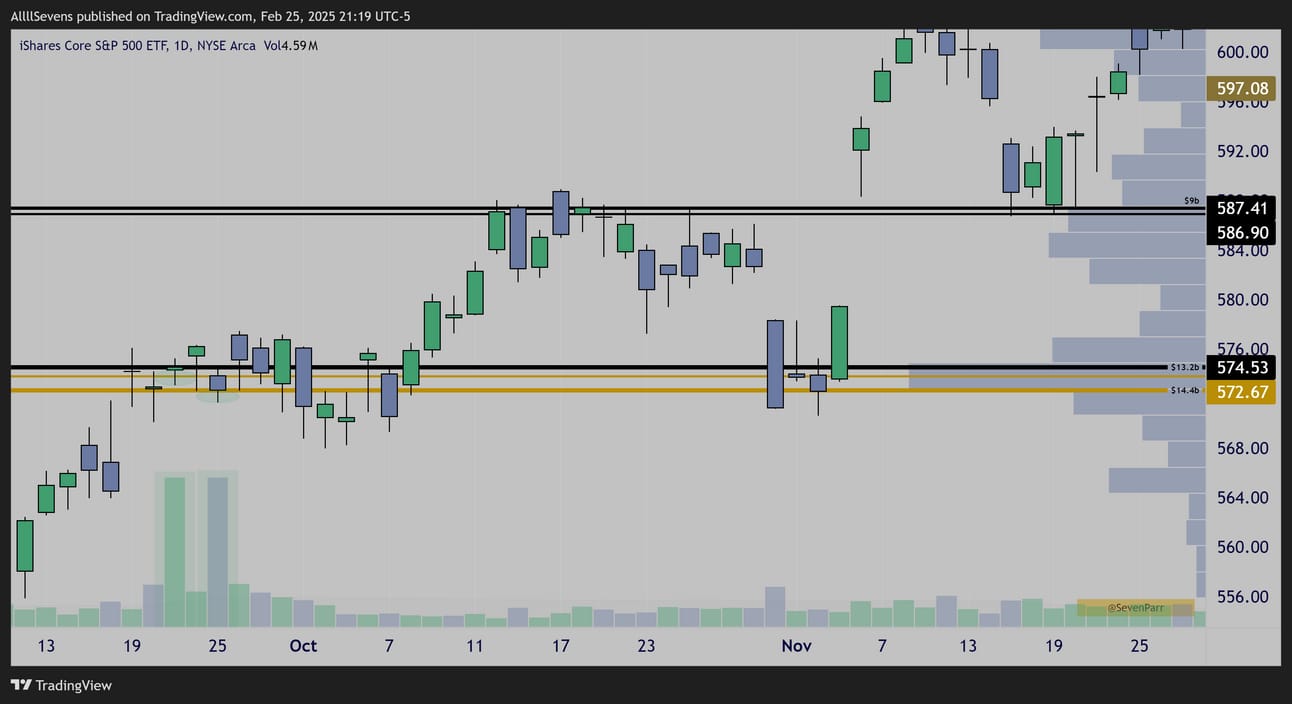
$IVV Daily
$VOO Weekly
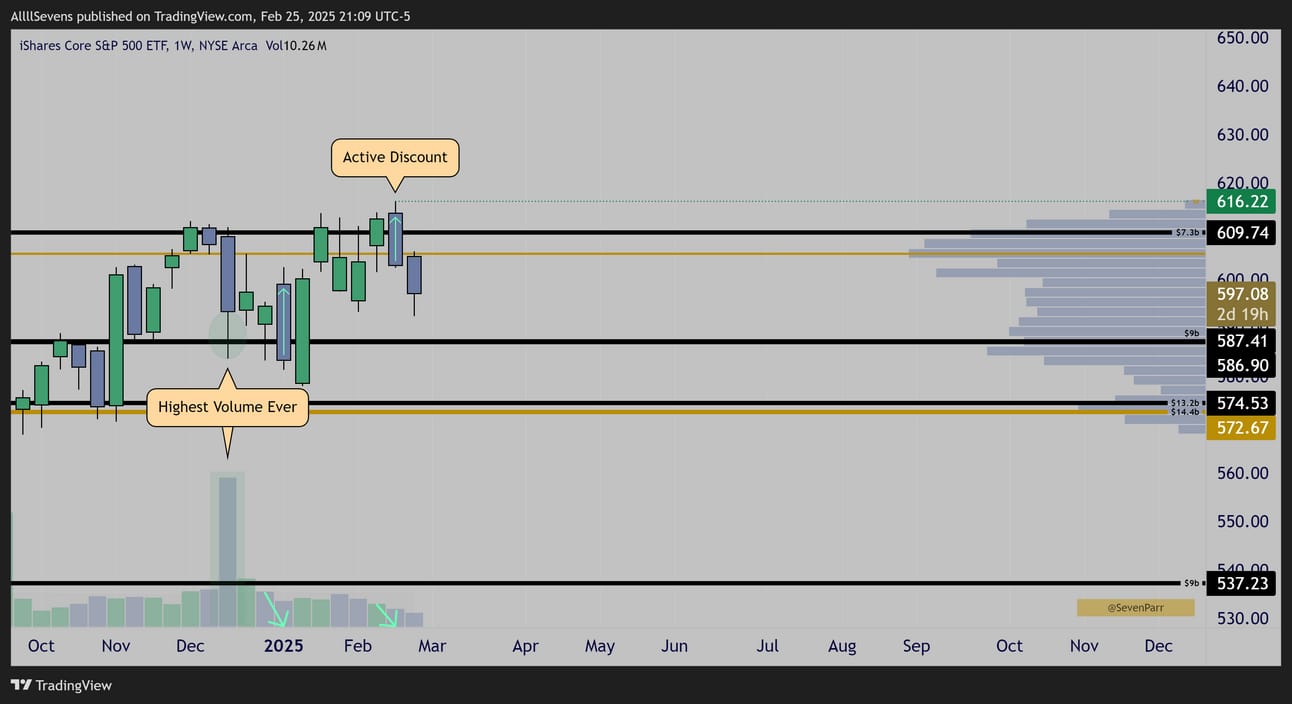
$IVV Weekly
$VOO & $IVV, like $SPY, track the S&P500
Same assets, different wrappers.
Recently, they’ve experienced MASSIVE Dark Pool accumulations, dwarfing $SPY’s 2022 levels and accumulation. I am blown away by this to say the least.
In 2022, the DP accumulation on $SPY totalled around $40B+
These DP’s on $IVV & $VOO today form a combined $80B+ accumulation.
That’s not including the accumulation also still occurring on $SPY.
$IVV is the only one showing an active discount candle.
Also jaw dropping is the weekly volume that accumulated the $9B Dark Pool @ $587.41 in December. This was the ETF’s highest volume EVER.
This is what I meant by “historic institutional investment” in the Preface of this newsletter. I’m witnessing a truly unprecedented level of long-term investment into the S&P500, potentially setting the stage for a rally even stronger than 2024.
Even the 3x leveraged S&P500 is being accumulated by institutions.
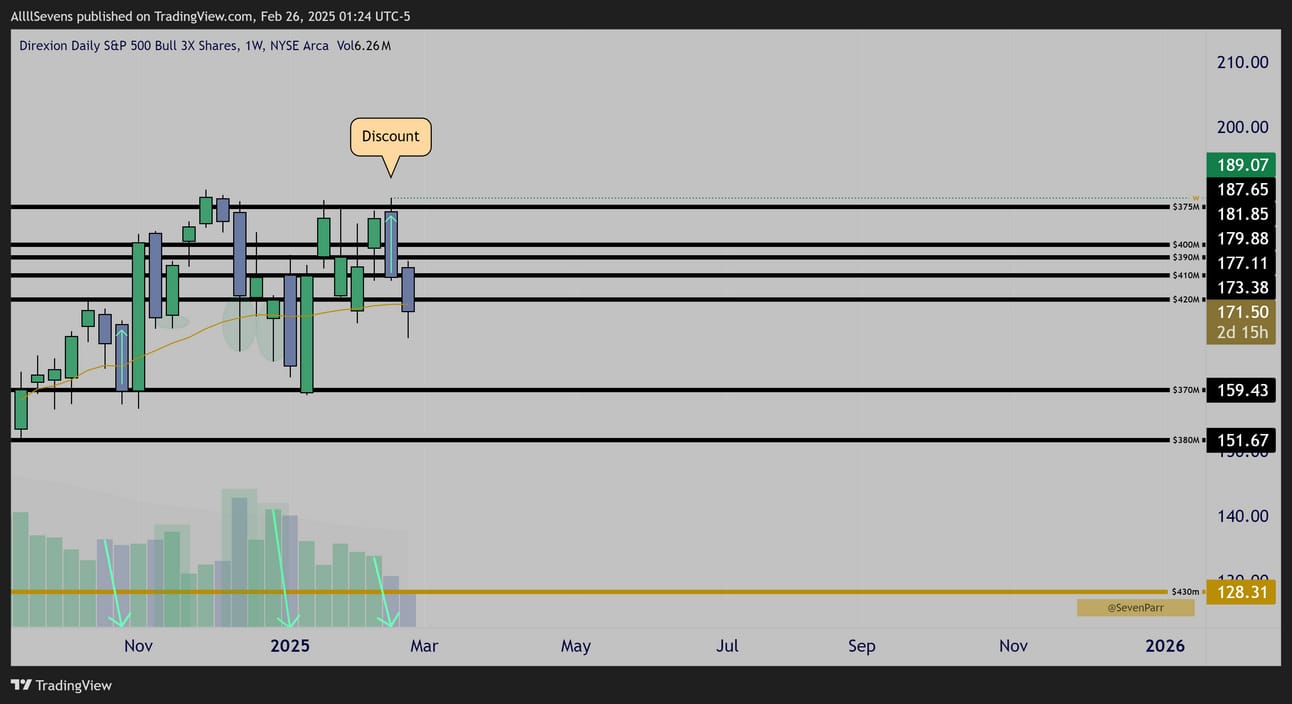
$SPXL Weekly
Crystal clear Dark Pool accumulation & the same discount as $IVV
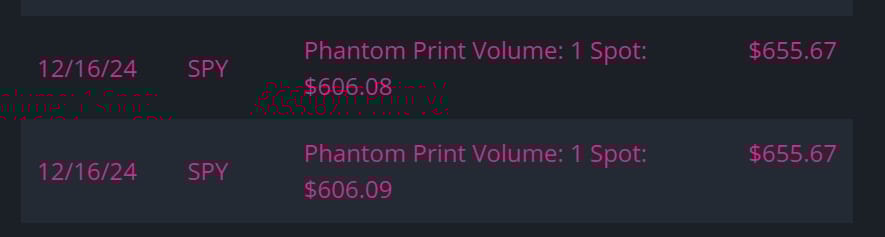
These are my current targets for the $SPY, assuming the market remains short-term bullish. $655-$666 area.
Here’s a very unique piece of options flow suggesting the market’s short-term bullish trend will remain in tact.
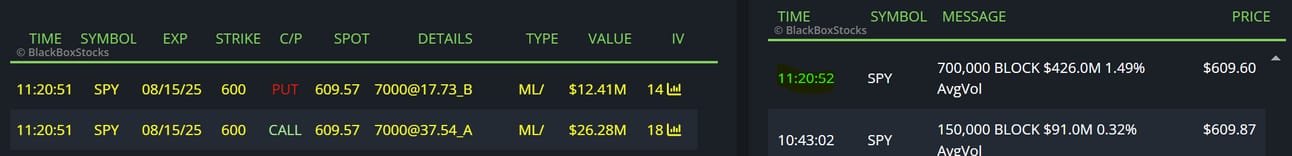
$12.41M Selling To Open 8/15 600p
$26.82 Buying To Open 8/15 600c
Tied to a $426M Dark Pool @ $609.60 which I have seen accumulated.
In my opinion, the S&P500 should continue higher over the short-term.
However, considering the Monthly chart I showed you at the beginning of this newsletter, there is also a possibility that the S&P500 experiences severe short-term downside right after major accumulations, creating further discounts.
So, as bad as I want to sell all my belongings to buy the S&P500 based on the information in this newsletter, I believe reservation is key and preparing for the worst keeps me grounded.
I simply can’t predict the market’s next move with certainty.
My strategy at this time is to dollar-cost-average both IVV & SPXL below last week’s highs where discounts were created. That’s it.
The only disadvantage to this strategy is if $IVV and $SPXL don’t stay discounted for long and I don’t get to buy as much as I’d like.
But, if that happens, I will pivot to the 11 sector ETF’s for SPY where surely something will still be discounted…
Information Technology - Tracks companies in software, hardware, and IT services.
ETF: XLK (Technology Select Sector SPDR Fund)
Financials - Covers banks, insurance, and investment firms.
ETF: XLF (Financial Select Sector SPDR Fund)
Health Care - Includes pharmaceuticals, biotech, and health care providers.
ETF: XLV (Health Care Select Sector SPDR Fund)
Consumer Discretionary - Encompasses non-essential goods and services like retail and autos.
ETF: XLY (Consumer Discretionary Select Sector SPDR Fund)
Communication Services - Features telecom, media, and internet companies.
ETF: XLC (Communication Services Select Sector SPDR Fund)
Industrials - Represents manufacturing, aerospace, and construction firms.
ETF: XLI (Industrial Select Sector SPDR Fund)
Consumer Staples - Covers essential goods like food, beverages, and household products.
ETF: XLP (Consumer Staples Select Sector SPDR Fund)
Energy - Tracks oil, gas, and energy equipment companies.
ETF: XLE (Energy Select Sector SPDR Fund)
Utilities - Includes electric, water, and gas utility providers.
ETF: XLU (Utilities Select Sector SPDR Fund)
Real Estate - Focuses on real estate investment trusts (REITs) and property management.
ETF: XLRE (Real Estate Select Sector SPDR Fund)
Materials - Covers chemicals, metals, and mining companies.
ETF: XLB (Materials Select Sector SPDR Fund)
Before diving into each of these, lets take a look at the Equal-Weight S&P500 ETF which provides great insight on overall market breadth.
RSP
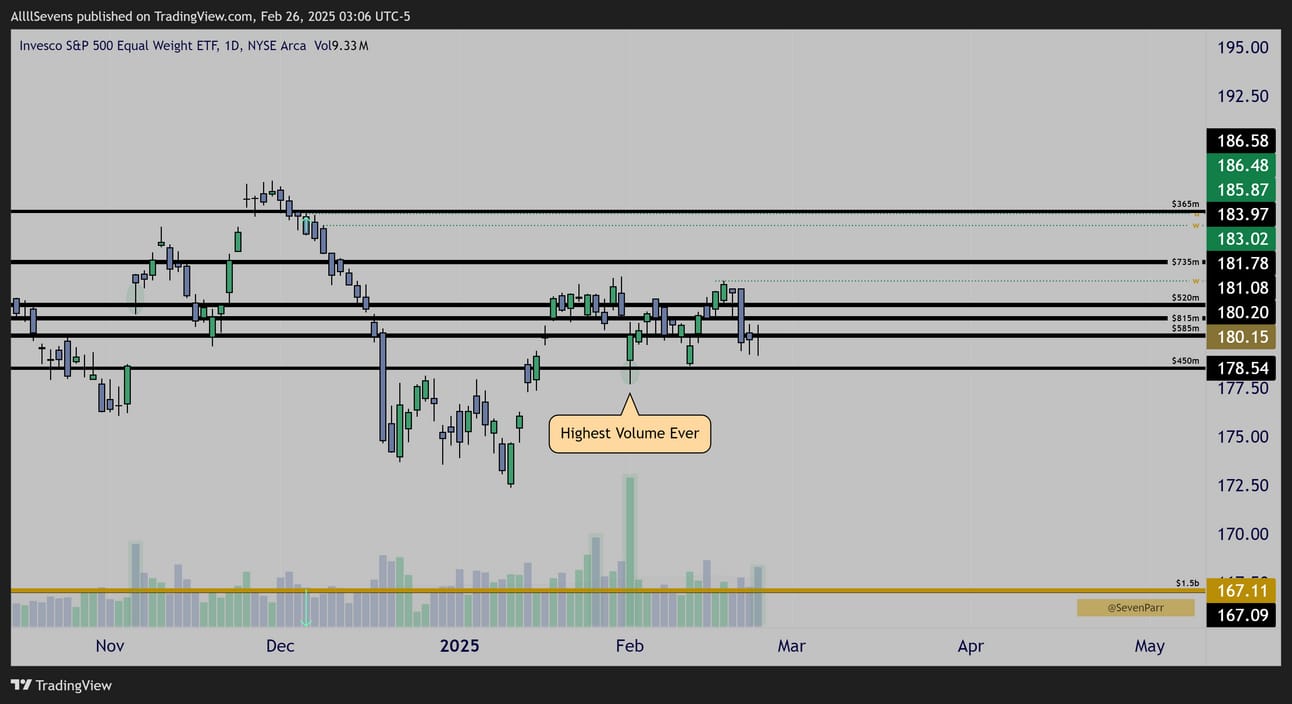
$RSP Daily
$RSP recently traded its highest volume ever and shows blatant Dark Pool accumulation off $178.54. Extremely notable long-term position being built.
Discount from $186.48 visible.
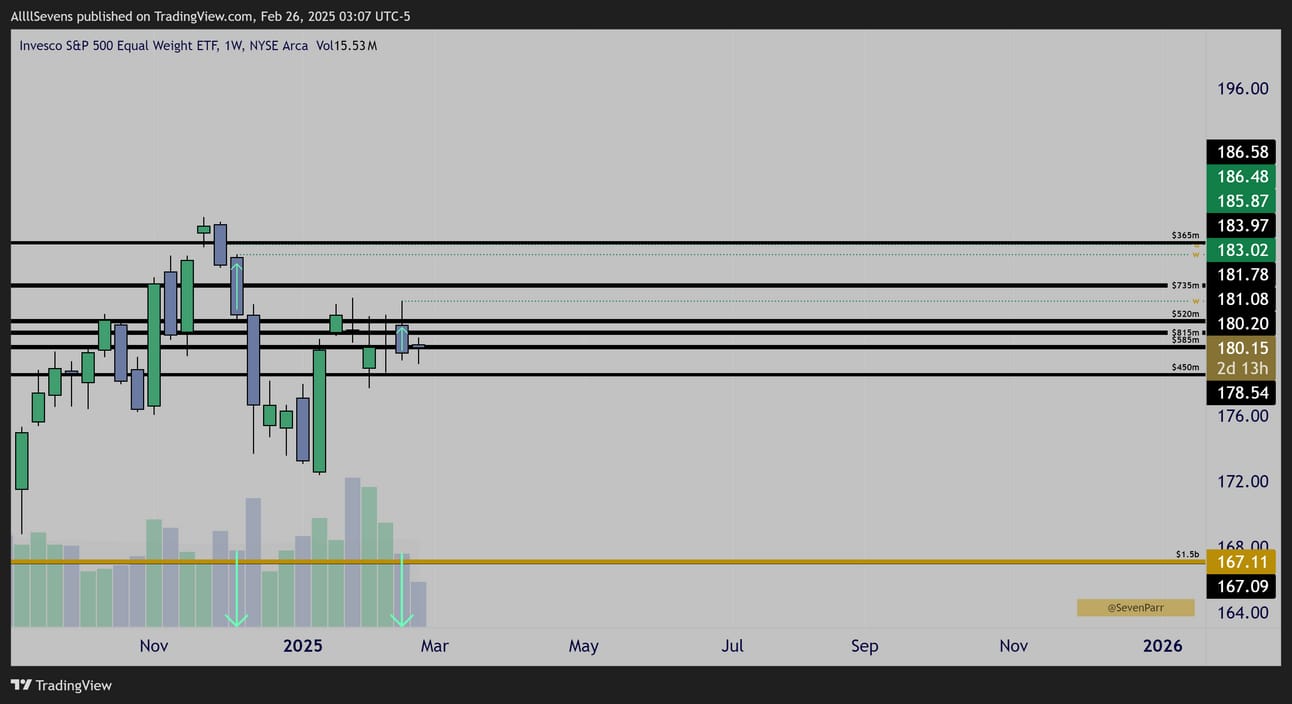
$RSP Weekly Interval
Two weekly discounts also visible.
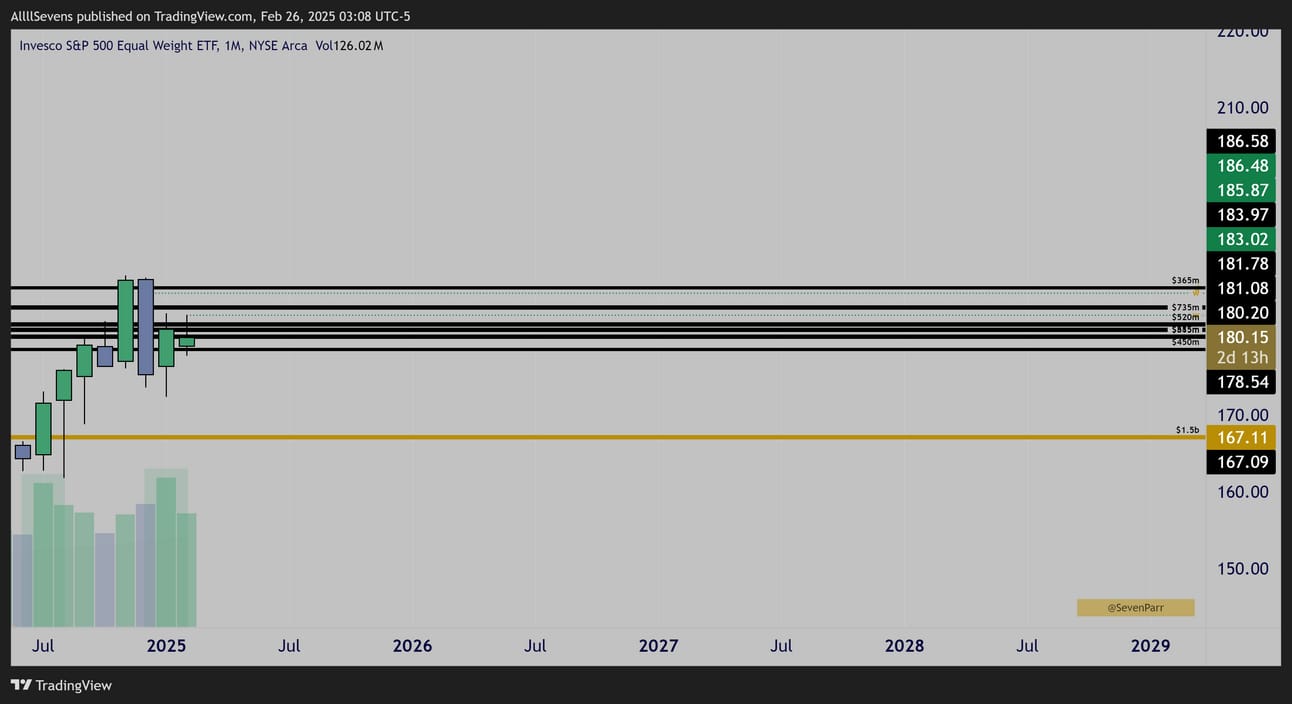
$RSP Monthly
Highest volume ever traded in January
This ETF is experiencing some extreme accumulation.
Highest volumes ever show HISTORIC accumulation.
There’s also some very bullish options flow recently.
Extremely risky stuff imo. Kind of surprising the are adding this much leverage alongside freakishly large share purchases.
I am sticking to my DCA strategy. Helps me sleep at night and ensures if things do go south short-term, I can buy the whole dip, but this is definitely cool to see.
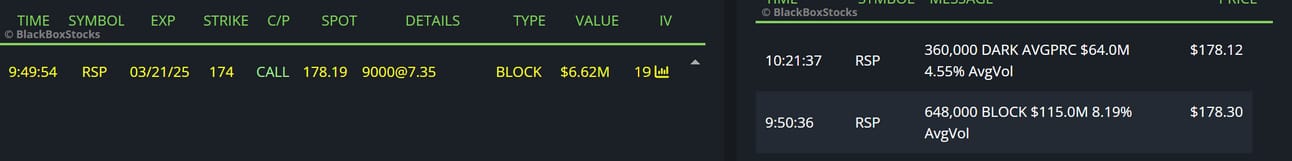
$6M Call Buyer + $115M Dark Pool

$2.5M Put Seller + $90M Dark Pool
XLK
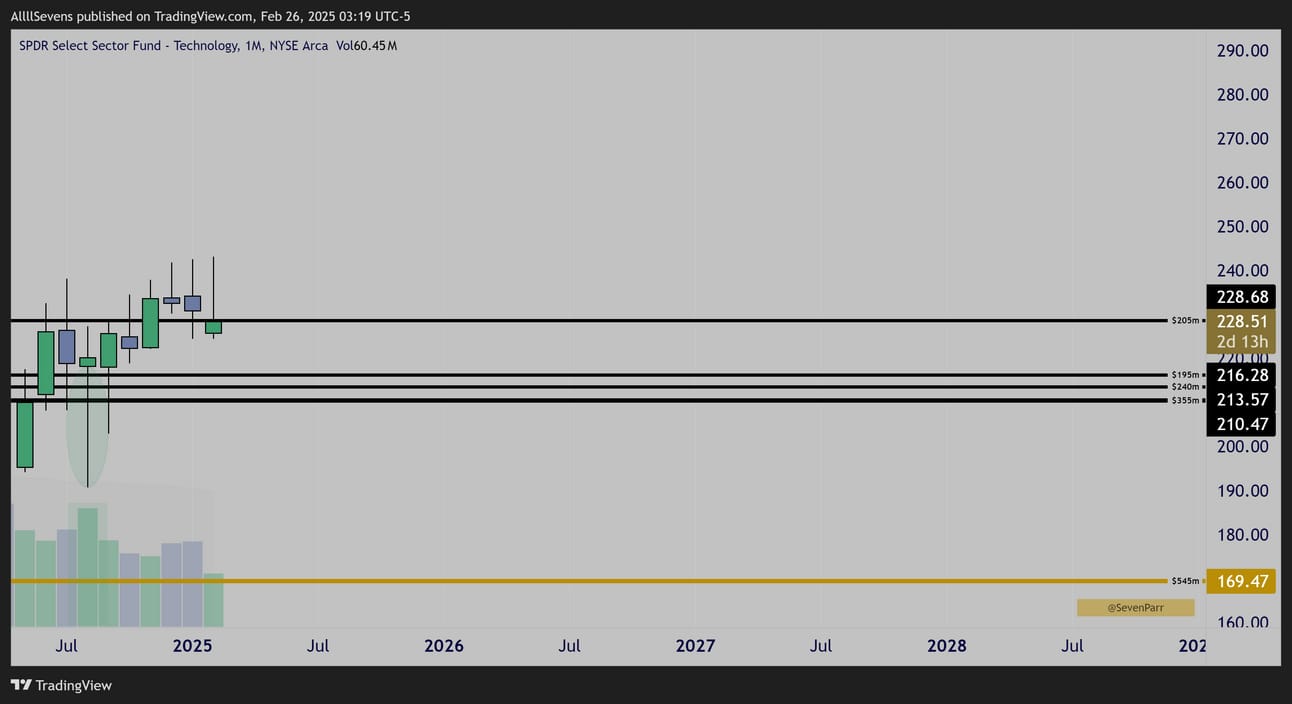
XLK Monthly
Significant Dark Pool accumulation in August
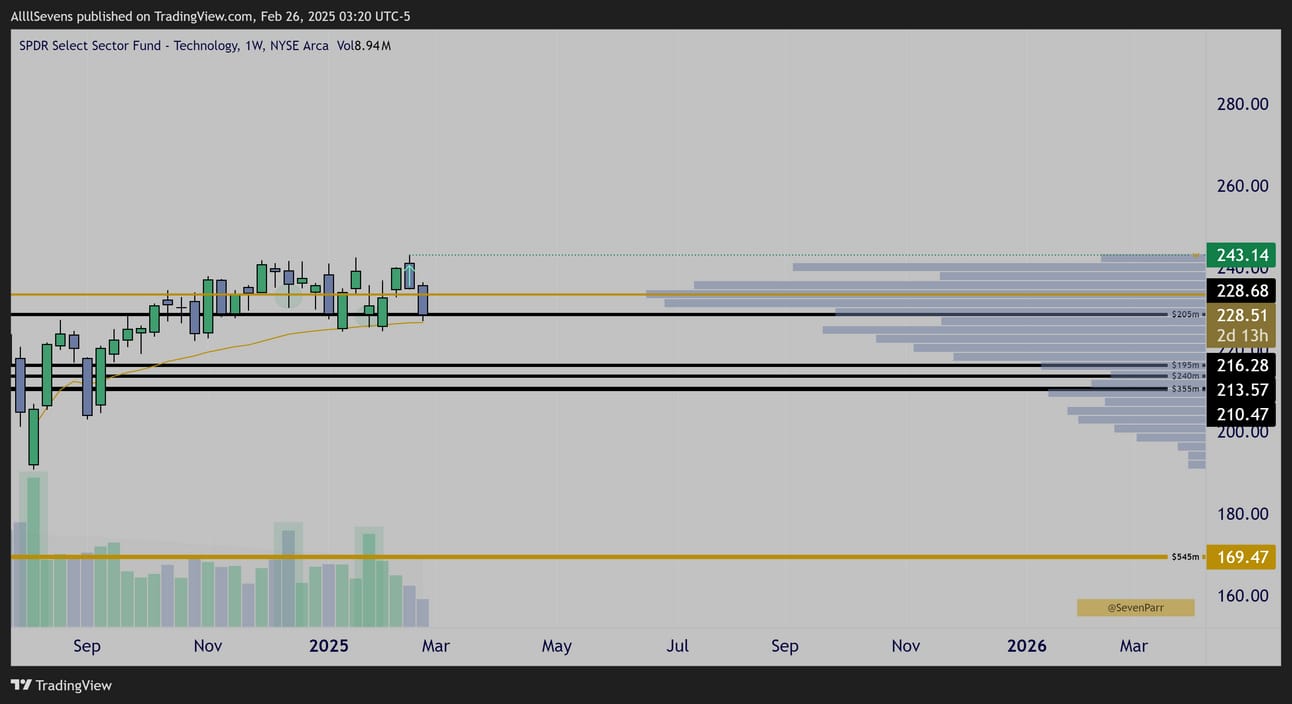
XLK Weekly
Discount created last week.
The options flow here been especially active, which is honestly a bit shocking because they’re not buying a lot of time, and they’re buying calls on TECL…
The 3x leverage Technology ETF 🤯
Like RSP, I personally have zero interest in the short term bet here, but it’s cool to see. I have been buying commons, that’s it.
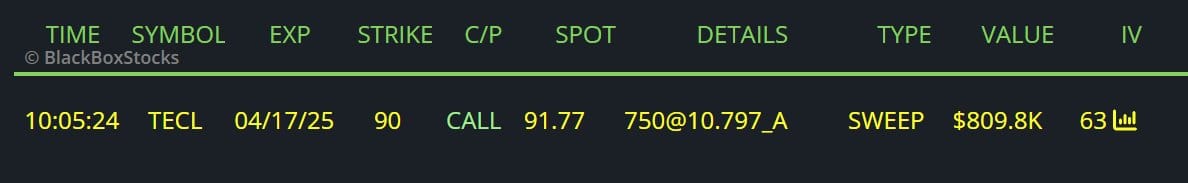
$800K Call Buyer
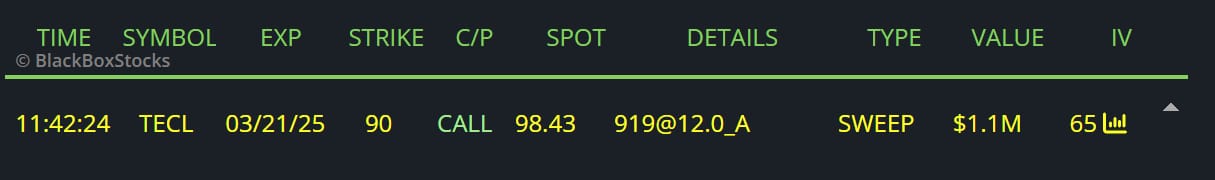
$1M Call Buyer
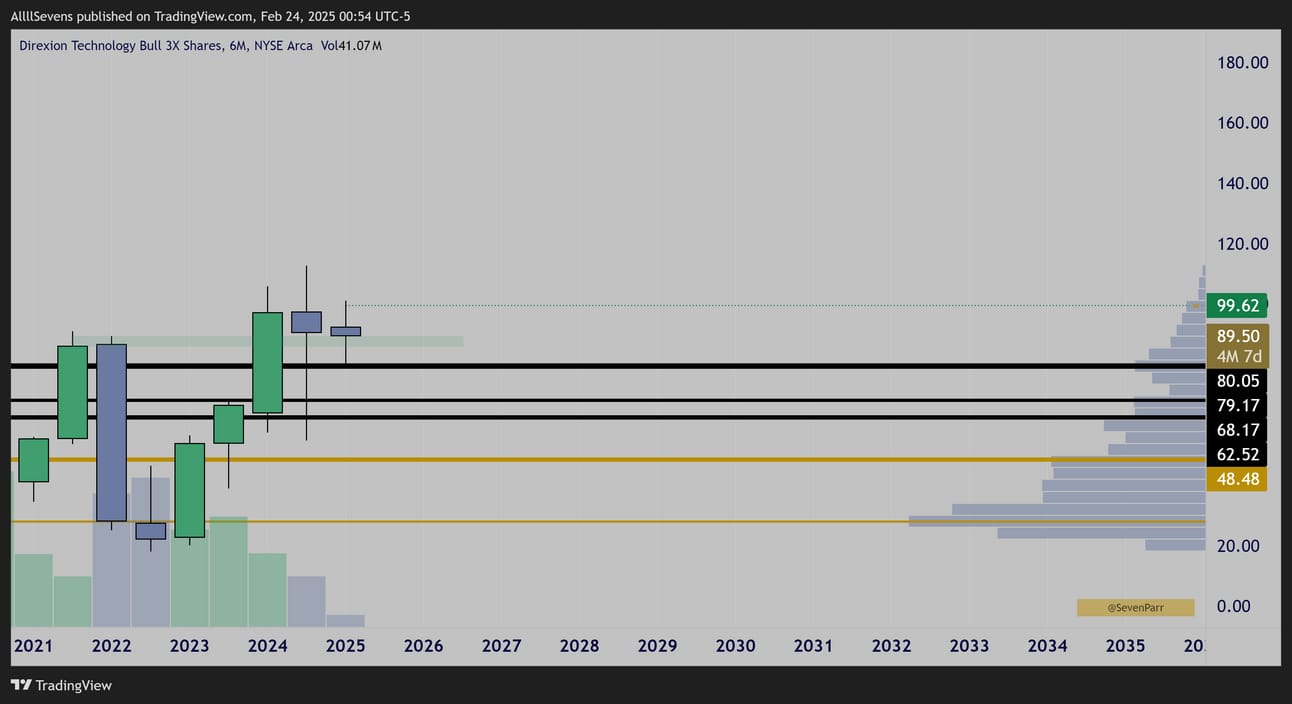
$TECL 6 Month Interval
I’m just trying to piece together why / how a bet like this could work.
This looks like a successful breakout, retest, and bounce off prior ATH’s.
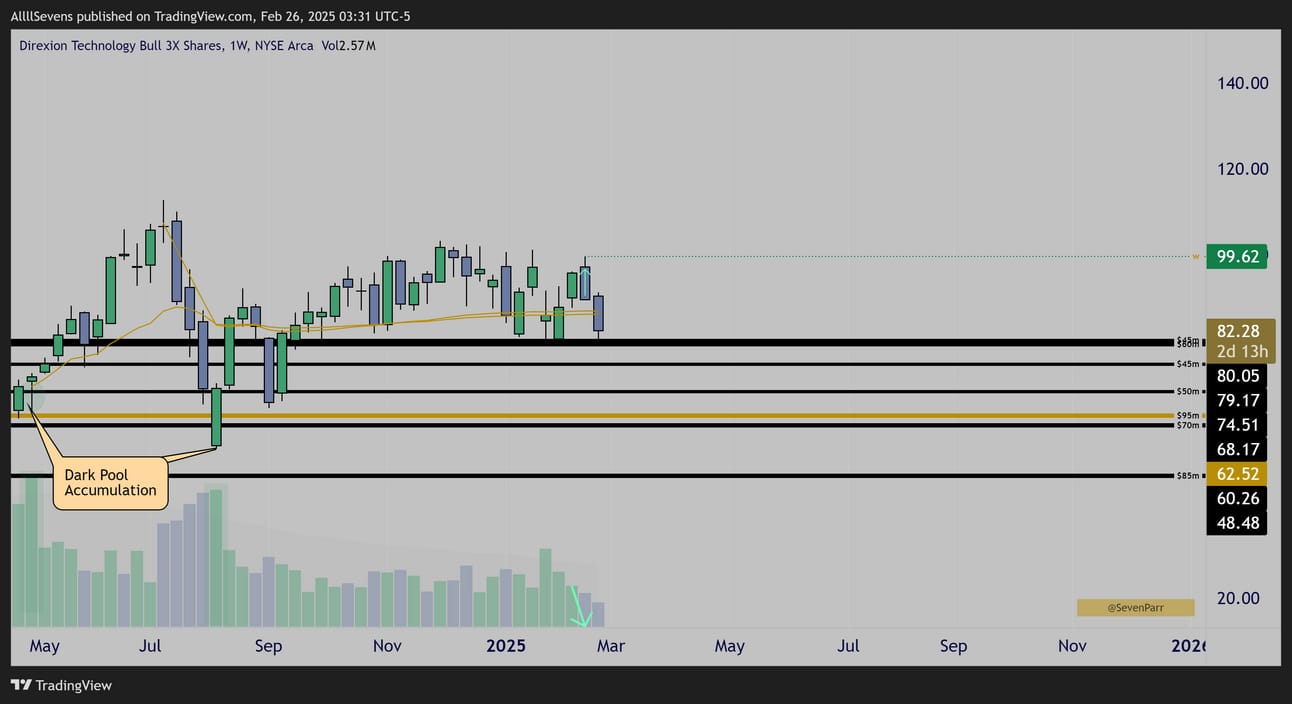
$TECL Weekly
There has been some very notable accumulation here in the $60’s
Same discount created as $XLK last week
XLV
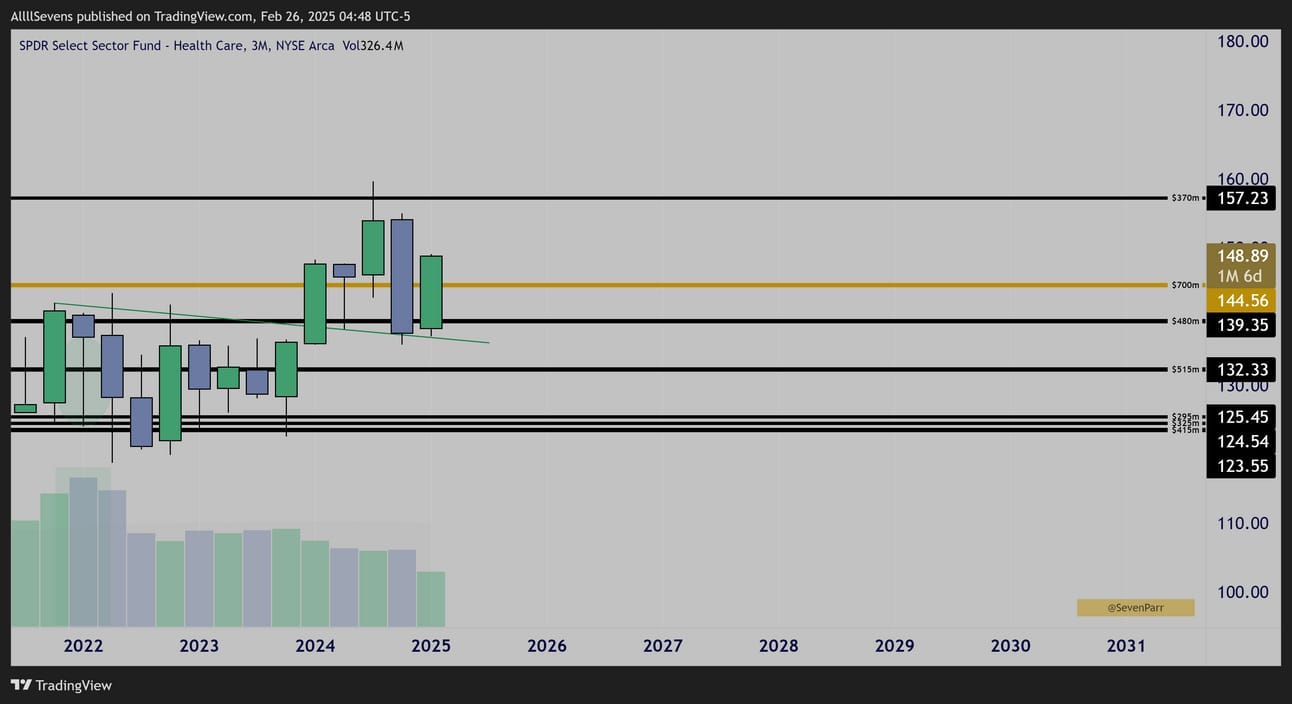
XLV Quarterly
Ver strong Dark Pool accumulation in 2022 but significant underperformance despite this…
Recently retested and bounced from prior ATH’s showing that we may finally see some relative strength here.
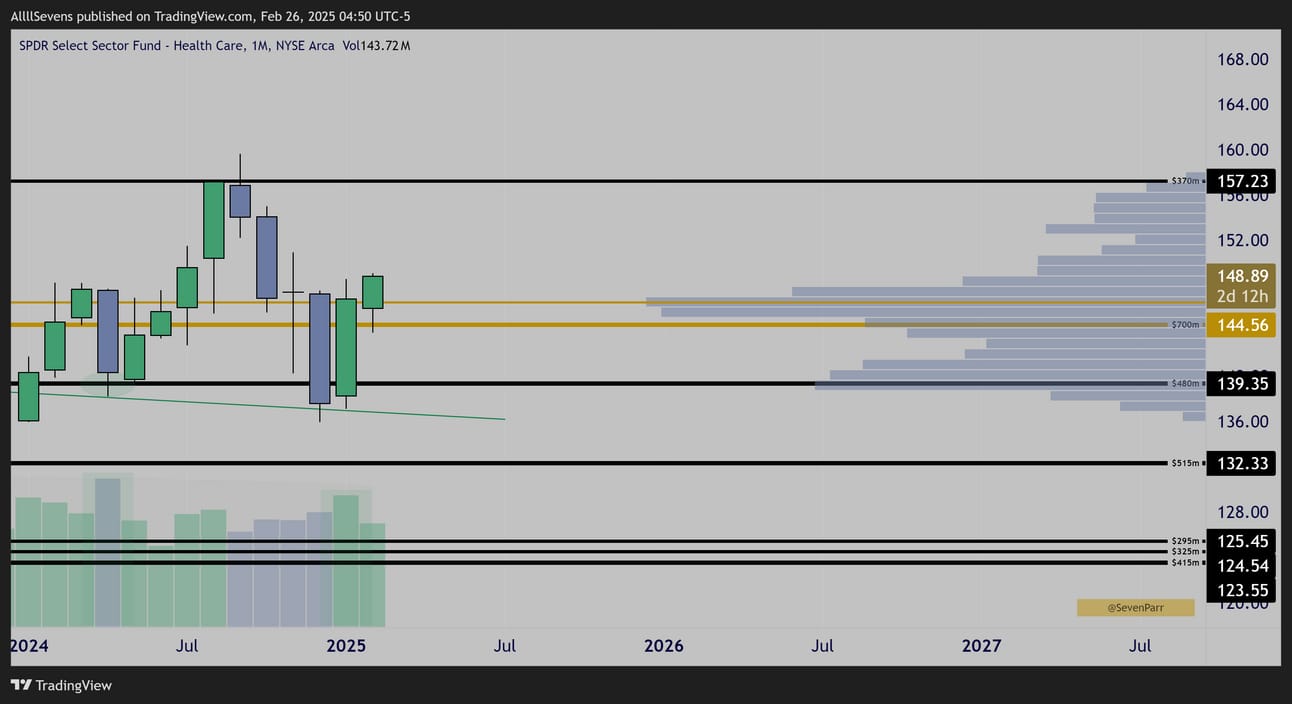
XLV Monthly
Dark Pool accumulation off $139.35 back in April of last year.
January’s price action formed an inside candle on increased volume which could be a strong upside reversal pattern…
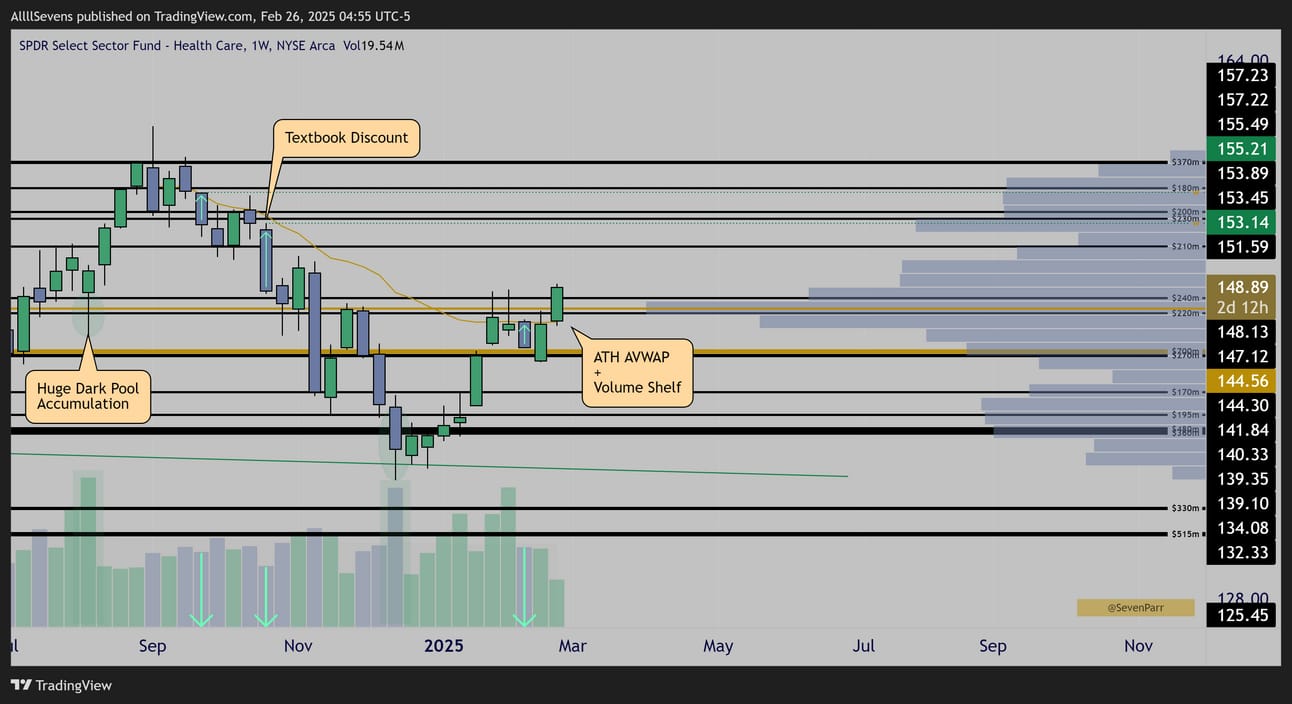
XLV Weekly
A few things to cover here.
#1- In August, this $147.44-$148.13 DP cluster saw clear accumulation.
#2- The sell off from ATH’s shows two discounts, the second one being especially notable. Just a massive candle down with absolutely zero volume.
#3- Price is now reclaiming the August accumulation level which coincides with a break over ATH AVWAP (trend) as well as a large volume shelf.
This is a huge reclaim of a previously accumulated DP’s / volume shelf, plus breaking downtrend resistance.
I’ve got to say, this looks amazing.
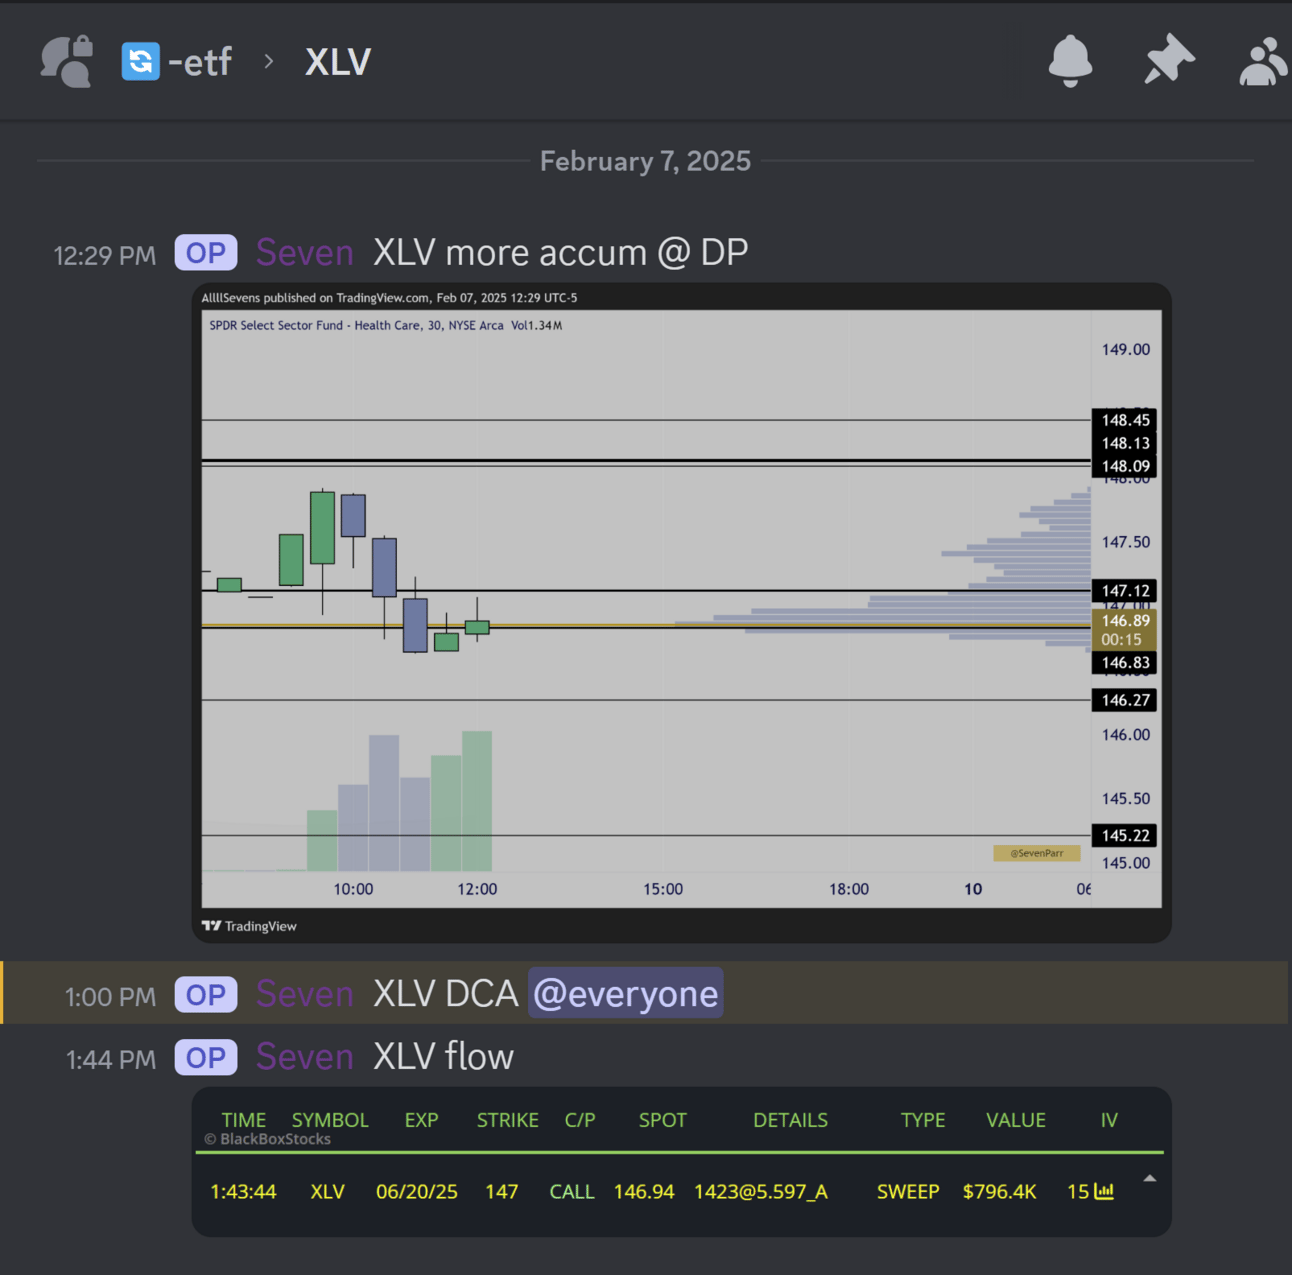
$800K Call Buyer into June 147c
There was some flow here the other day which I shared exclusively to AllllSevens+ subscribers. This gave me conviction to DCA stock, which I notified in Discord. I’ll talk more about it my premium service later.
Overall, this Sector looks amazing. I’m actually considering the calls here.
XLF
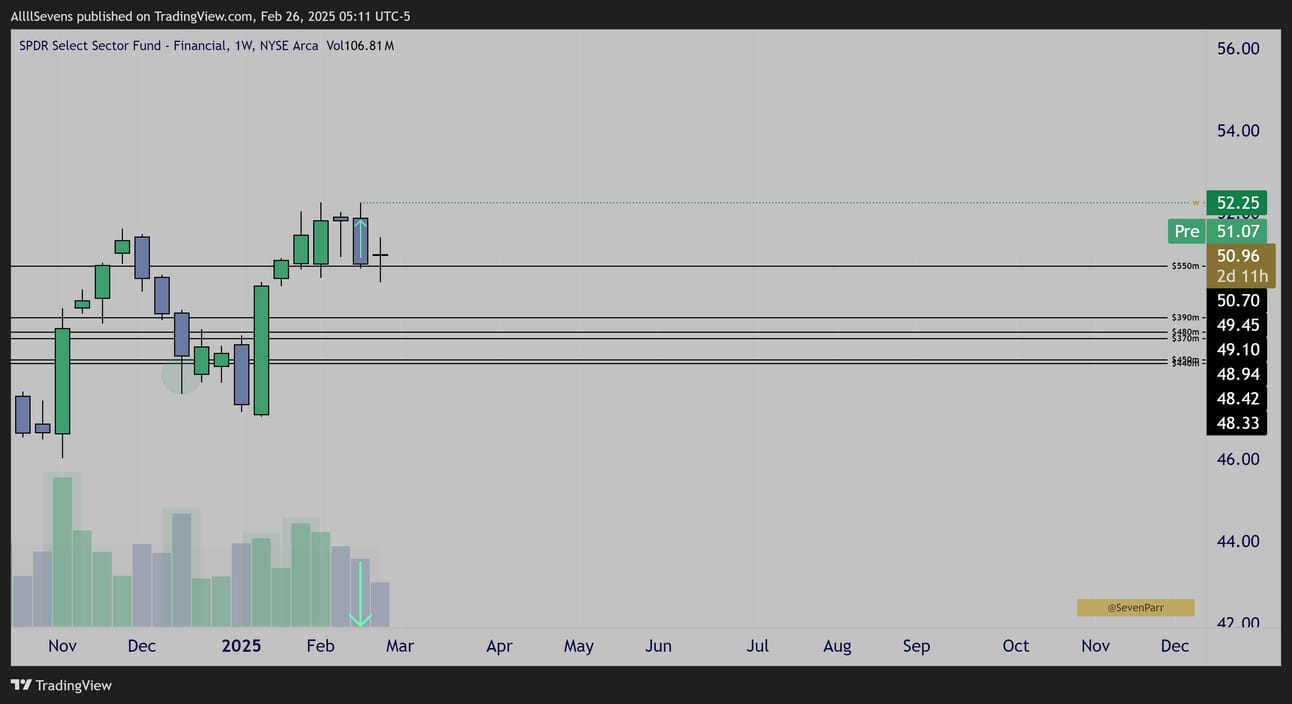
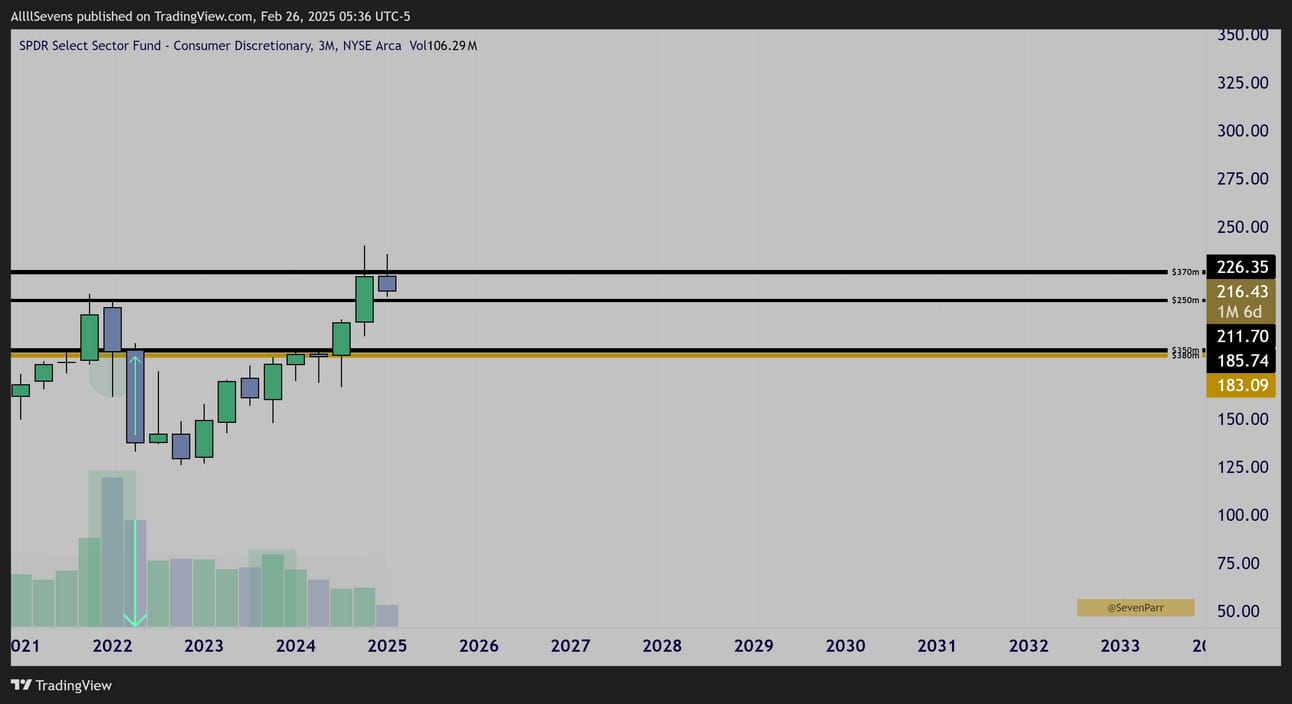
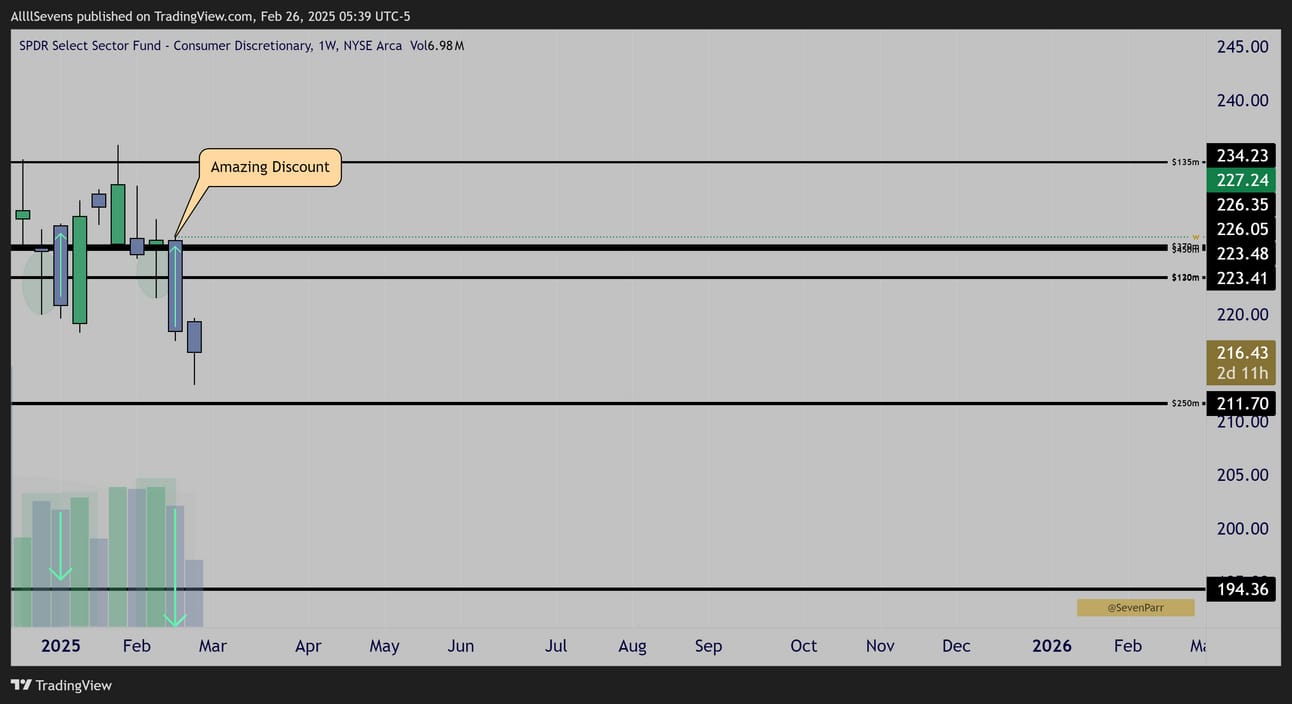
XLF Weekly
Very constructive patterns here over the last three month.
Discount formed on last weeks sell.
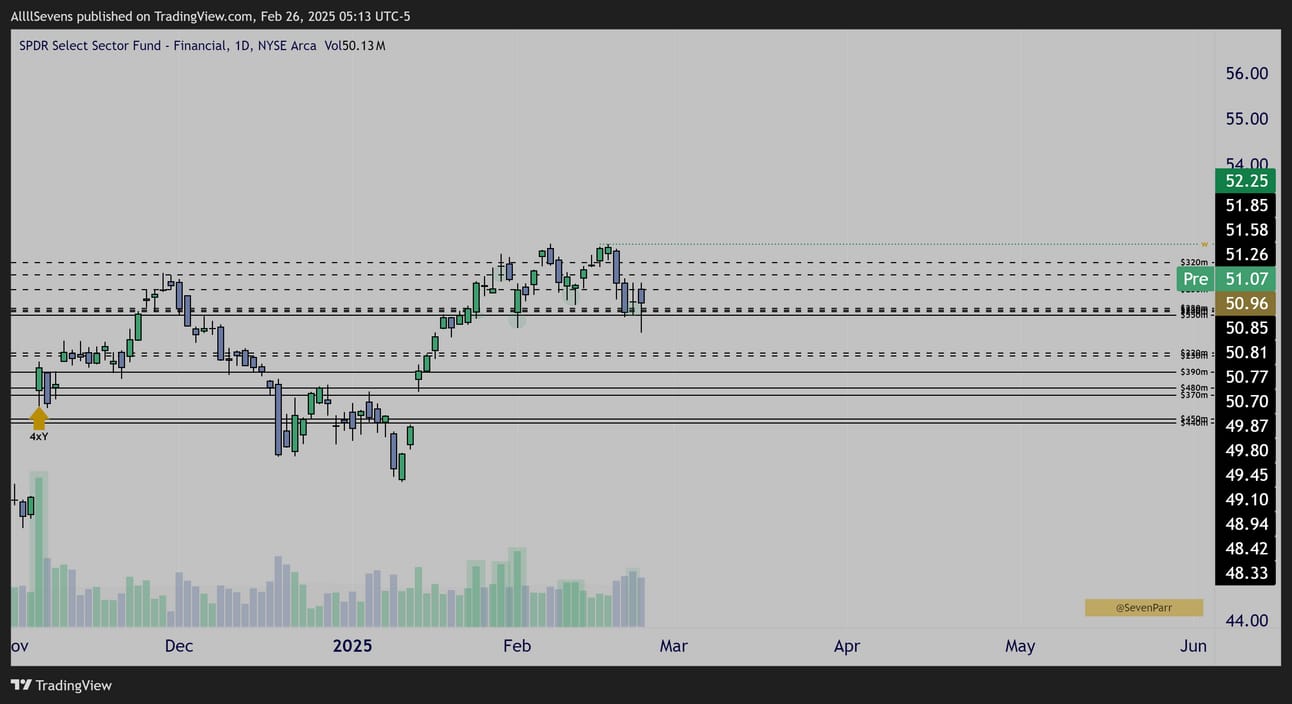
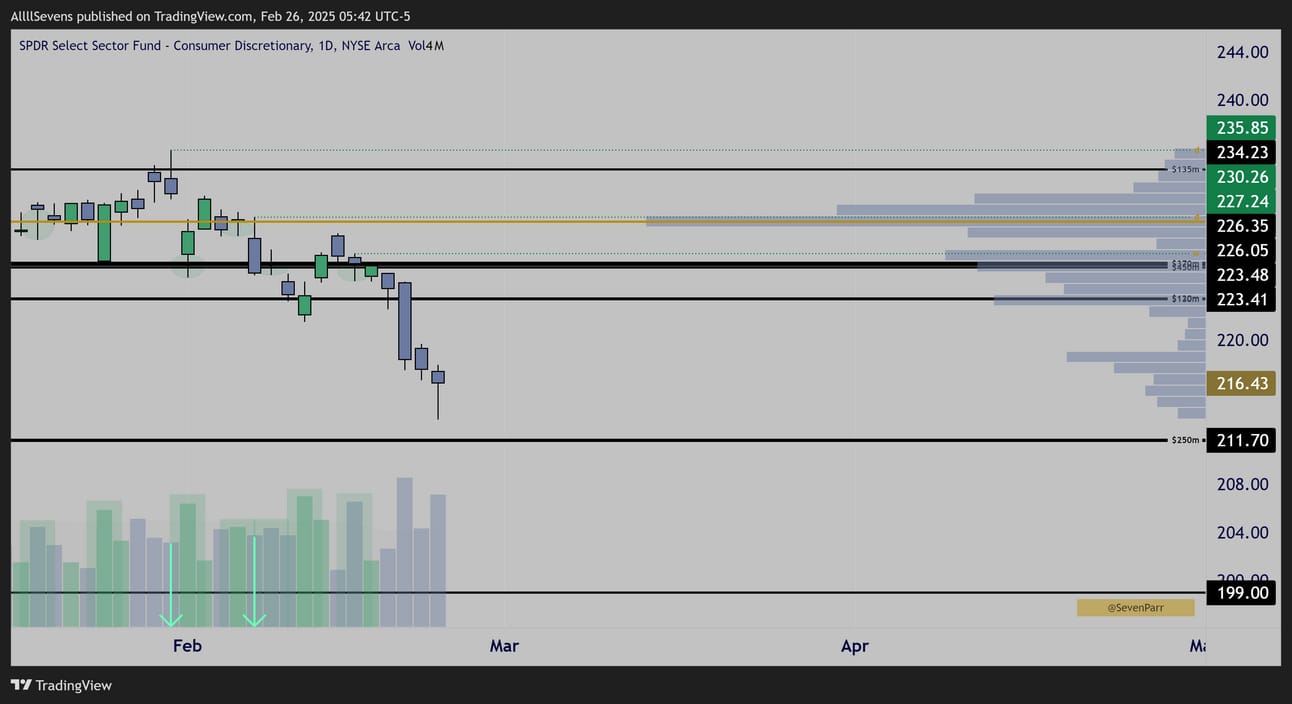
XLF Daily
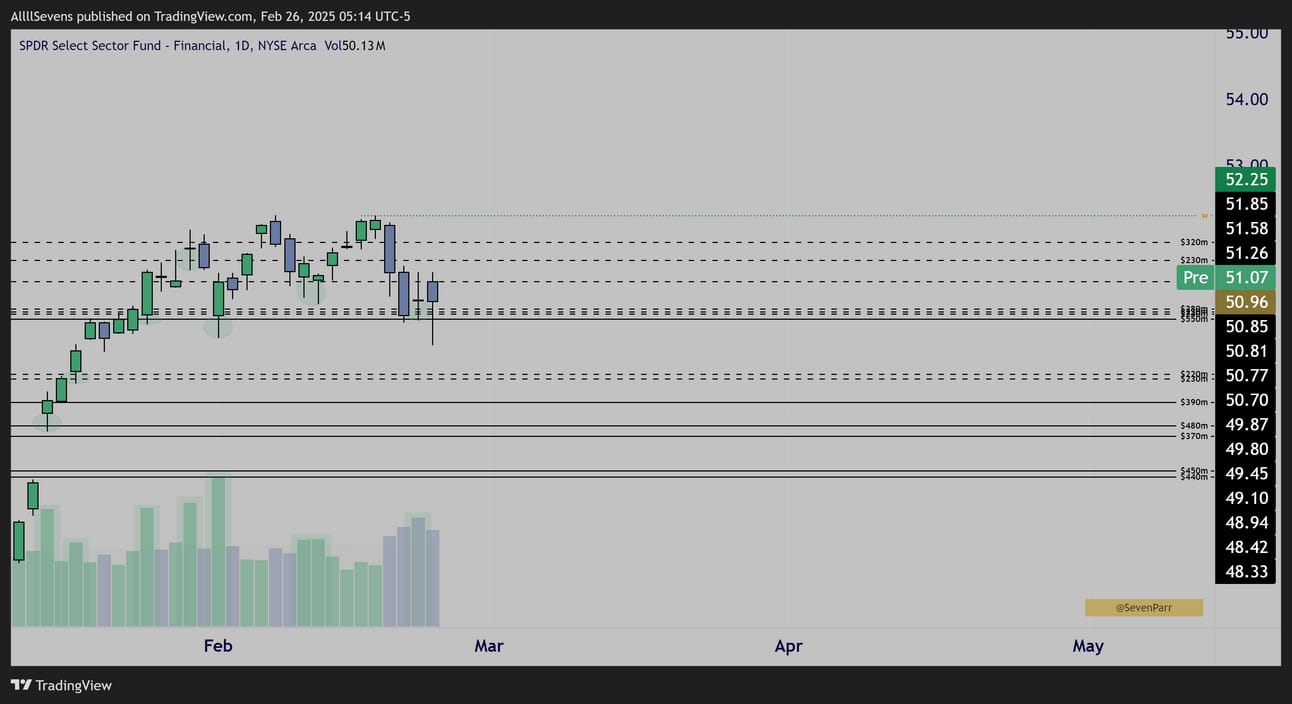
XLF Daily
I find this chart especially extra-ordinary.
When the entire market gapped higher in November on Trump winning the U.S. election, this sector gapped up the most by far.
And it did so on amazing volume. 4x more than its average, and it’s highest in over a year! On top of this, so many stocks in this sector have reported earnings recently and formed Power Earnings Gaps. Strong momentum and relative strength in this sector.
$BAC is the individual stock I am most focused on.
I wrote a premium newsletter on it here.
There’s more to this story though-
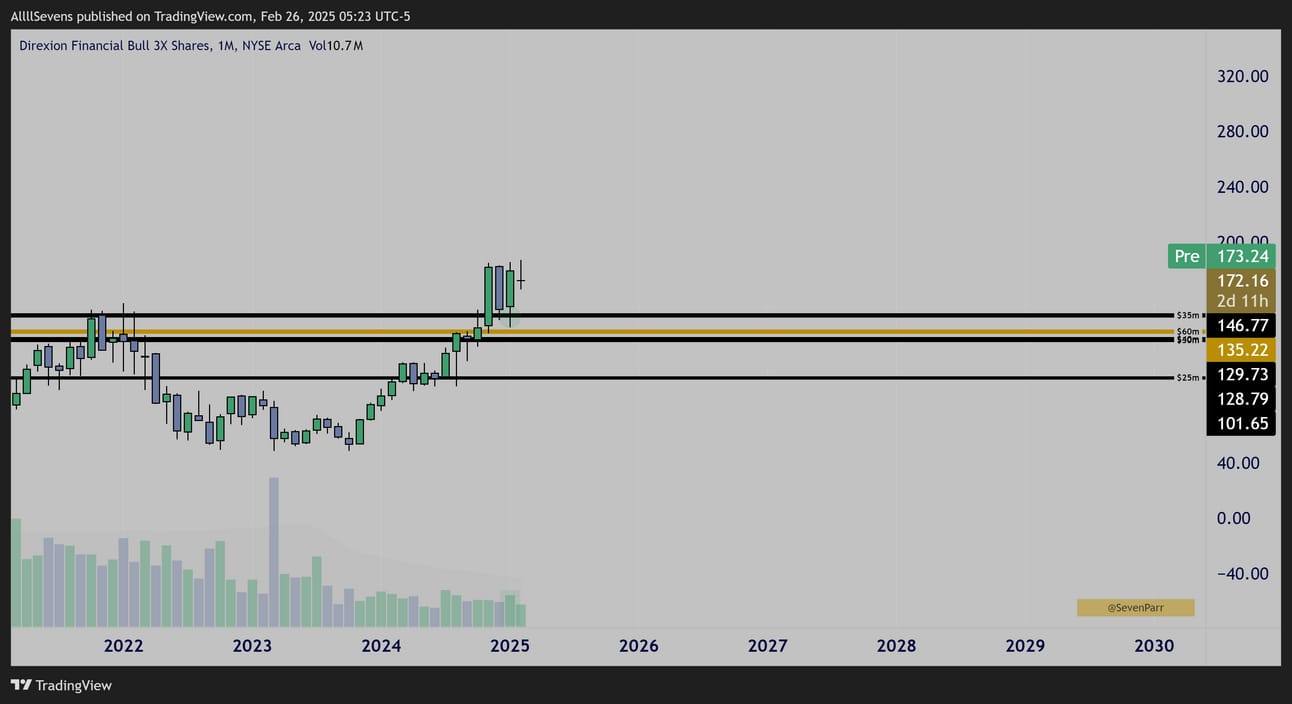
FAS Monthly
The leveraged XLF, the FAS, has been compressing over its prior ATH for three months now. Last month it formed a perfect hammer candle with an increased volume lower wick off Dark Pool…
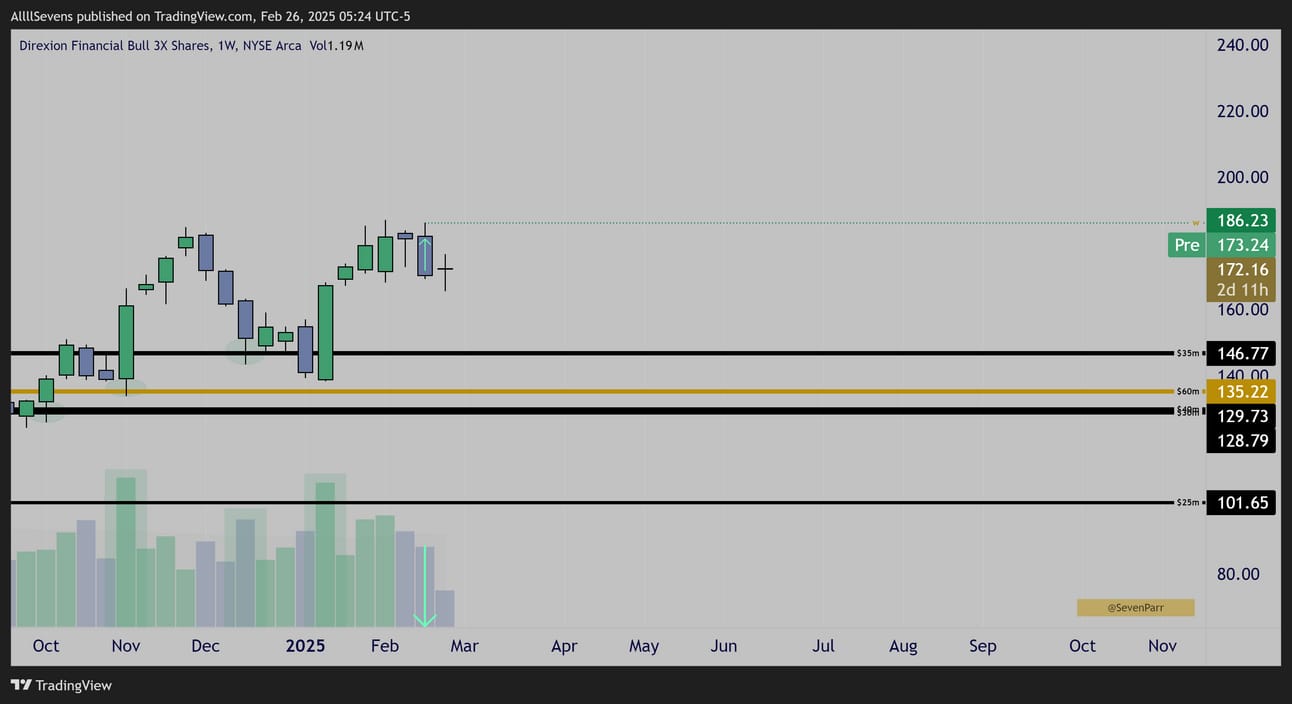
FAS Weekly
Stellar Dark Pool accumulations. Somehow looks even better than the XLF itself.
There is some 5 star flow active here as well.
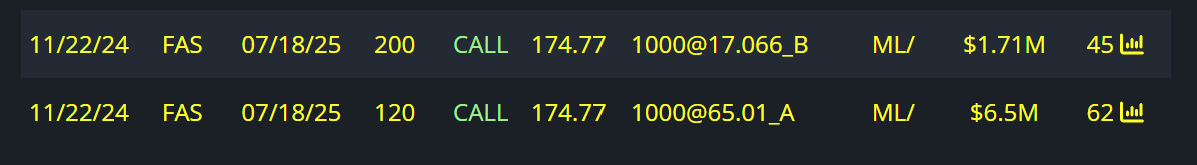
$1.7M Sell To Open 7/18 200c
$6.5M Buy To Open 7/18 120c
Bull Debit
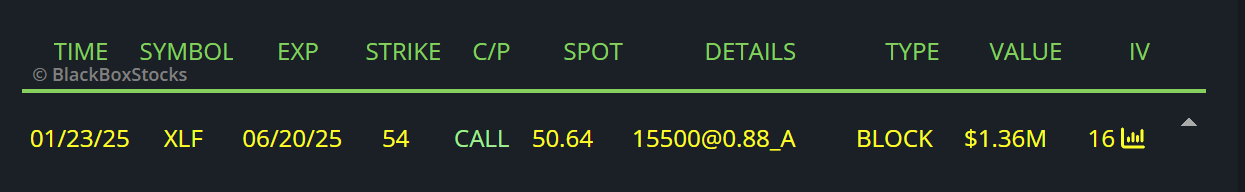
$1.3M Buy To Open June 54c
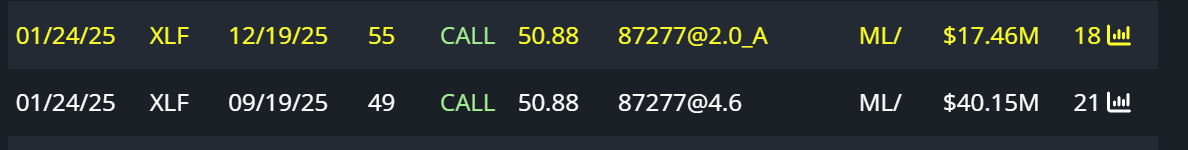
$17M Buy To Open 12/19 55c
$40M Sell To Close 9/19 49c
Roll
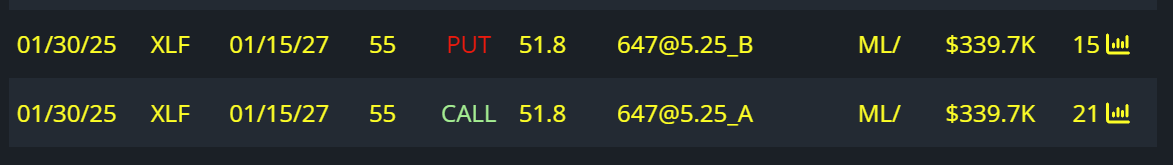
$339K Selling To Open 1/15/27 55p
$339K Buying To Open 1/15/27 55c
Risk Reversal
By far my highest conviction short-term setup at the moment.
This is my largest weight sector long-term as well.
I have been buying hand over fist. XLF & some FAS.
I think the calls could work here, easily.
XLY
XLY Quarterly
Highest volume EVER accumulating Dark Pool in 2022. Historic.
Similar to XLV, this has underperformed relative to SPY despite seeing absolutely amazing accumulation. I think it’s just a matter of time until it comes into rotation very hard. Especially when I see the weekly chart…
XLY Weekly
Perfect Dark Pool accumulation and a textbook discount candle last week.
One of the most profound discounts created out of all the sectors last week.
XLY Daily
Very clean Dark Pool accumulation and discount sells visible.
This is one of my favorite DCA’s right now. I see major value here long-term.
I think this sector will play a major roll in the RSP recovery, whenever that happens. This is clearly one of the more undervalued sectors and clearly out of short-term rotation in most peoples heads. Should change in due time.
I’ve been buying a lot of this as well as $XRT, which I won’t cover in this newsletter, but I have been tweeting about it a lot lately. Two of the most underrated segments of the market in my opinion and I am willing to play the long game. XRT newsletter.
XLI
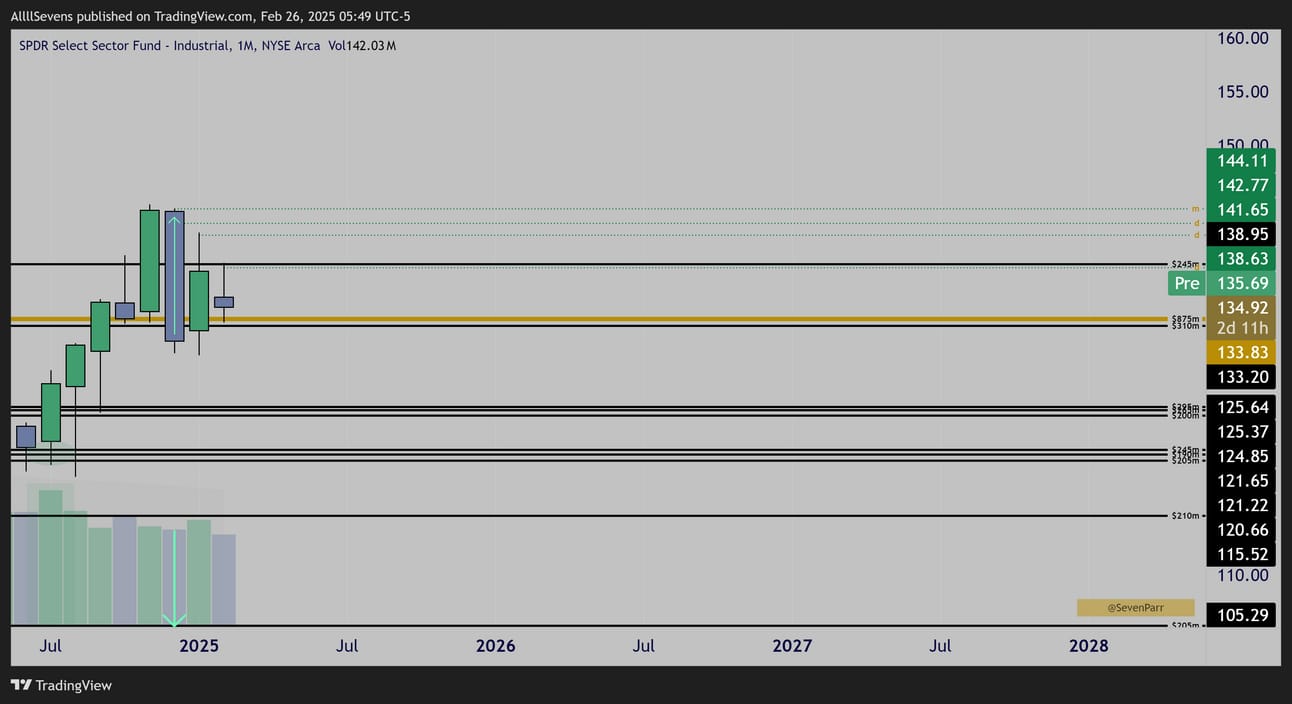
XLI Monthly
Very clean discount candle created in December.
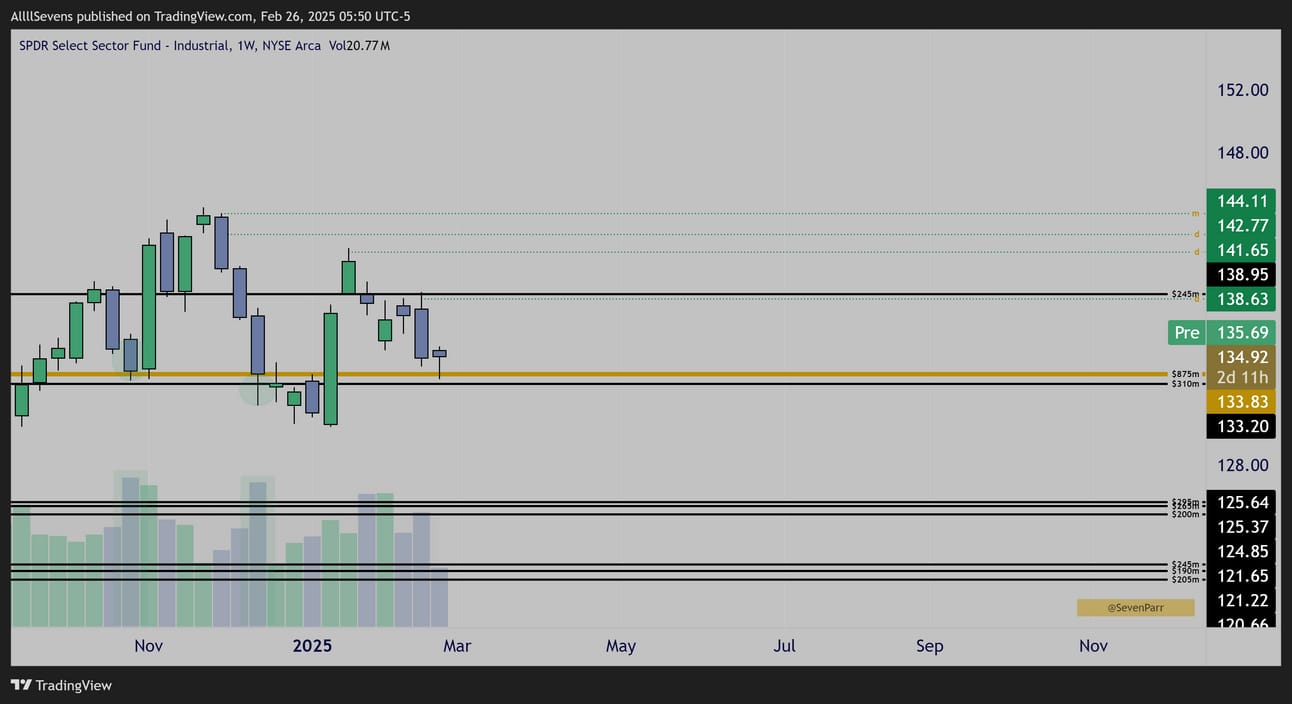
XLI Weekly
Perfect Dark Pool accumulation off this $133 cluster which is the ETF’s largest Dark Pool ever recorded (gold line)
I have been accumulating a good bit here within this monthly discount, but it is honestly hard for me to get a good short term read. I just think I am getting a damn good long-term discount.
XLC
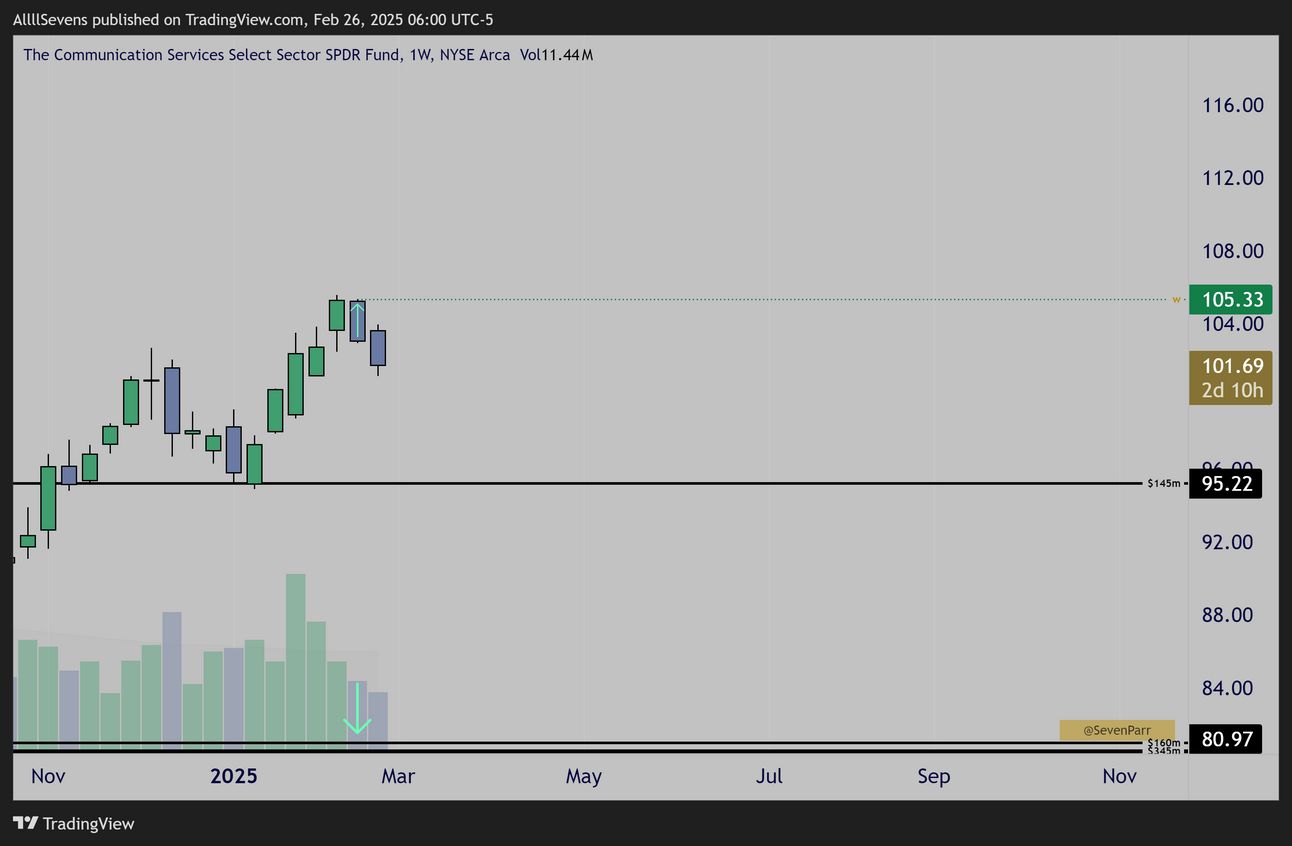
XLC Weekly
Starting to go on discount.
Not near any Dark Pools so not a focus of mine at this time.
I have no position here yet.
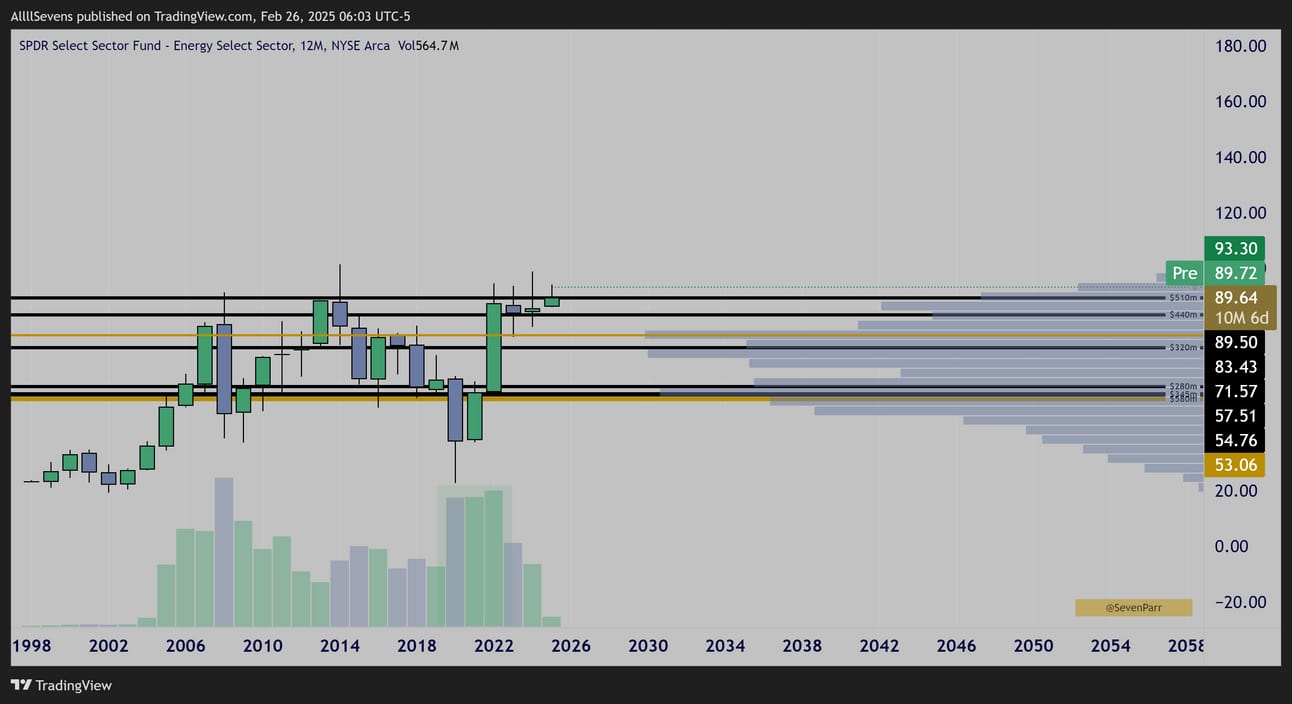
XLE
XLE Yearly
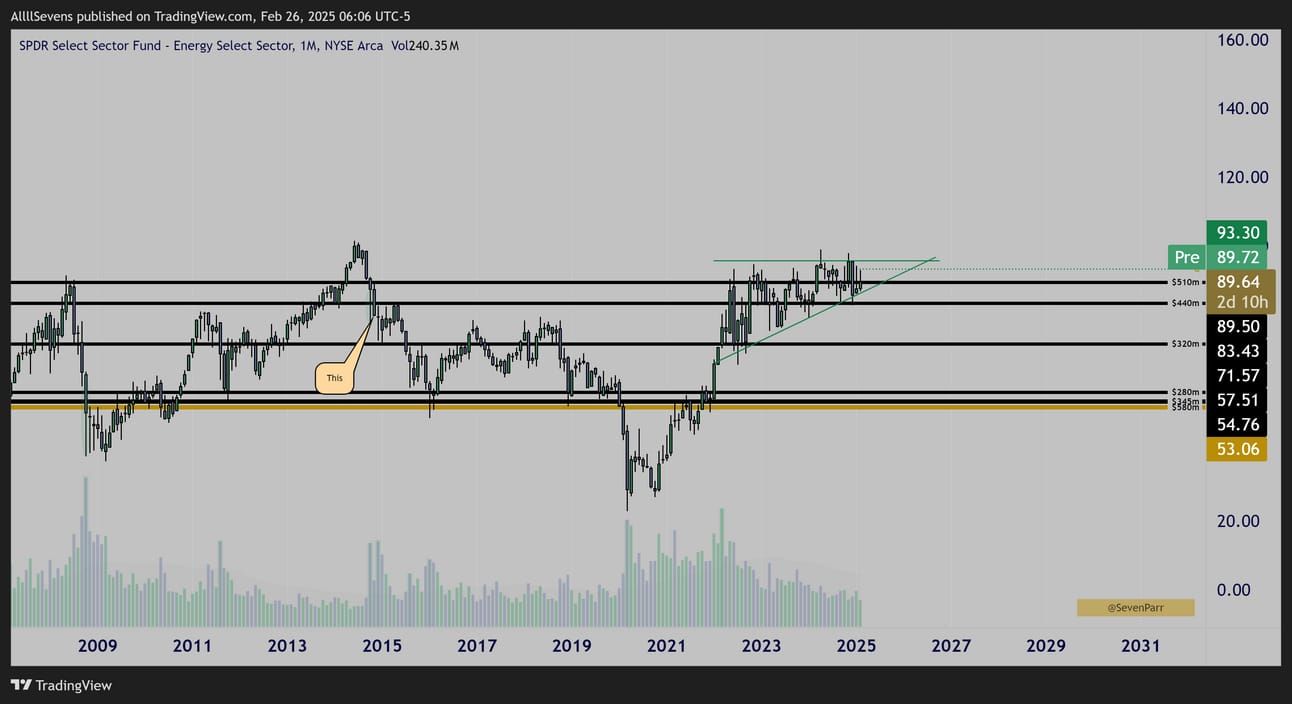
XLE Monthly
I think XLE has been under heavy accumulation ever since 2008
I think the 2020 crash was a major capitulation, sweeping those 2008 lows and reversing on massive volume, making a statement.
For the last two years following that high volume reversal, price has been compressing on low volume just below ATH’s as if it is prepping for an upside breakout. On the monthly chart, I point out how this $83.43-$89.50 Dark Pool has been clearly accumulated in the past (2015).
I also highlight an ascending triangle upside continuation pattern forming, which lines up with the yearly compression.
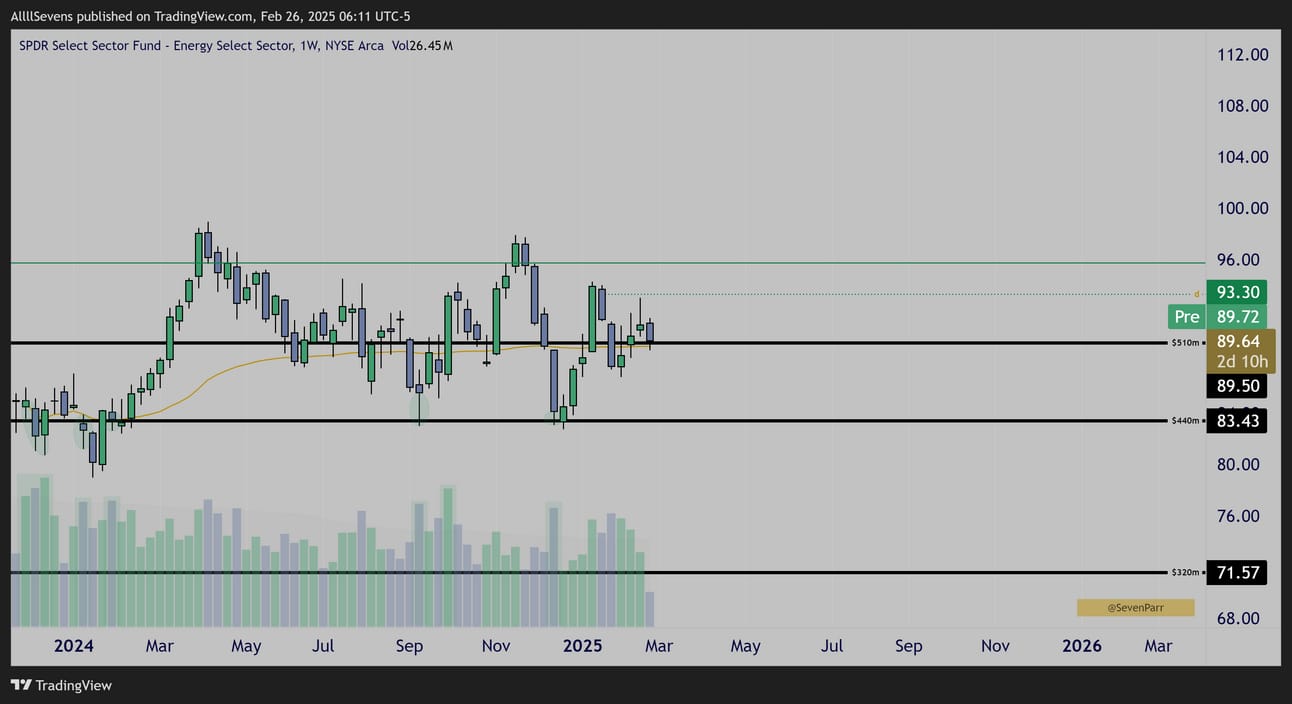
XLE Weekly
Clear accumulation off $83.43 which I think is essential to hold if this is going to break upwards from this yearly / monthly continuation pattern.
I’ve actually been accumulating this with leverage which could be very dumb or an extremely profitable trade. We will see.
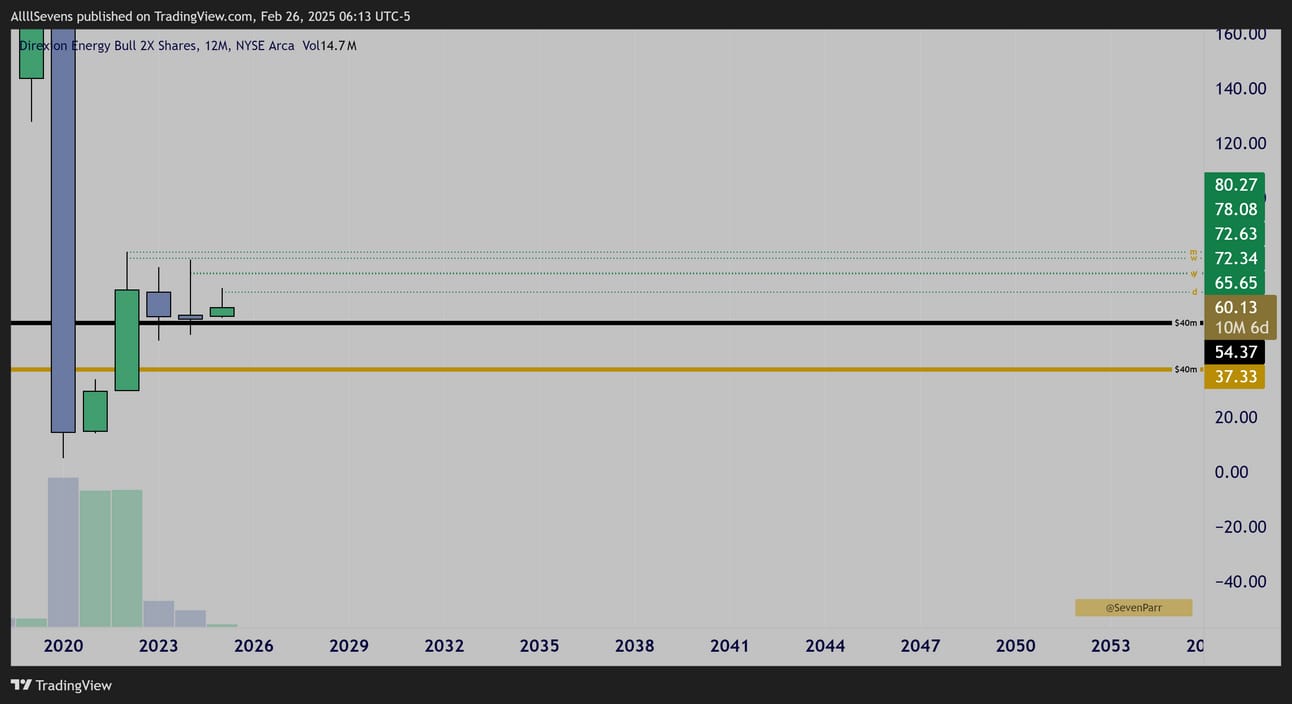
ERX Yearly
Shows the low volume consolidation over support 10x better than the XLE
After a massive accumulation on highest volumes ever- basing over support for upside continuation.
Multiple discounts are marked on this chart, I don’t think I need to zoom in and point them out. The idea here is simple.
Just like XLE needs to hold over $83.43, ERX needs to hold $54.37
If these levels get lost and the monthly / yearly upside pattern begins to fail, I will sell my leverage and bag hold my long-term XLE.
XLU
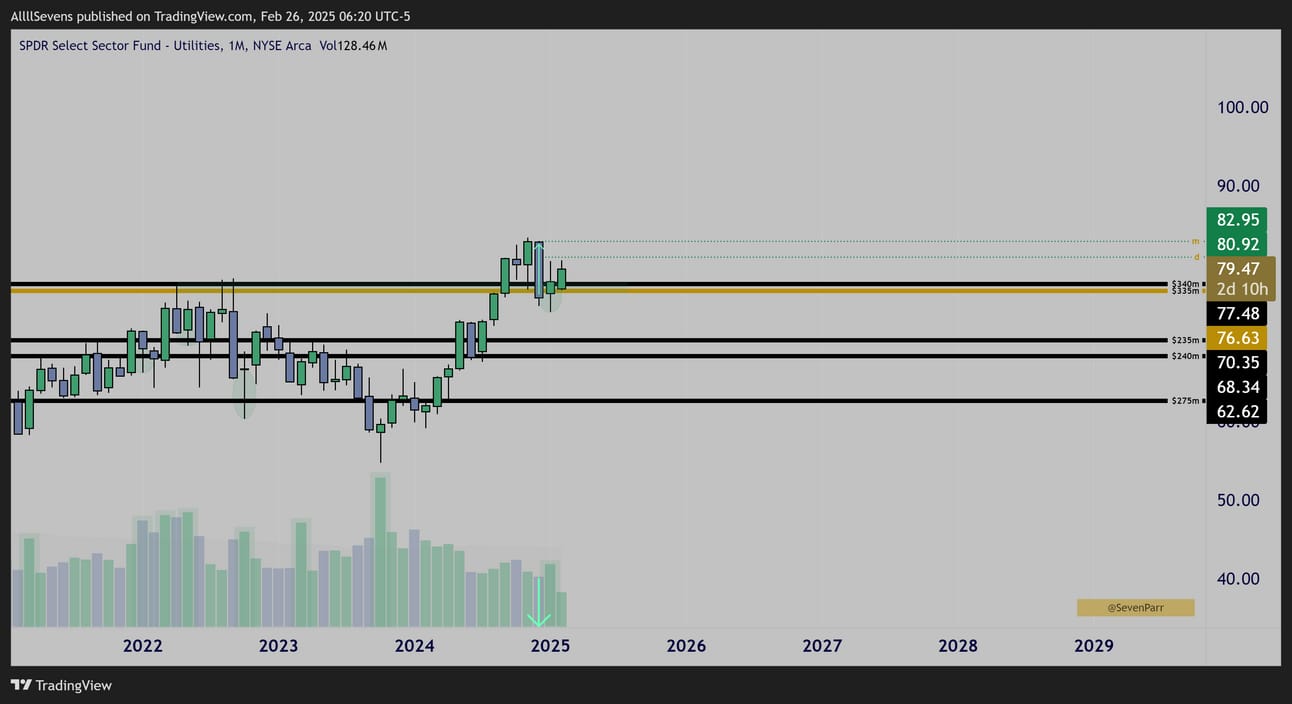
XLU Monthly
Absolutely stellar Dark Pool accumulation over the last three years.
Recently broke to new ATH’s and is now retesting within a monthly discount.
So far, bouncing after an increased volume hammer formed last month.
Very good look.
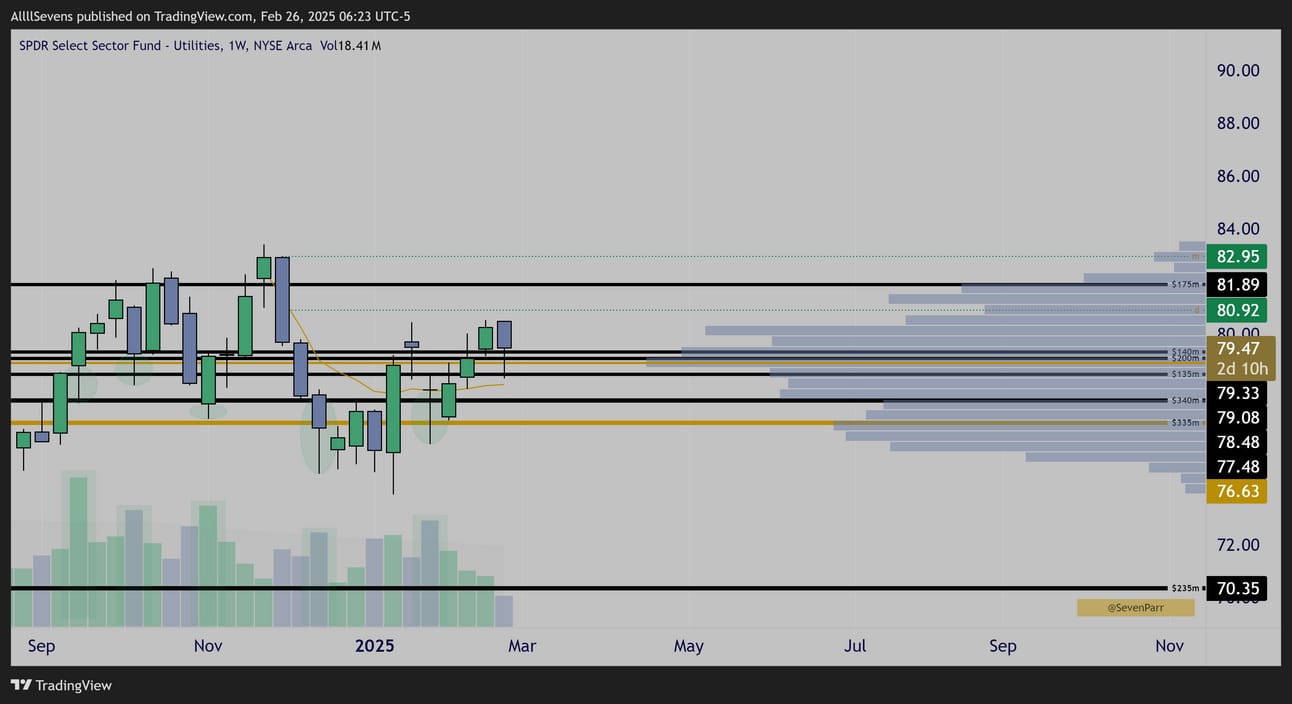
XLU Weekly
This chart is amazing. Very clean dark pool accumulation.
Starting to curl upwards off ATH AVWAP + Volume Shelf Support.
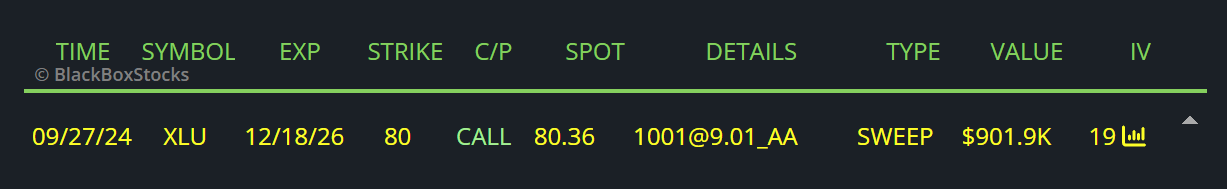
$900K Call Buyer Into Dec 2026
This guy has been in for many months now.
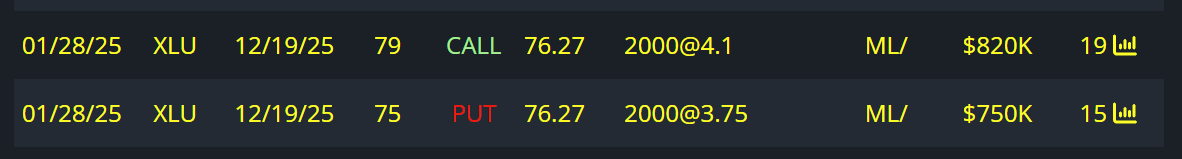
There is technically no way to tell if they are buying or selling either of these contracts
But, Open Interest says they are both opening orders and considering the chart…
I think they bought the calls and sold the puts
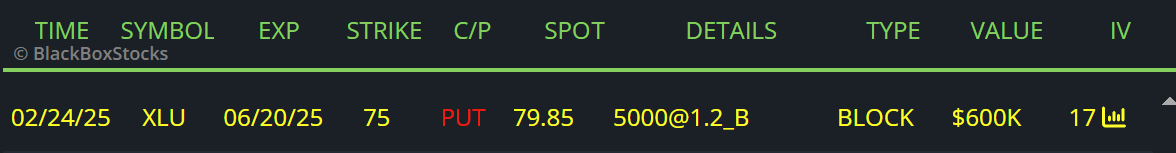
$600K Put Seller
XLU can be added to my list of higher confidence short-term setups.
This, XLV, & XLF look the most appealing for potential quick gains.
XLV and XLU also being significntly discounted still.
XLF is not discounted by a large amount and definitely has the most momentum I think, hence the most amount of flow.
Anyways, XLU has been one of my top buys the last few weeks.
I like the looks of this a lot.
XLP
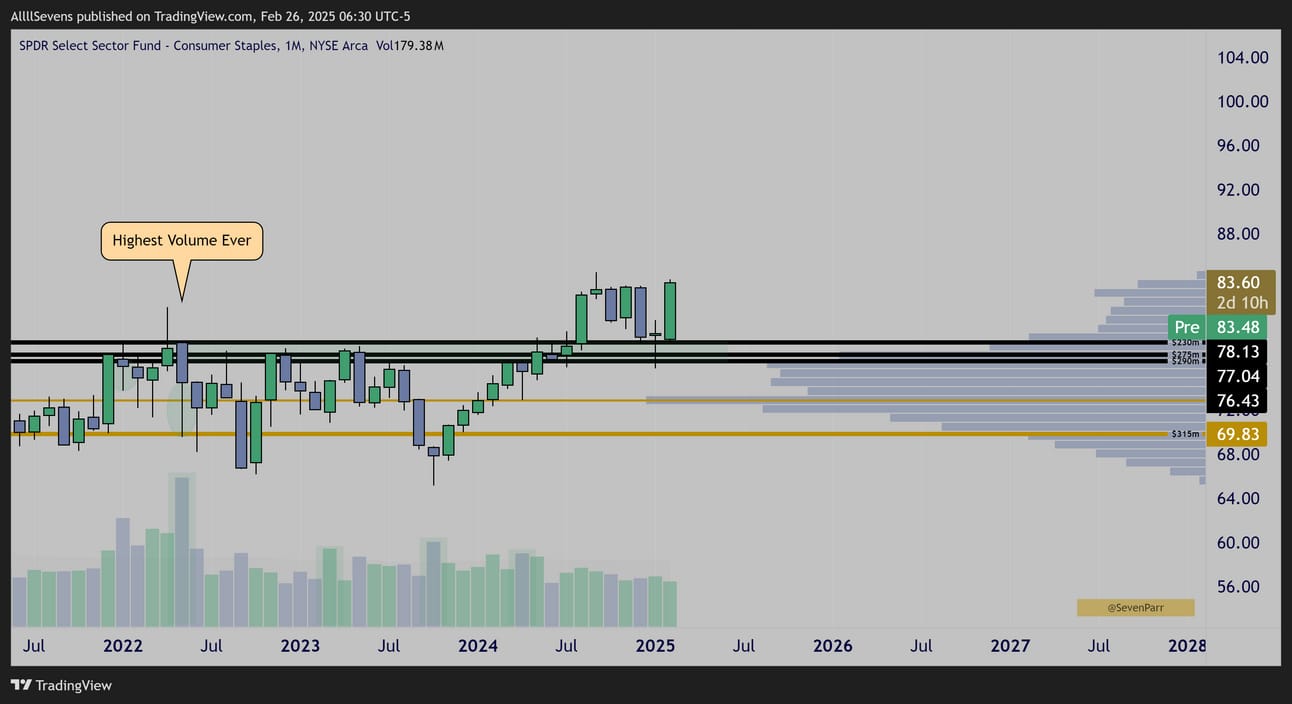
XLP Monthly
Similar to XLY, this saw accumulation in 2022 on its highest volume EVER.
Historic.
Also similarly, it hasn’t moved with the rest of the market (SPY)
Recently broke to new ATH’s, retested, and bounce, now pushing highs again.
Likely to play a role in the RSP strengthening.
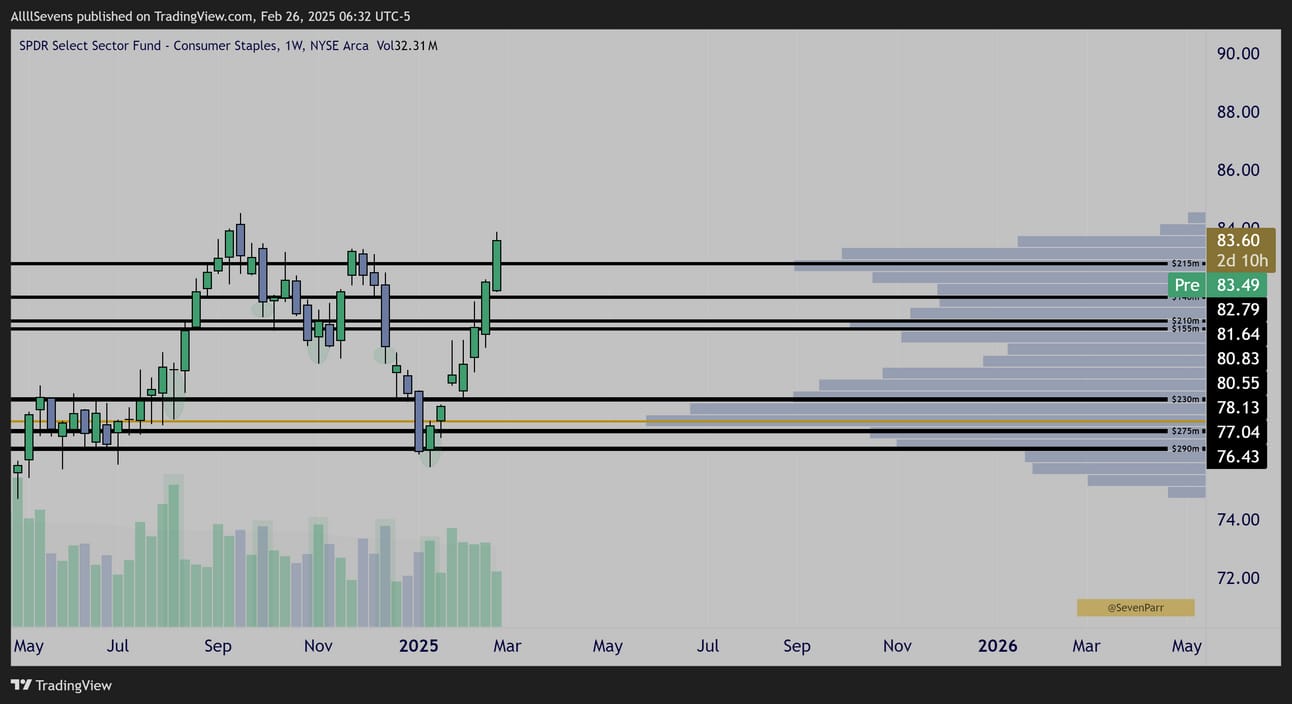
XLP Weekly
While this chart looks great, there is no discount to exploit and I am not a buyer at this time.
I am a holder. Looking to buy more if there’s another pullback.
I have not seen any flow here.
XLB
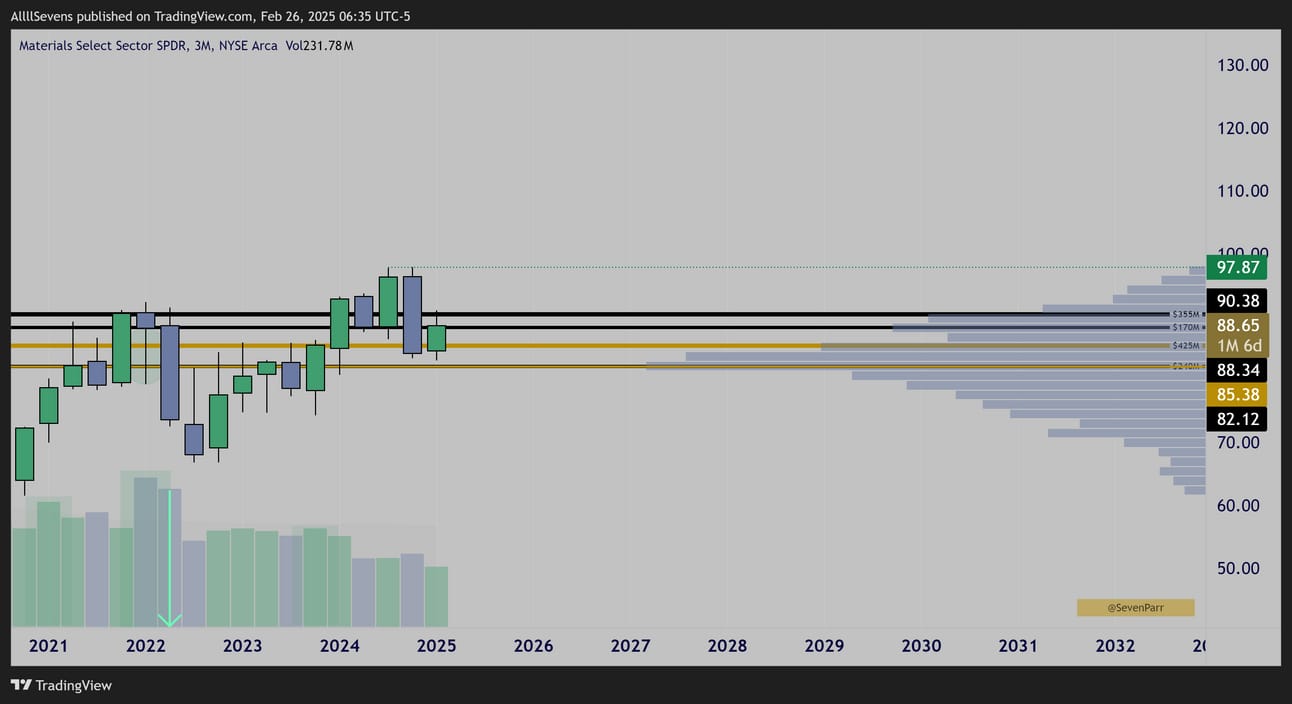
XLB Quarterly
Another sector that saw crystal clear institutional accumulation in 2022 yet has lagged the market significantly. Just like the others, I think it’s only a matter of time before it comes into rotation as well. This is also one I’ve been buying quite a bit of recently- more so for the long term value than a possible short-term trade, but who knows. The monthly chart does look great…
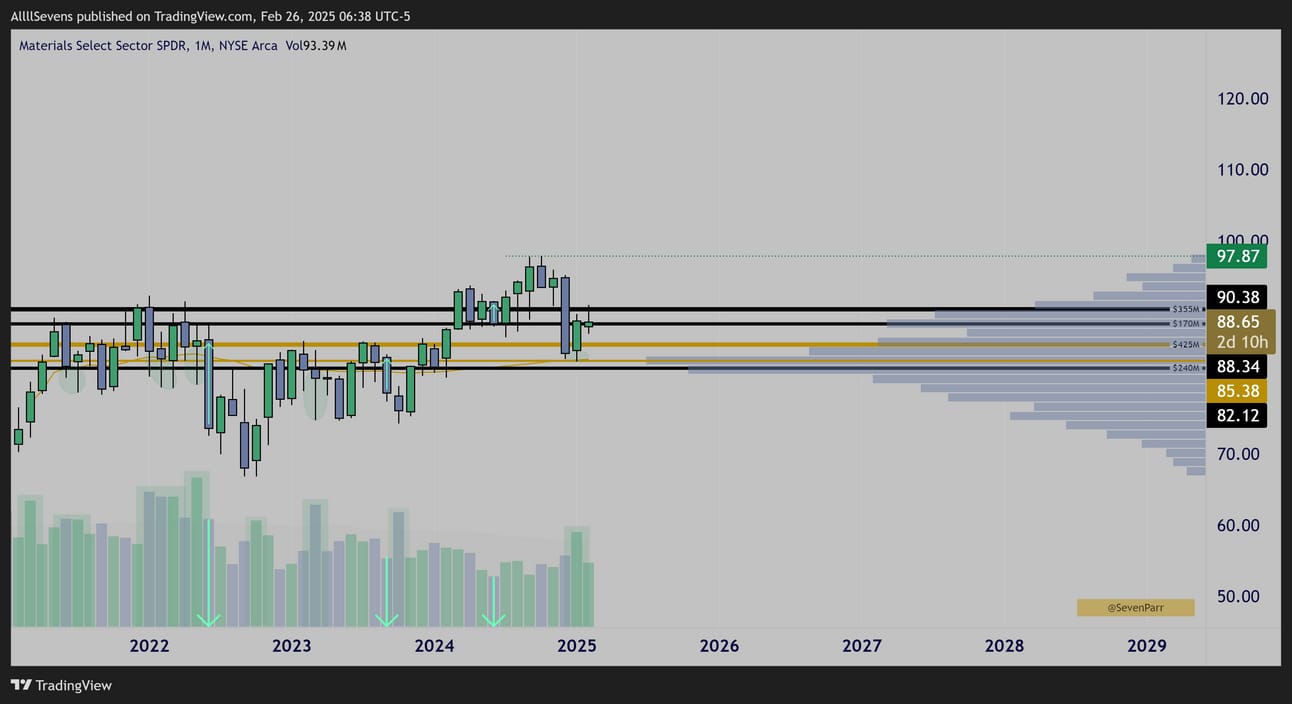
XLB Monthly
These accumulation patterns are absolutely textbook.
Last months candle ammering hoff the largest DP on record + volume shelf + AVWAP could be a statement upside reversal signal.
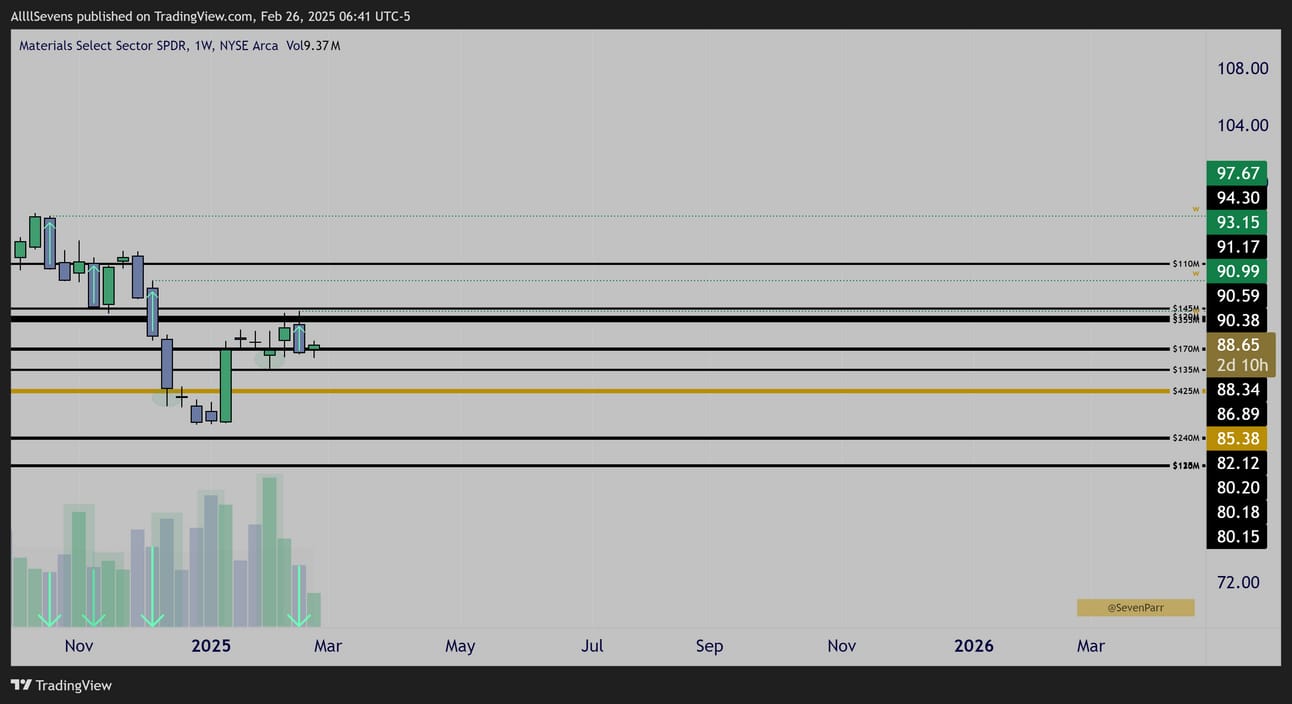
XLB Weekly
This is definitely the most prolific sequence of discount selling on any sector. I have shared so far. Just crystal clear relentless short-term speculators selling while institutions continue building a position for the last three years.
XLRE
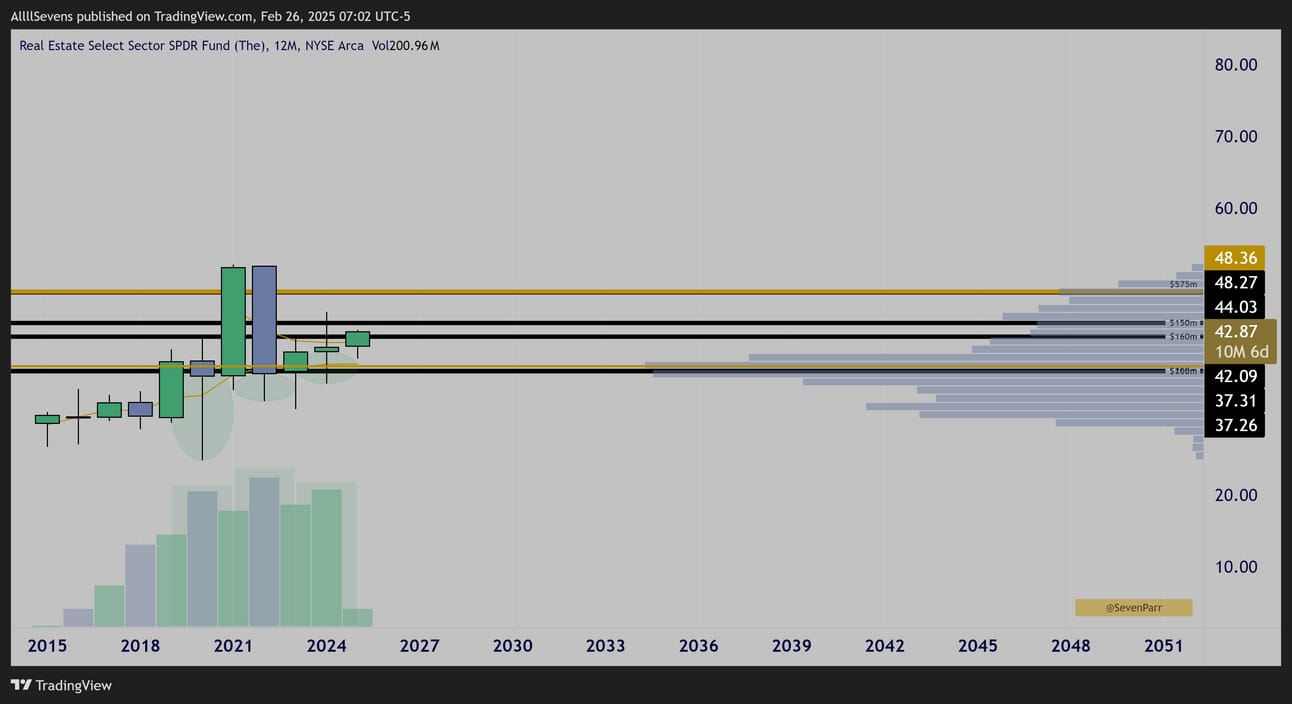
XLRE Yearly
There is a lot of volume concentrated inside these lower wicks @ Dark Pool.
Could result in a very explosive upside move.
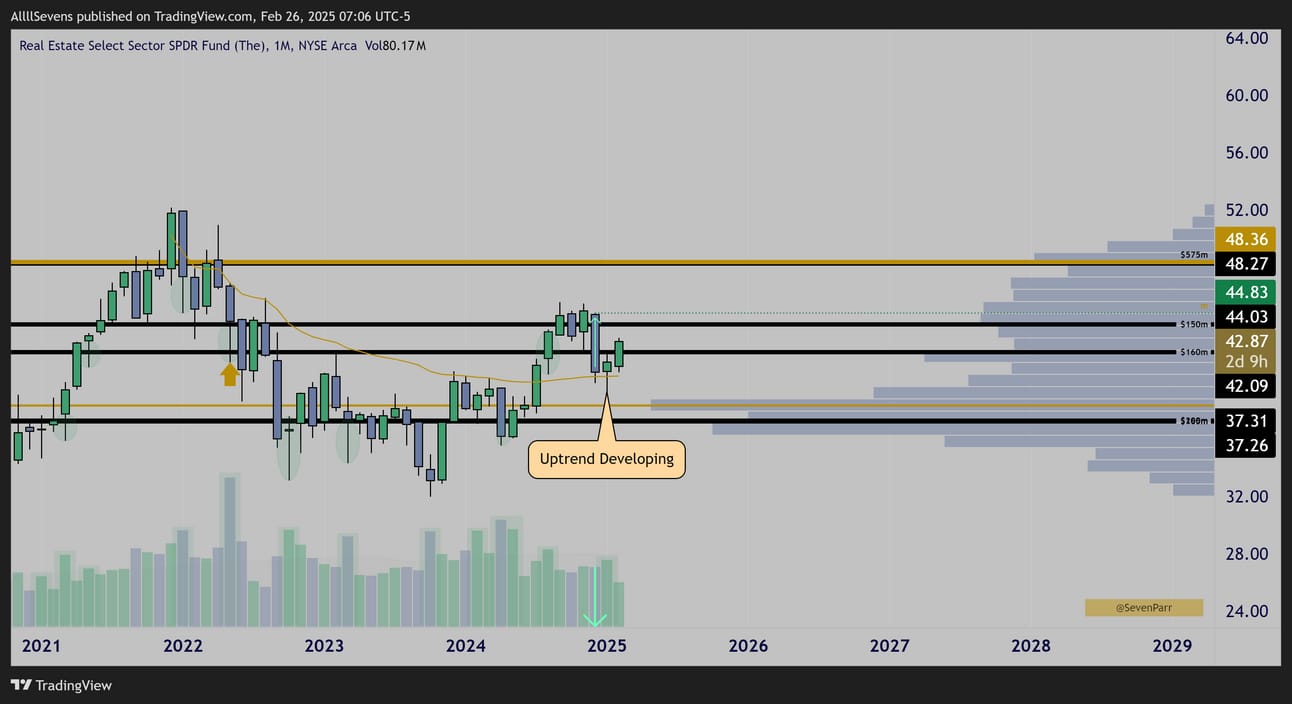
XLRE Monthly Interval
Price is trying to developing an uptrend, breaking over, retesting, and holding ATH AVWAP. This is while in an active monthly discount through Dark Pools that saw MAJOR accumulation in May of 2022
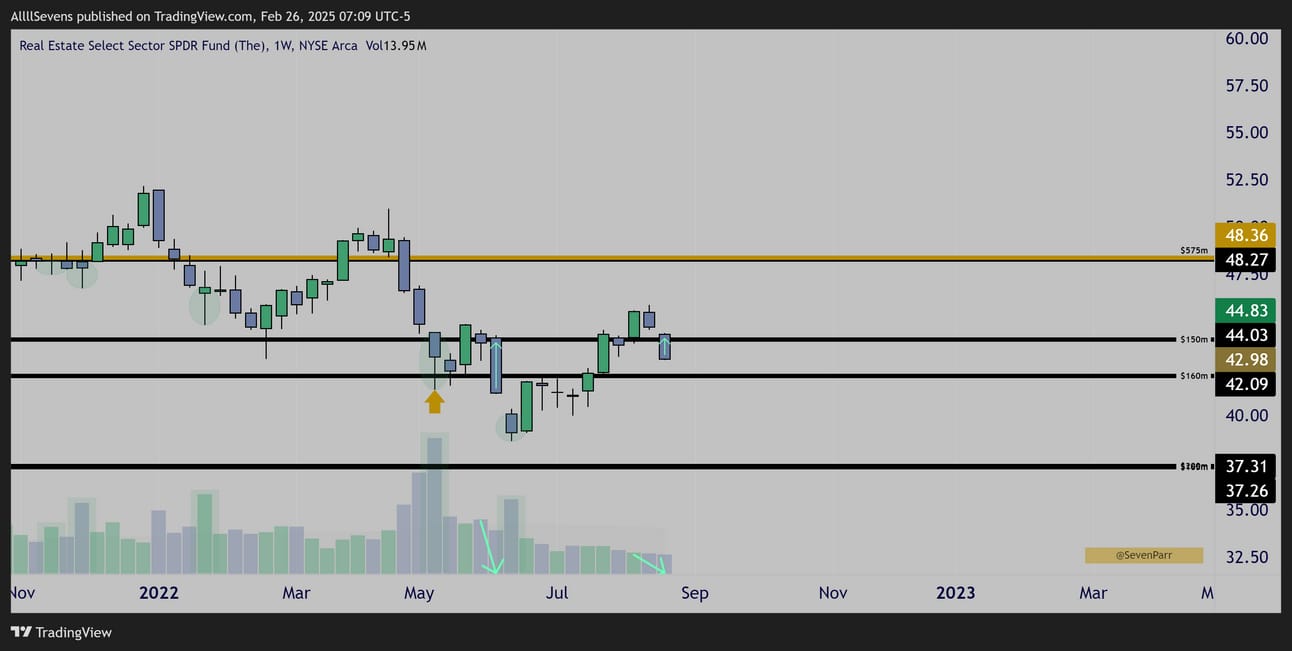
XLRE Weekly
Here is the 2022 price action in this area. Crystal clear accumulation.
I am confident this sector is severely mis-priced and could finally be gaining some short-term upside momentum reclaiming this zone.
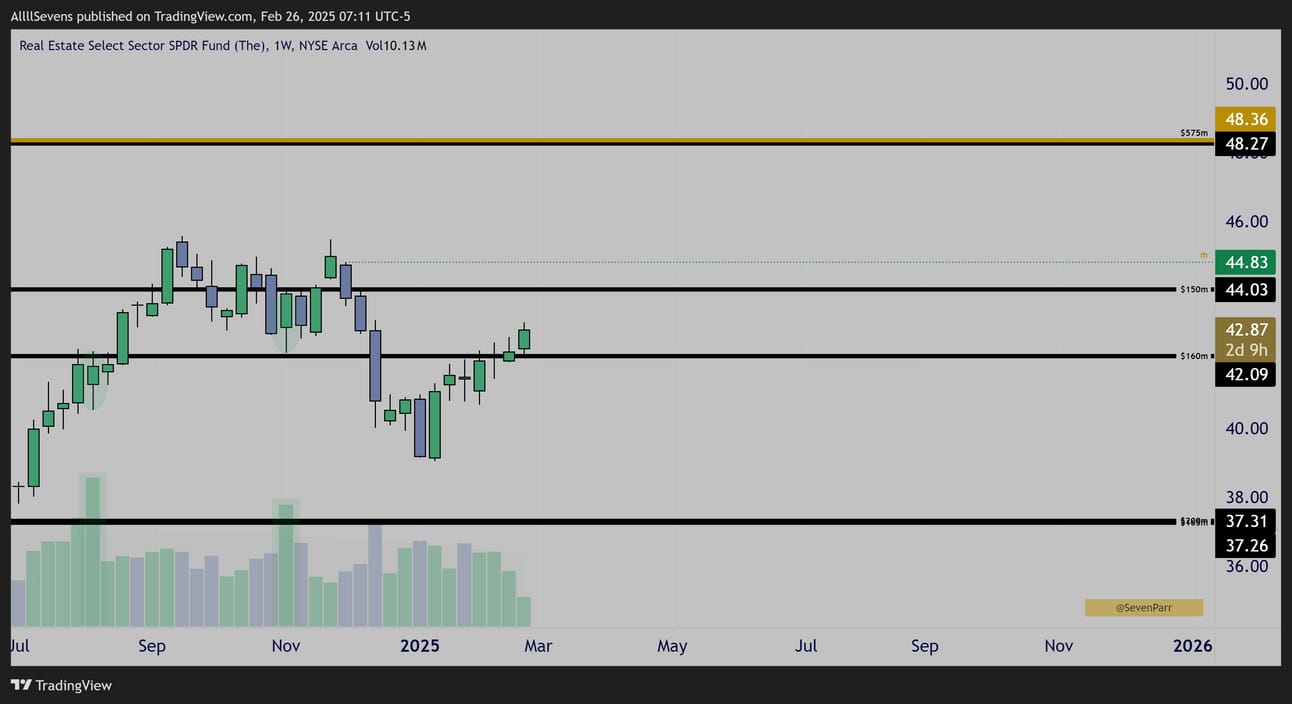
XLRE Weekly
In recent weeks I can see the accumulation of this zone is just as active as ever.
Oddly enough, there’s no flow here yet. Could use a little more confirmation.
If you found this newsletter valuable, upgrade your subscription to AllllSevens+ for $7.77 / month to show your support and also get:
-Discord Access
I collect and analyze all of this data in Discord before posting it to X or writing a newsletter. The Discord is an absolute gold mine. See for yourself.
Dark Pools & Options Flow on a Daily basis. Always open for discussion.
Building a community of like-minded folk.
I believe we are witnessing history. Let’s work.
-Premium newsletters
More analysis just like this.
I have plans for some seriously valuable premium newsletters in the near future.
Individual stocks and some other ETF’s.
Major stuff there. Please join me!
Click here to join AllllSevens+
If you’re interested in tracking dark pool data and unusual options flow yourself, here’s my affiliate link for BlackBoxStocks, the platform I use:
http://staygreen.blackboxstocks.com/SHQo
I also have a referral link for TradingView, the charting software I use https://www.tradingview.com/pricing/?share_your_love=sevenparr
Reply