- AllllSevens
- Posts
- Weekly Outlook 1/22/24
Disclaimer
I am not a legal professional.
The content shared in this newsletter is for information purposes only.
You should not interpret any of this as investment or financial advice.
The statements I make are not solicitations, recommendations, or endorsements to buy or sell a security or financial instrument.
I am not a fiduciary on account of your viewing of this information.
You are solely responsible for the risks involved with the use of any information shared in this newsletter.
By using this site and reading this newsletter, you agree to not hold me, my affiliates, or any third party liable for decisions you might make based of information shared in this newsletter.
My outlook on the market is determined using Volume Price Analysis specifically at the largest Dark Pools on record for the ticker in question.
Doing this allows me to present the market through the lens of an institutional trader/investor. Pure data. No personal bias.
I can determine whether or not “smart money” has bought, is buying, has sold, or is selling. This can be extremely valuable information.
Preface:
Last week, I claimed the SPY was exiting a month long period of accumulation. I was correct. ATH’s were hit within my projected time frame, and now my daily target of $489 awaits.
This week, I recap the S&P500 and what there is to do from here.
I also go in depth on each indivudal sector.
Then, I update previous newsletters, ZM & ETSY
Finally, my absolute #1 focus this week and likely through all of 2024 will be the Russel 2,000 (IWM)…
Plus a few other indivudal stocks.
SPY
Long-Term Outlook:
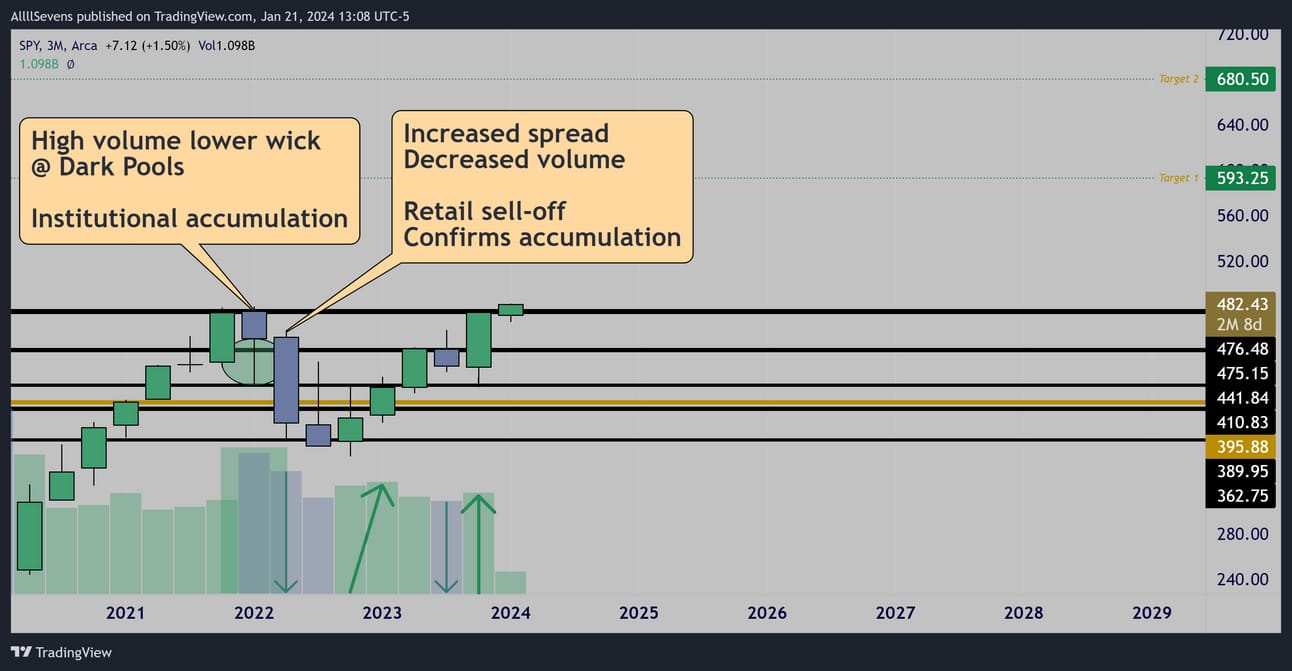
3 Month (Quarterly)
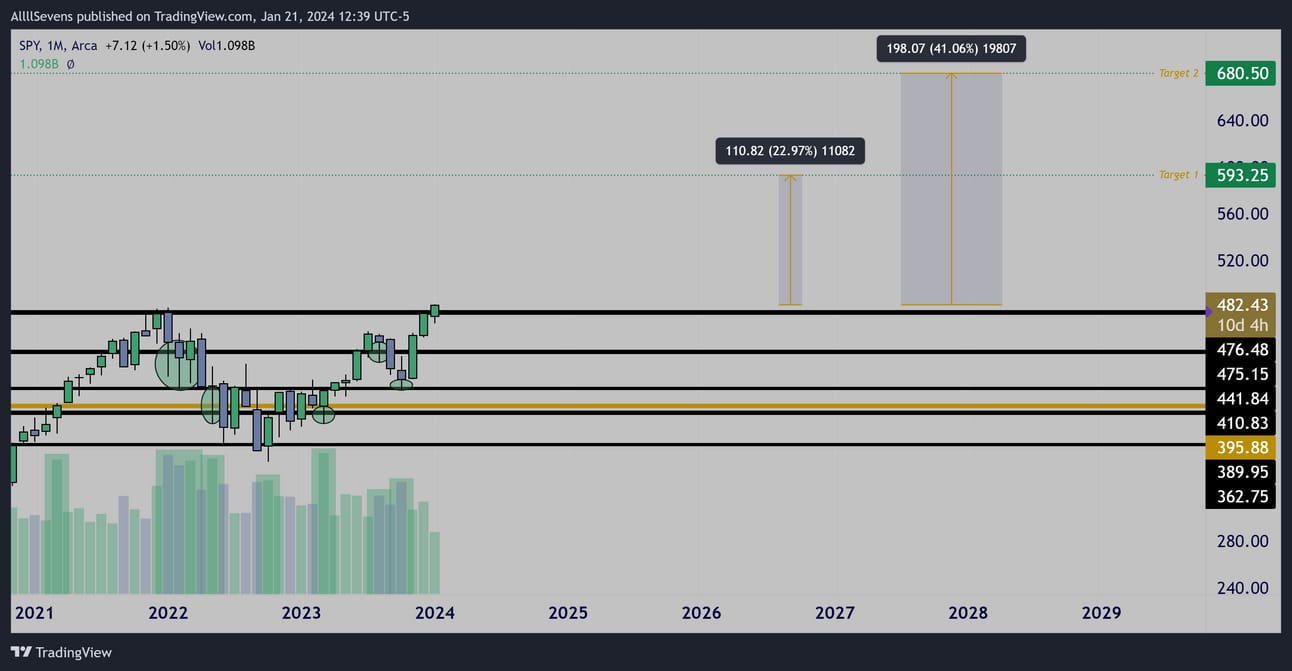
Monthly
The S&P500 has been heavily accumulated during the last two years.
Even when the “bear market” first began, we could see using Volume and Dark Pools that it would not last…
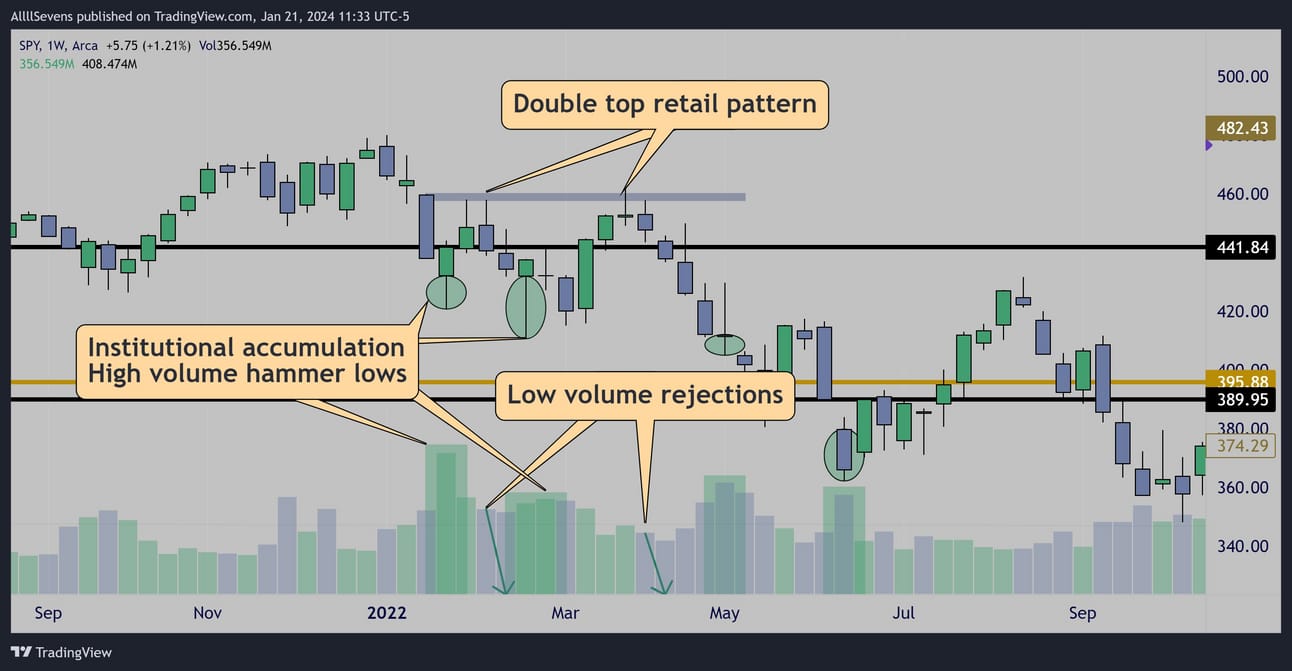
Weekly
The whole thing was a hoax. It was a test of patience and conviction.
A recovery over the next few years was pre-determined.
Preceded by volume.
We can find these same patterns on other charts…
I hope you recognize how powerful this analysis is.
This is what I mean when I say I can tell whether or not institutions are buying, have bought, are selling, or have sold.
This data I share, I will use it to change my own life and everyone’s around me. Hopefully that includes you.
Using a Fibonacci projection, I have two primary targets on SPY for the long-term. $593.25 & $680.50
I have no idea how long this will take, as retail participants move price in the short-term.
Short-Term Outlook:
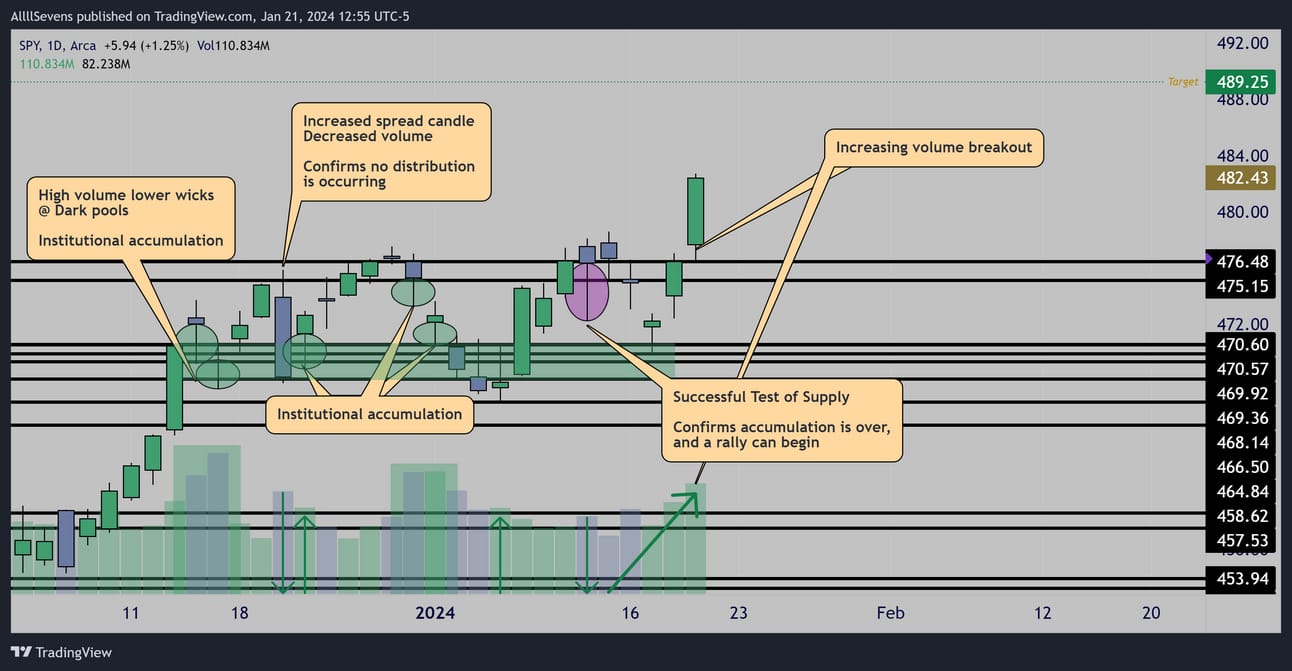
Daily
Price has entered a period of upwards expansion following a month long period of accumulation. My projected target is $489.25
If you’re reading my newsletter for the first time, I called this last week-
I’m not just looking at all of this in hindsight.
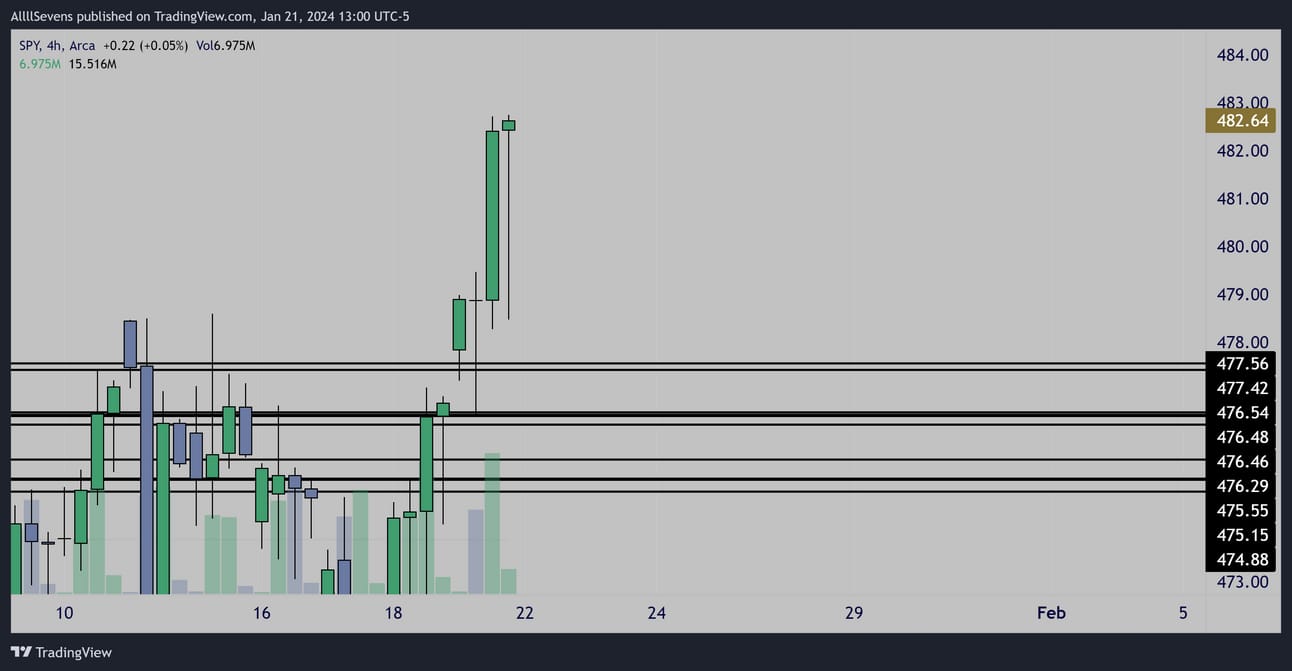
4HR
There are no more notable dark pools on the SPY over $477.56
No support, no resistance.
So, there’s not really a trade for me on SPY anymore.
Not until new levels appear or a pullback occurs.
Until then, I simply expect my upside targets to approach
Let’s check out each individual sector in the SPY:
XLK- Technology (29.52% weighting)
Long-Term Outlook:
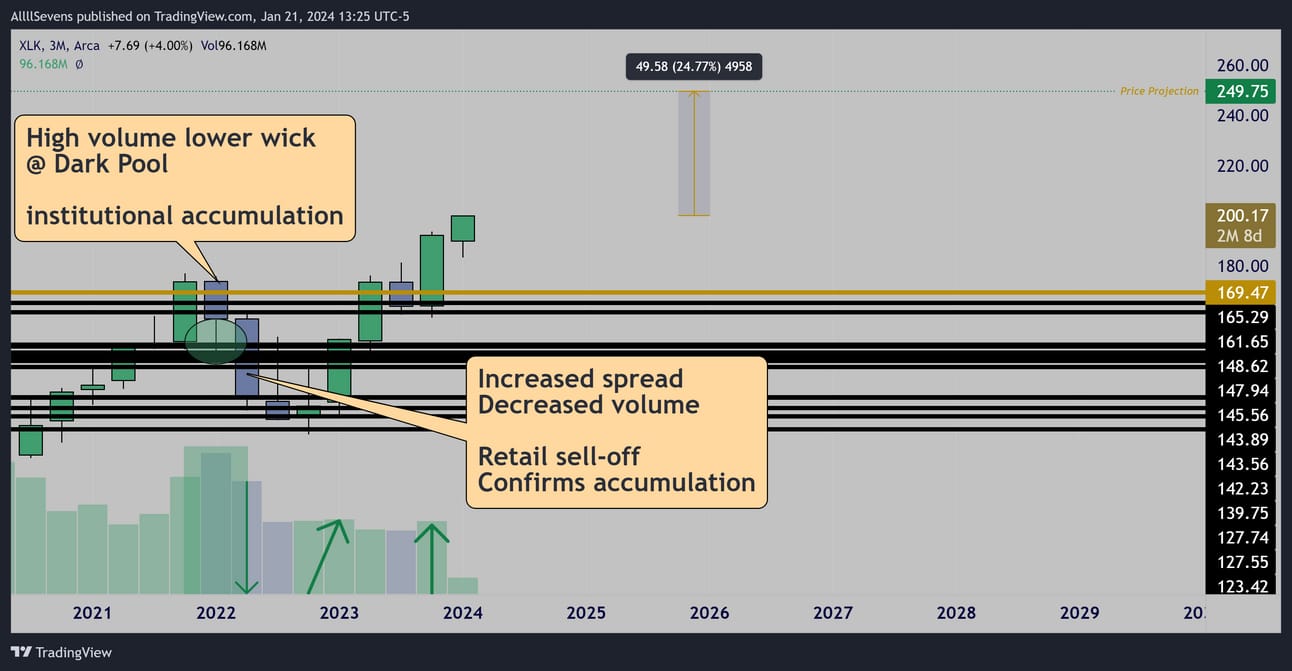
3 Month (Quarterly)
Short-Term Outlook:
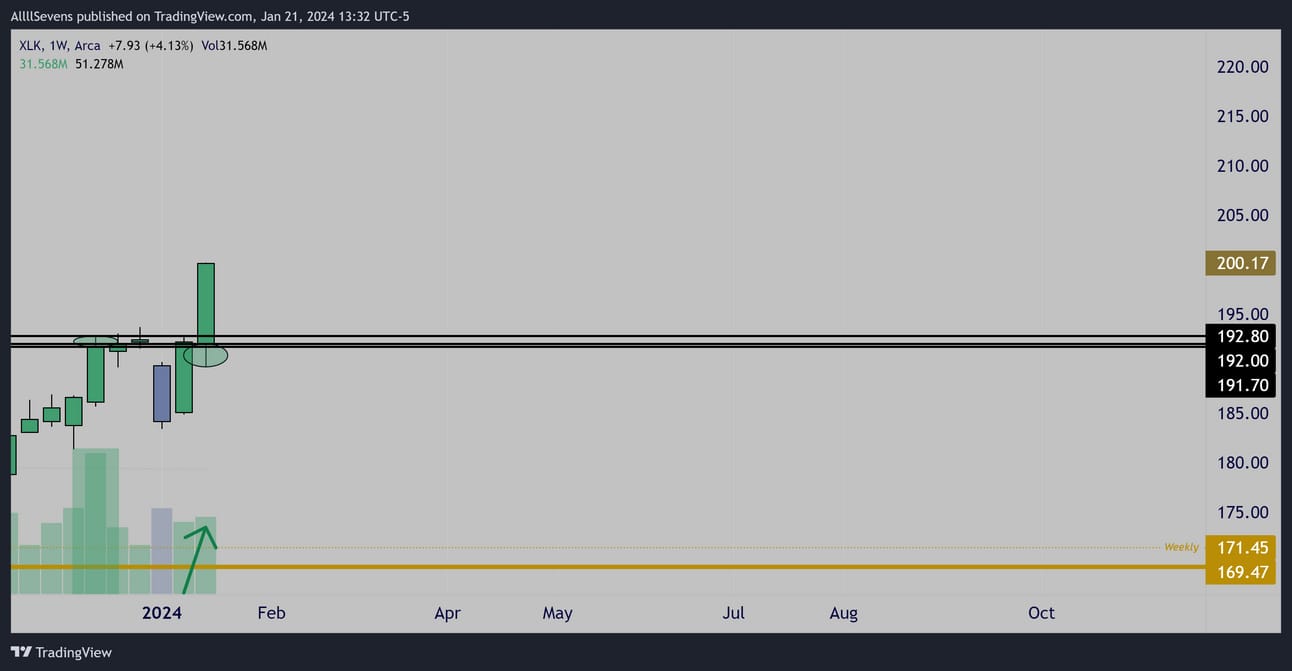
$191.70-$192.80 is the current bullish pivot.
As long as price holds this area, I expect the current rally to continue.
If lost, then we’re likely seeing rotation out of Technology and into another sector. This would not invalidate my long-term target, but it would signal a short-term correction or period of consolidation is underway and I’d no longer expect strength from this sector.
XLV- Health Care (12.86% weighting)
Long-Term Outlook:
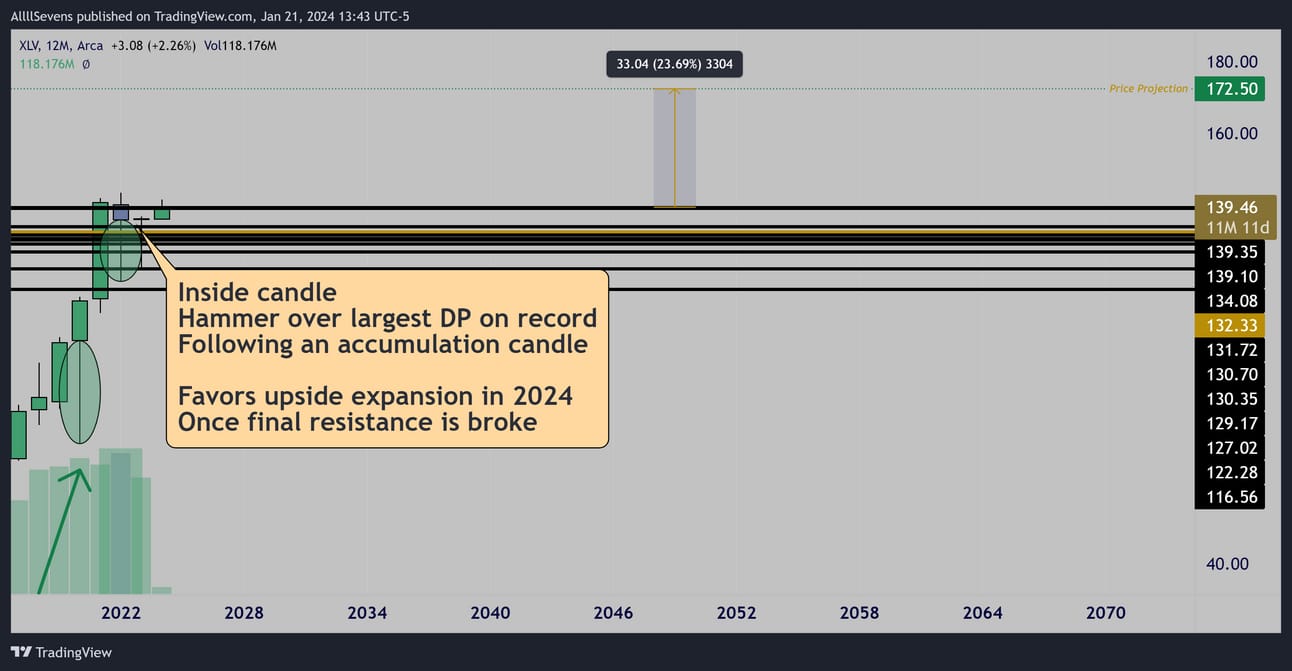
Yearly
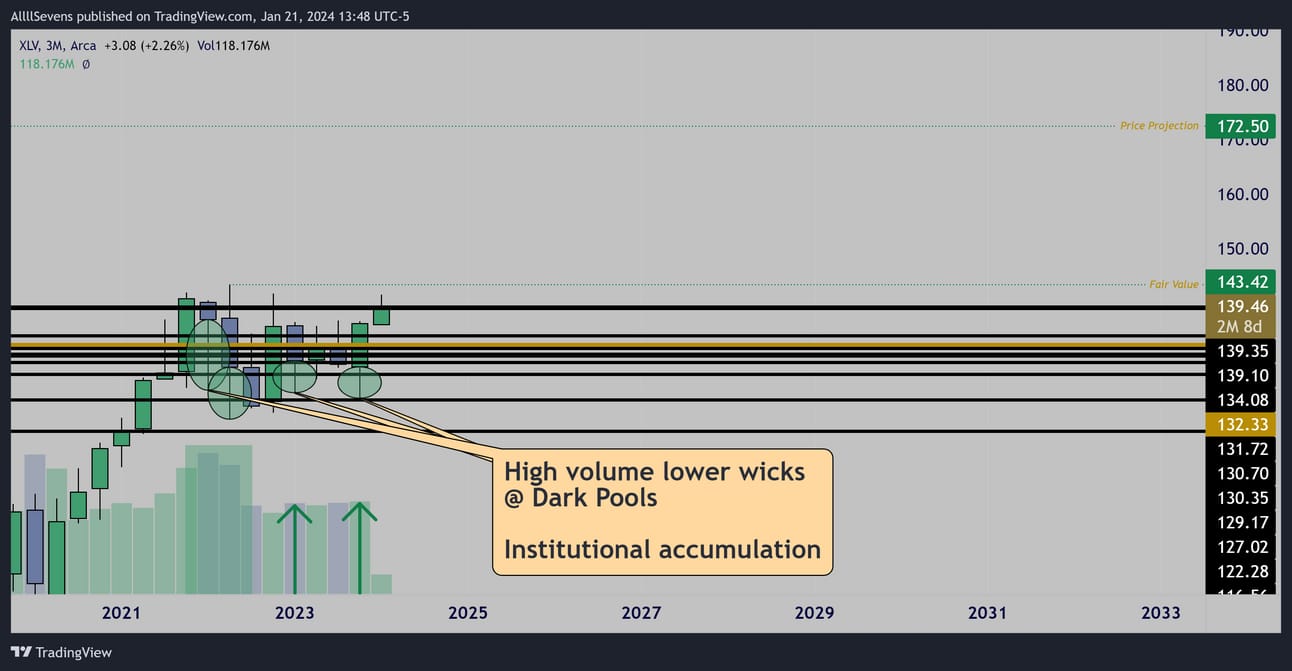
3 Month (Quarterly)
The XLV is undervalued below $143.42
Short-Term Outlook:
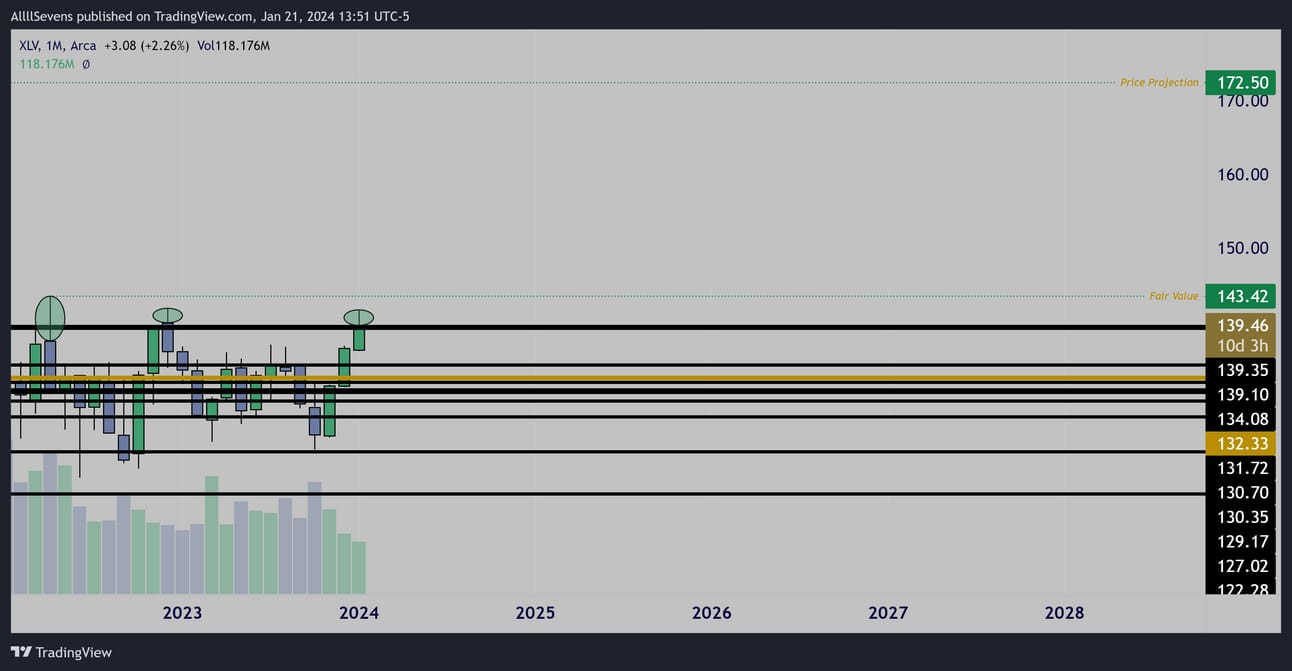
Monthly
Price is testing the $139.10-35 resistance before large upside expansion can begin.
Until this zone is broke with strength, a triple top (retail driven pattern) could spark a rejection and keep price rangebound a while longer.
I want to be cautious here.
The initial breakout is where the most risk is involved, and it isn’t even where the most money is made.
Once this area is broke and flipped into support, risk involved with going long decreases, and the real money is made on multiple months of upside expansion towards $172.50
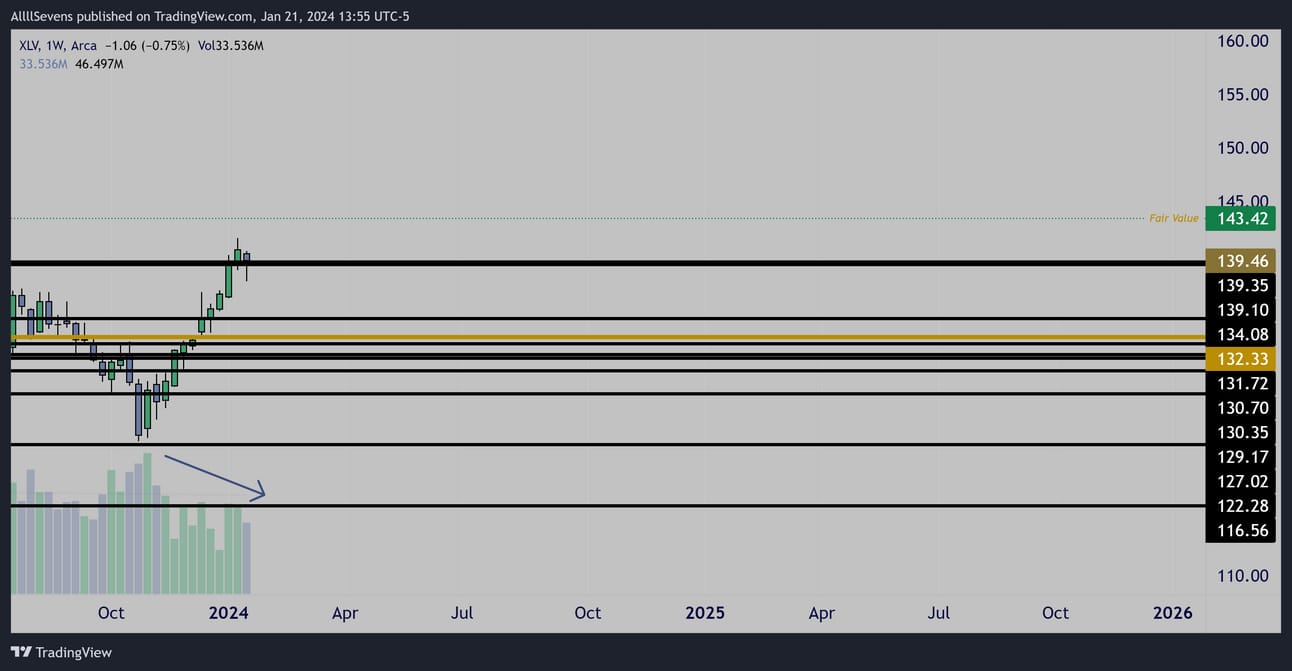
Weekly
The overall low volume as price comes to this area of resistance concerns me. This tells me institutional buyers aren’t being aggressive here… yet.
You have to remember, the real setup here is on the YEARLY chart.
A little chop and indecision at resistance , or even a full on rejection would not phase institutions. All it would do is scare more retail participants out of their longs and allow for more accumulation.
So, I don’t want to get trapped in a long here until I see more confirmation.
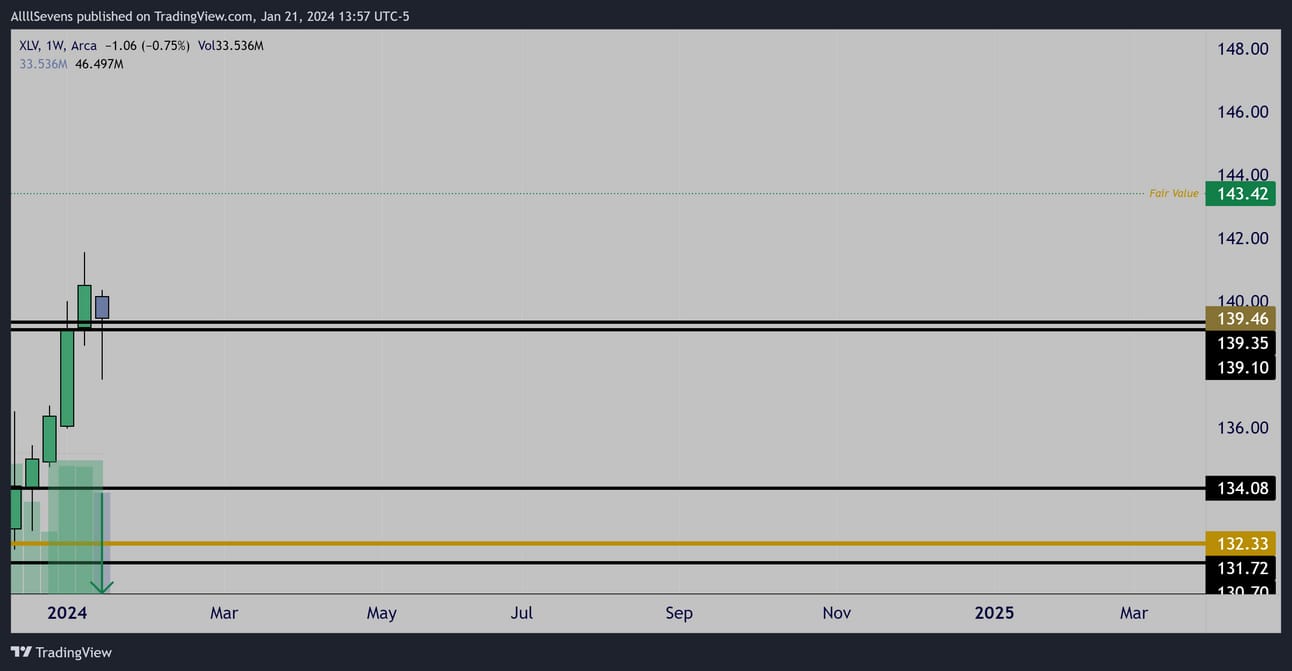
Weekly
This week, a decision might be made.
If price can open over $139.10, this isn’t a bad look for upside continuation to begin if we see LARGE volume buyers step in.
If their is no volume, I’m not interested.
The volume must be in another sector.
If price opens below $139.10, then this is likely entering a period of consolidation and might even correct down to the next support.
It would be 100% off my watchlist short-term in this scenario.
XLF- Financials (12.83%)
Long-Term Outlook:
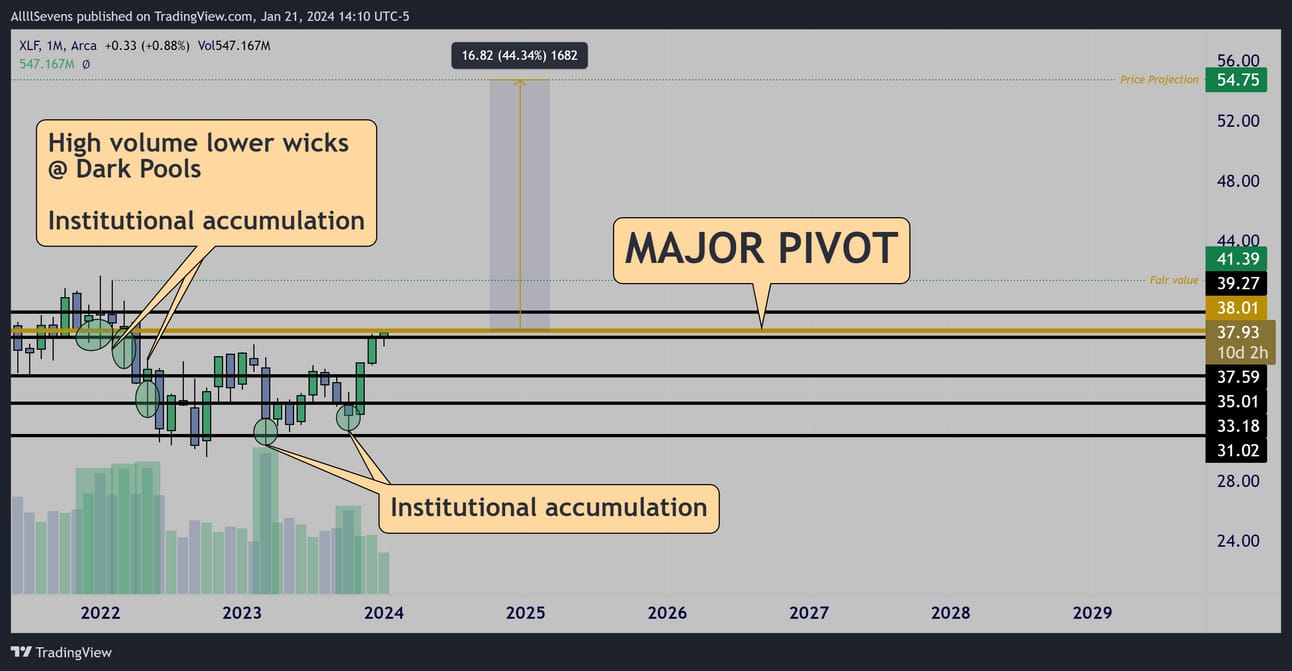
Monthly
The XLF is undervalued below $41.39
Short-Term Outlook:
Price is at it’s largest dark pool on record, $38.01-
An extreme pivot point for short-term direction.
A breakout will spark a massive rally.
Inability to breakout will spark a further short-term period of consolidation or even a pullback to the next support.
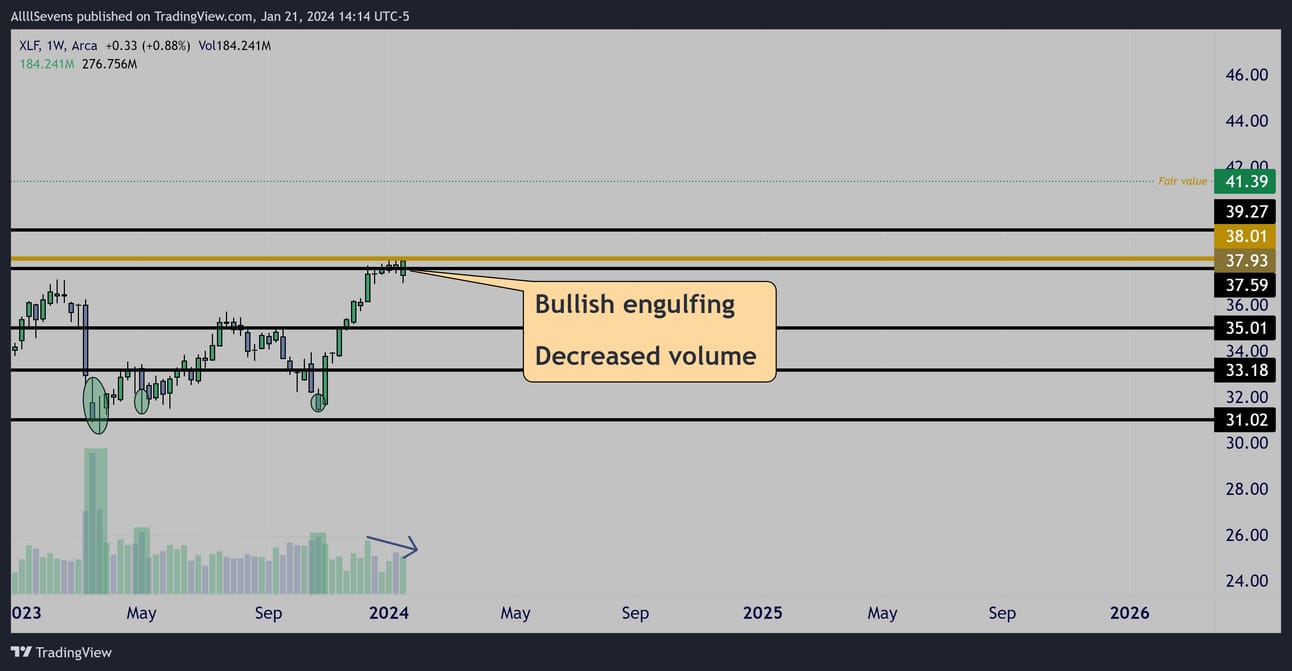
Weekly
Very similar situation as the XLV
Both sectors are presenting seemingly bullish candle patterns at resistance…
But there’s no volume here, signaling a lack of aggression from institutional investors. Until a breakout is confirmed here,
I’d like to be cautious and not get caught in chop or a pullback.
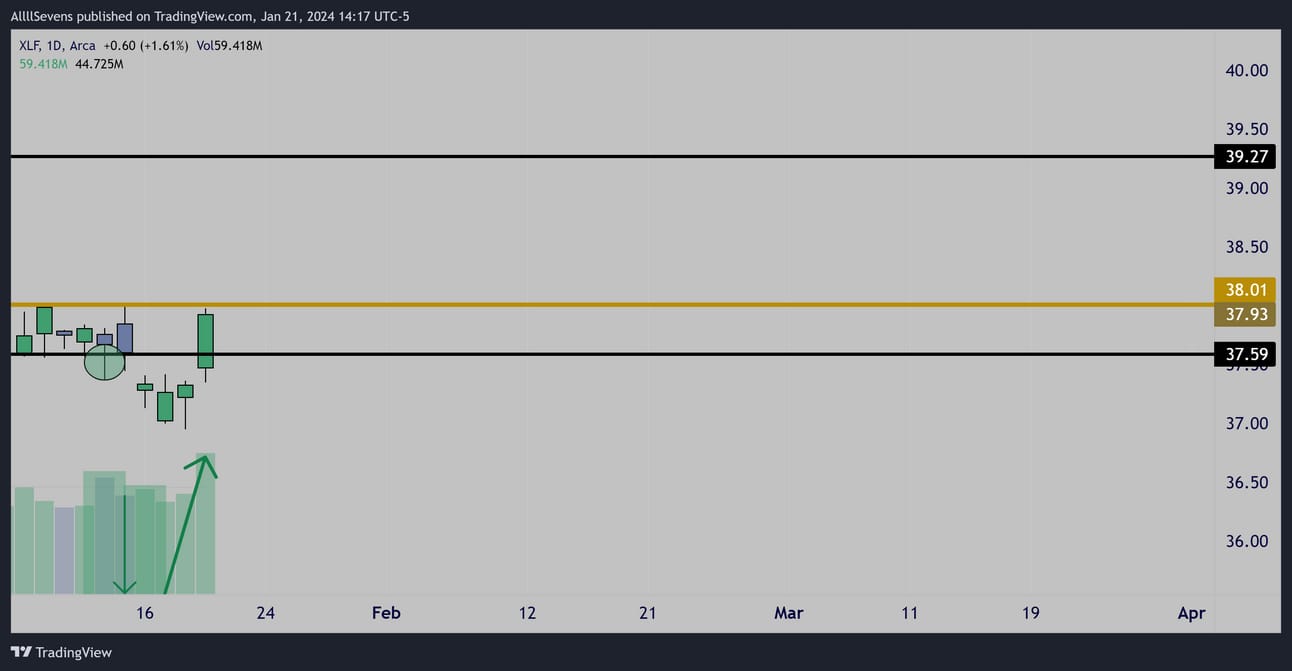
Daily
Very bullish daily patterns.
I definitely want to keep eyes on this next week,
But only if it can open OVER $38.01
If that happens, and I see high volume buyers on a retest, I’m long.
If that doesn’t happen, I’m observing.
XLY- Consumer Discretionary (10.56% weighting)
Long-Term Outlook:
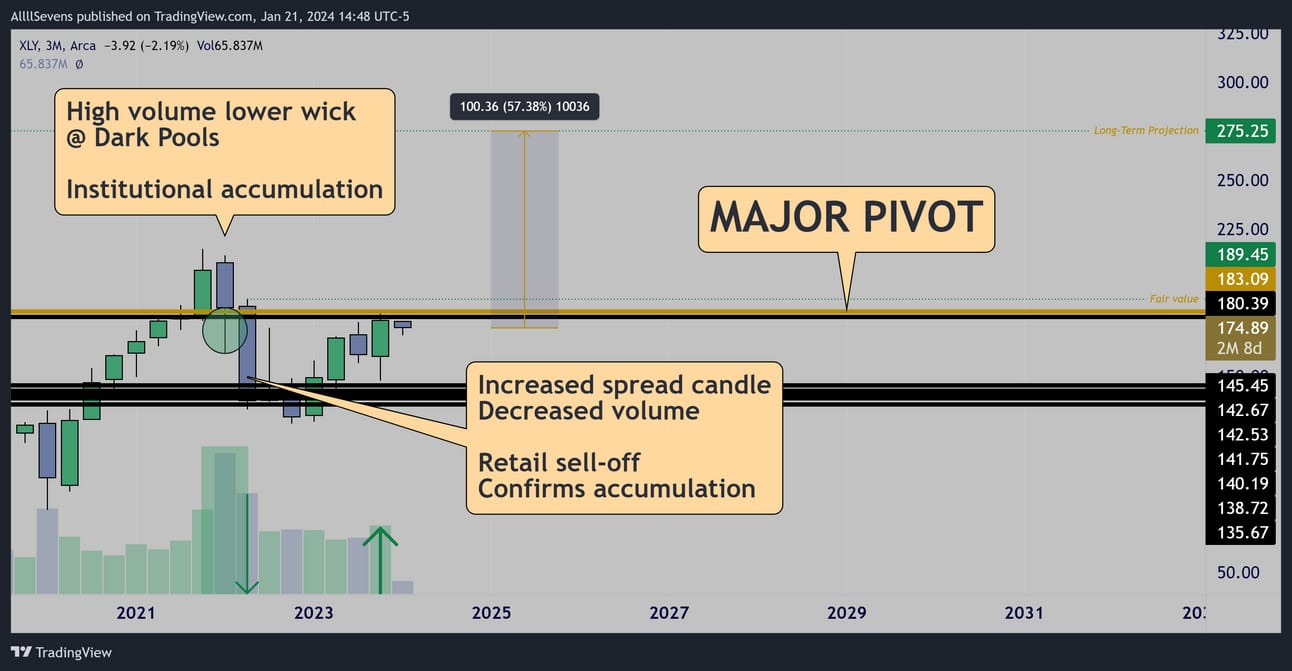
3 Month (Quarterly)
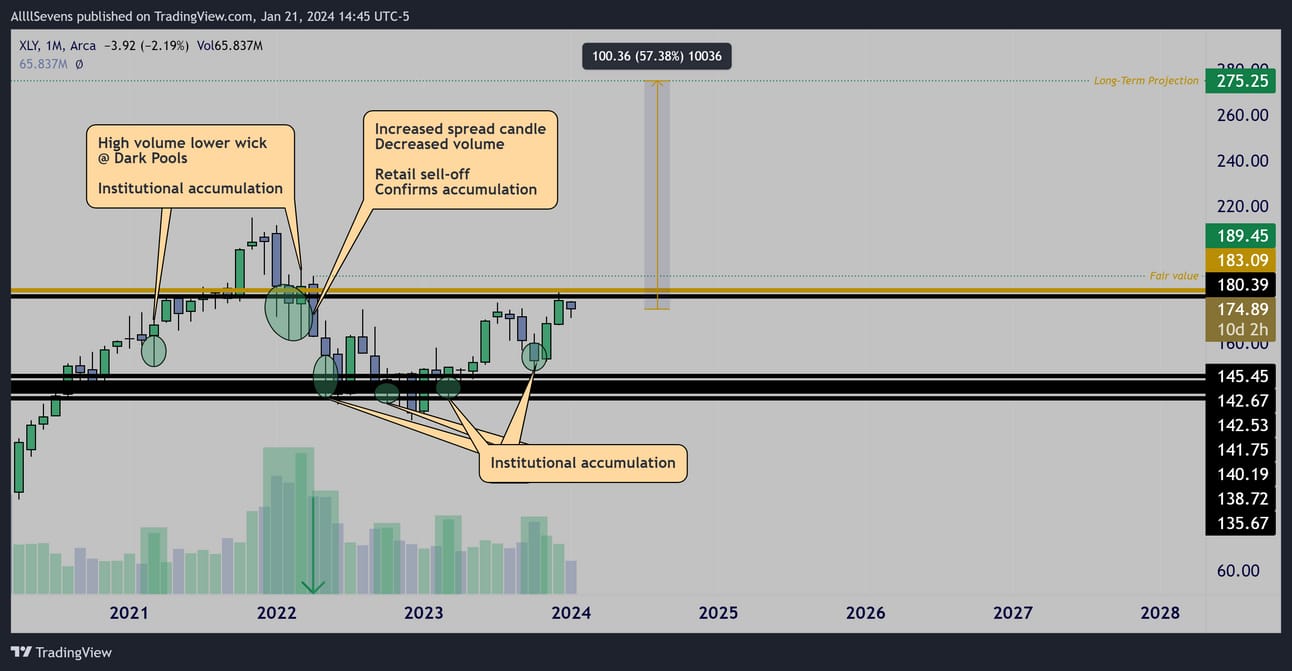
Monthly
The XLY is undervalued ($189.45)
Short-Term Outlook
Price is at it’s largest dark pool on record, $183.09-
An extreme pivot for short-term direction.
A breakout would spark a massive rally.
Inability to breakout, which is what has happened so far, leads to a further period of short-term consolidation or even a pullback to the next support.
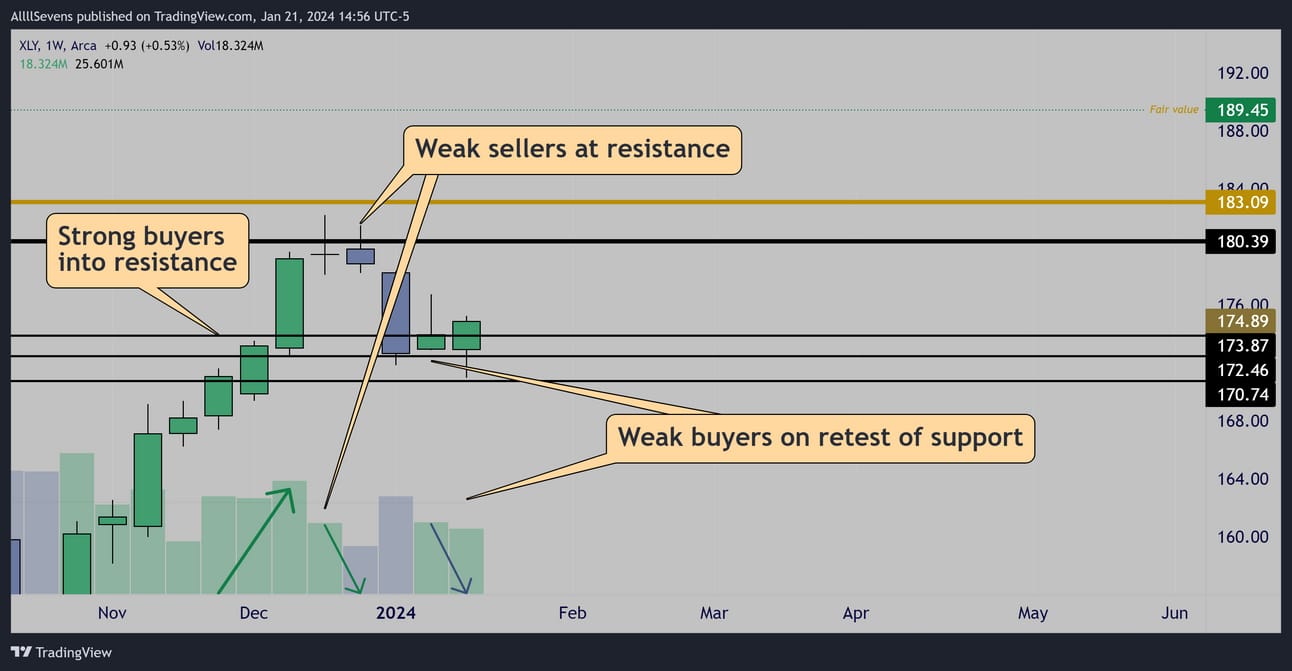
Weekly
Buyers were behind the wheel as price approached resistance.
Bears showed no strength once resistance hit, simply rejecting on low volume and falling into a period of consolidation.
As price retest’s support, (volume shelf), there’s no signs that buyers are being aggressive again.
This presents me with absolutely 0 edge in this sector.
Given the broader market, SPY, is strong, I favor bulls here but I’m not uber bullish until $183.09 gets broke with volume.
XLC- Communications Services (8.78% weighting)
Long-Term Outlook:
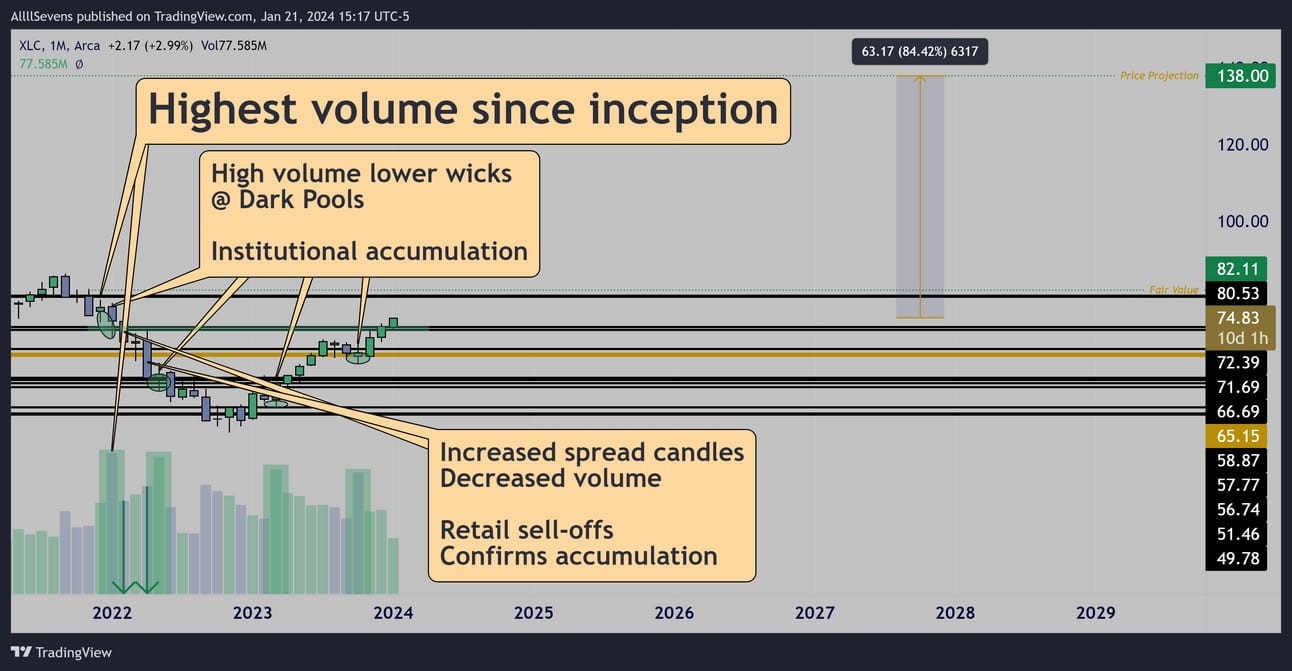
Monthly
The XLC is undervalued below $82.11
Short-Term Outlook:
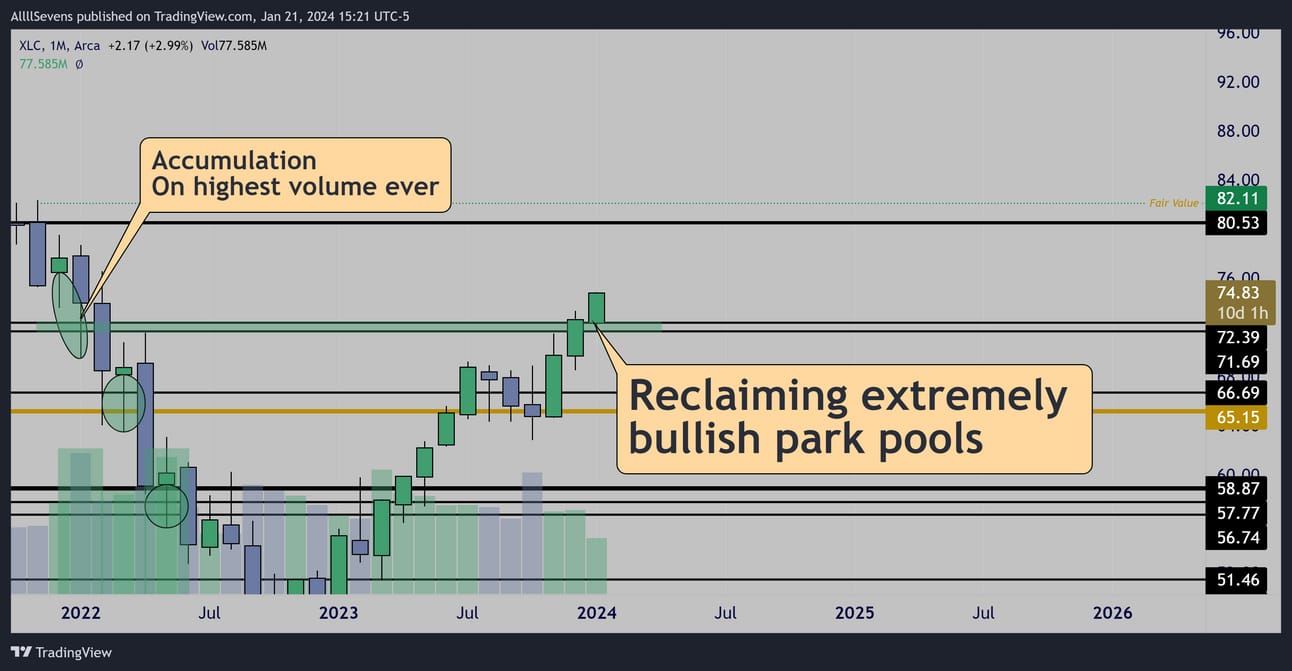
Monthly
$71.69-$72.39 dark pools experienced major institutional accumulation on the highest volume ever for this ETF back in 2022
As price reclaims this zone, it’s likely for trend to be extremely strong.
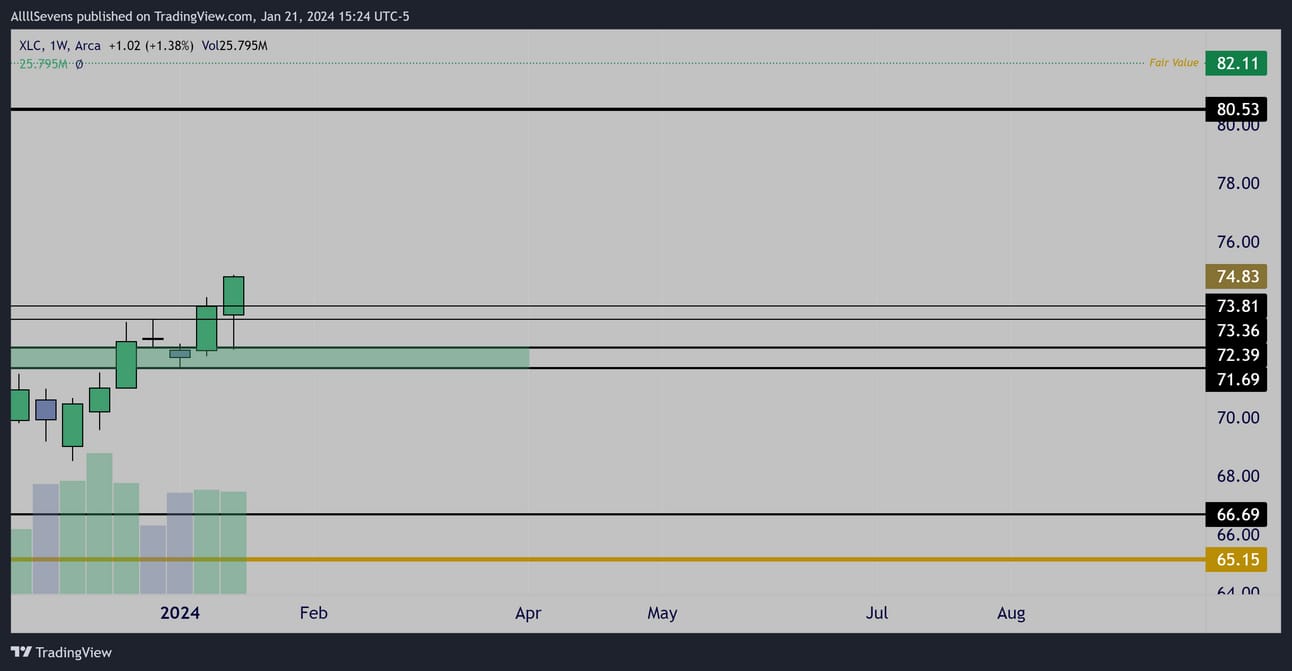
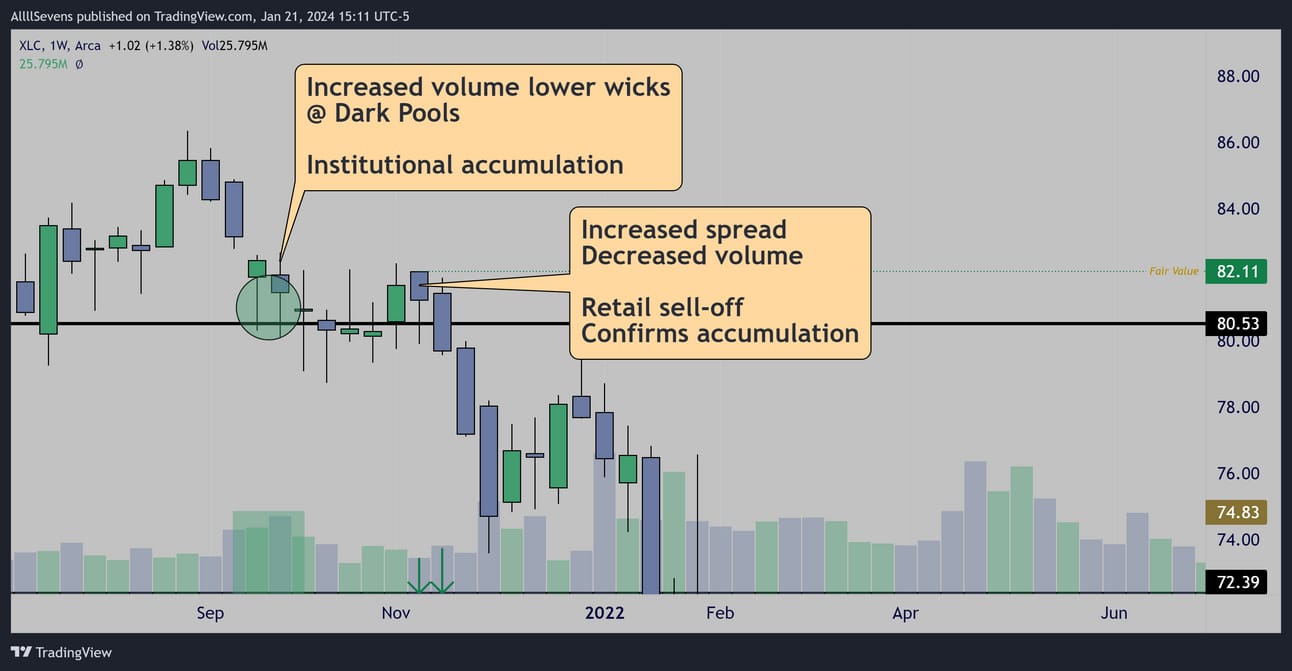
Weekly
There’s no real pattern here nor is there any aggressive volume.
All I can say is I’m extremely bullish this sector and as long as $71.69-$72.39 holds, I expect it to emerge as an extreme market leader.
Any retest’s would be amazing.
XLI- Industrials (8.62% weighting)
Long-Term Outlook:
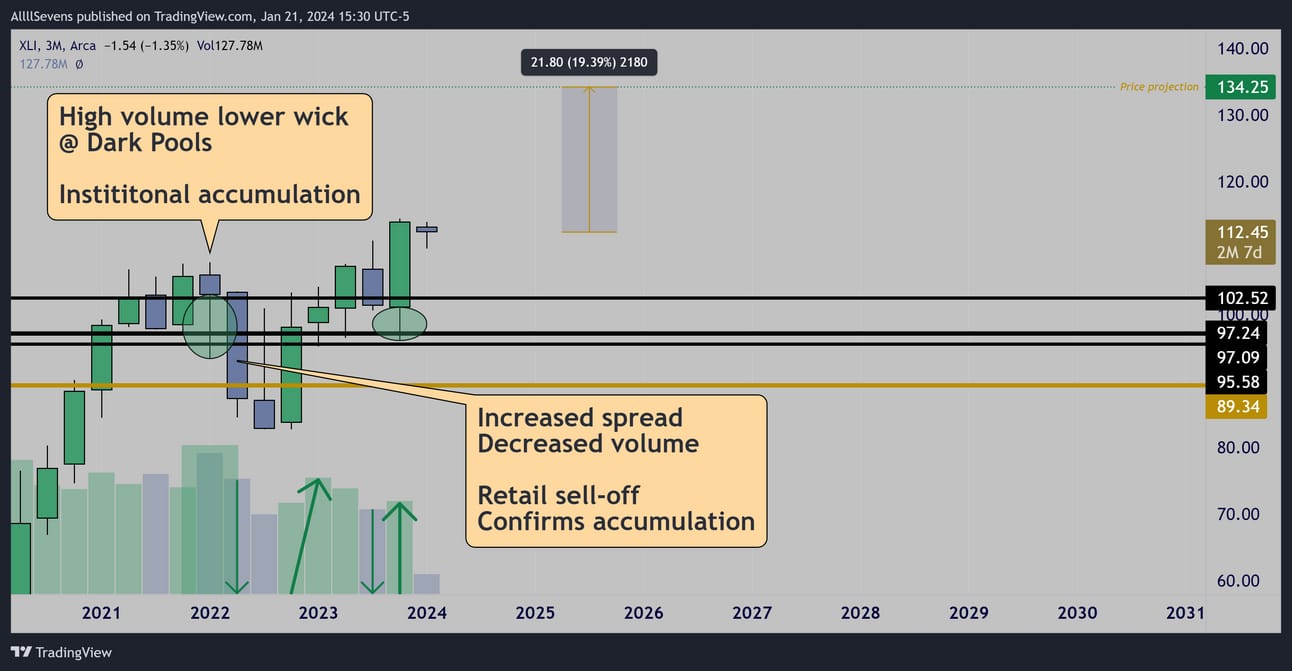
Quarterly
Short-Term Outlook:
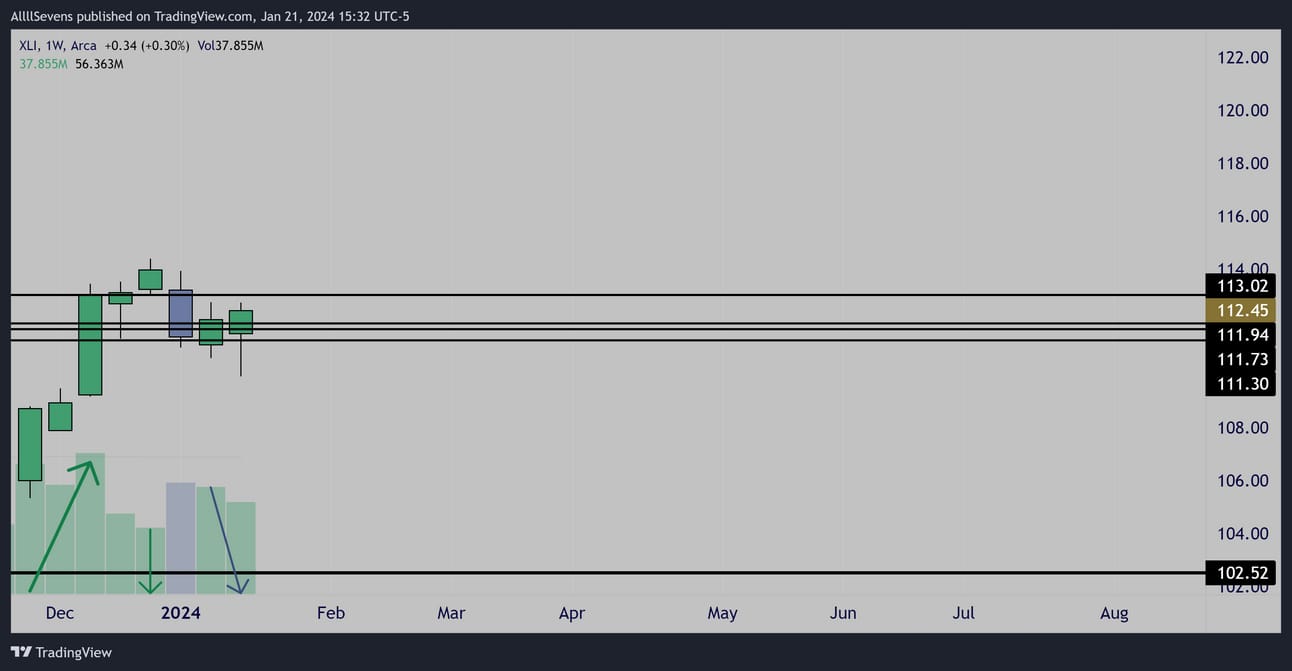
Weekly
Extremely similar to the XLY
Strong buyers a few weeks ago followed by a low volume rejection, and as price retest’s the volume shelf left behind from the high volume buyers, there’s no strong buyers stepping in once again.
If the current levels are lost, my long-term prediction is not invalidated, but a short-term period of consolidation or even pullback could occur.
XLP- Consumer Staples (6.17% weighting)
Long-Term Outlook:
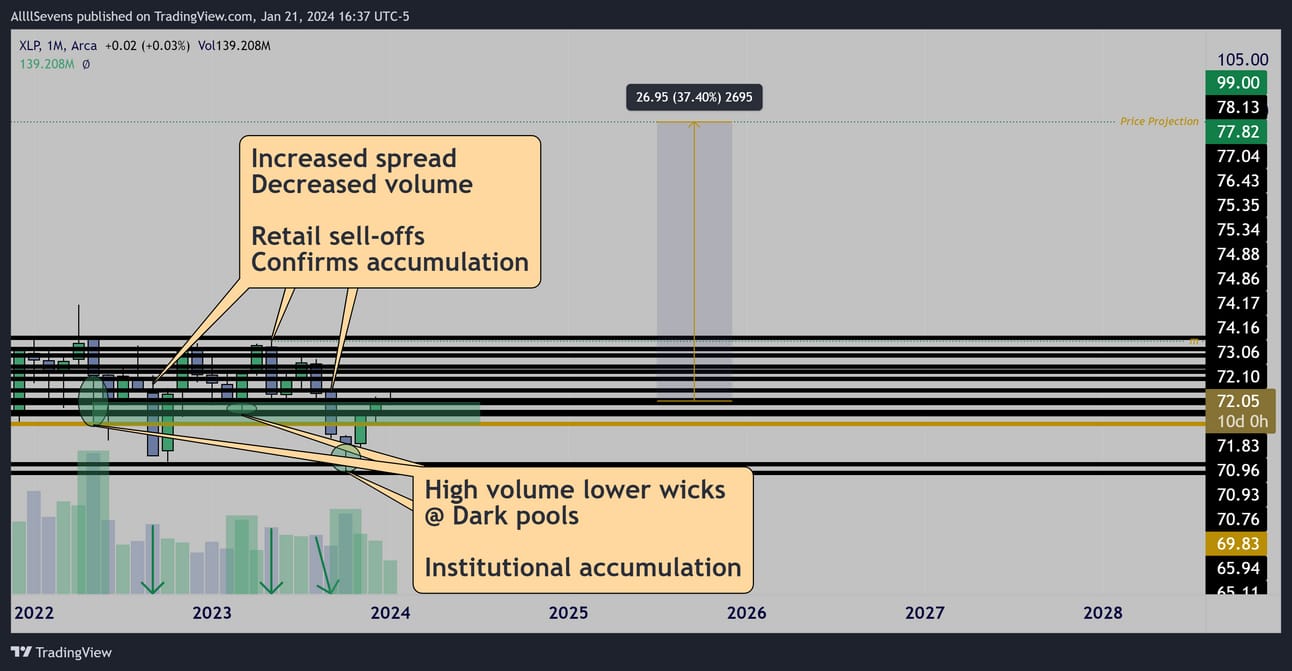
Monthly
The XLP is undervalued below $77.82
Short-Term Outlook:
This chart hurts your eyes…
There are a lot of levels very close in between. That’s just the way it is.
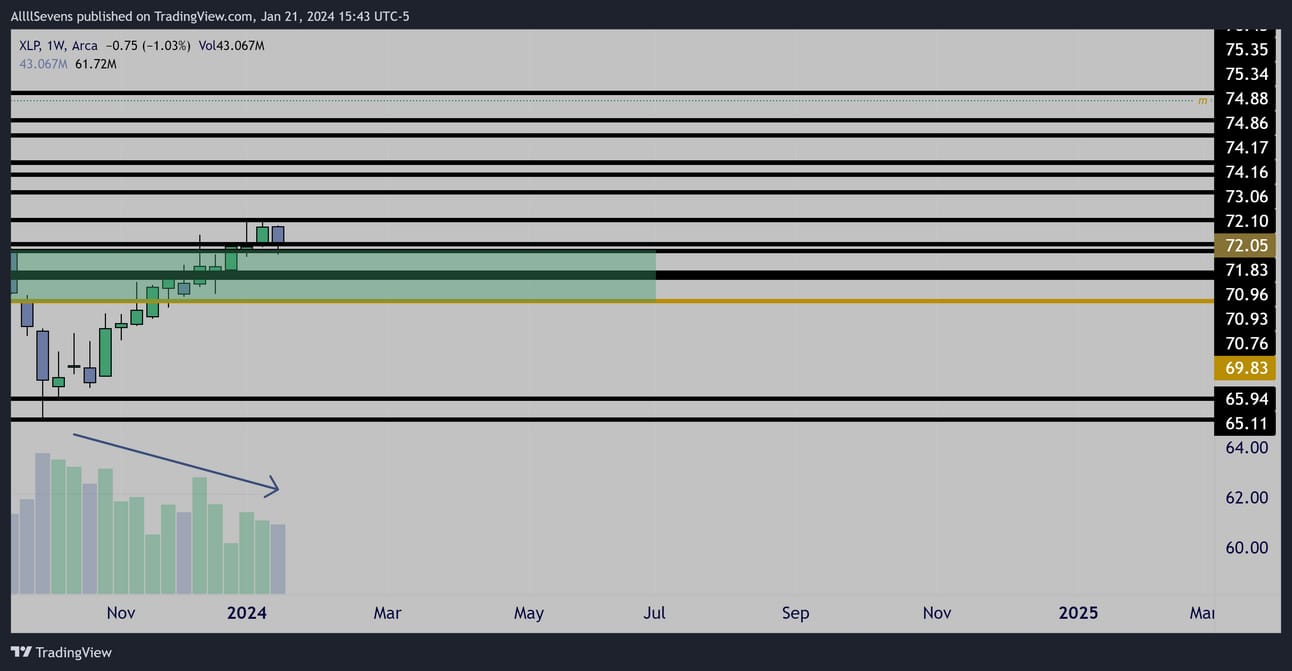
Weekly
As price rallies from the recent strong monthly low,
It’s doing so on decreasing volume which makes me hopeful for a retest of the strong previously accumulated levels it just reclaimed.
That s where I’m most interested in this sector.
I’m generally bullish short term over $69.83-$$71.83 but I’d really like to see a pullback into this zone and see high volume buyers confirm that a bounce is in play.
If a retest occurs and no volume steps in, then this can chop and be accumulate more before a long-term rally.
XLP is great to own, doesn’t look great to trade at the moment!
XLE- Energy (3.70% weighting)
Long-Term & Short-Term Outlook
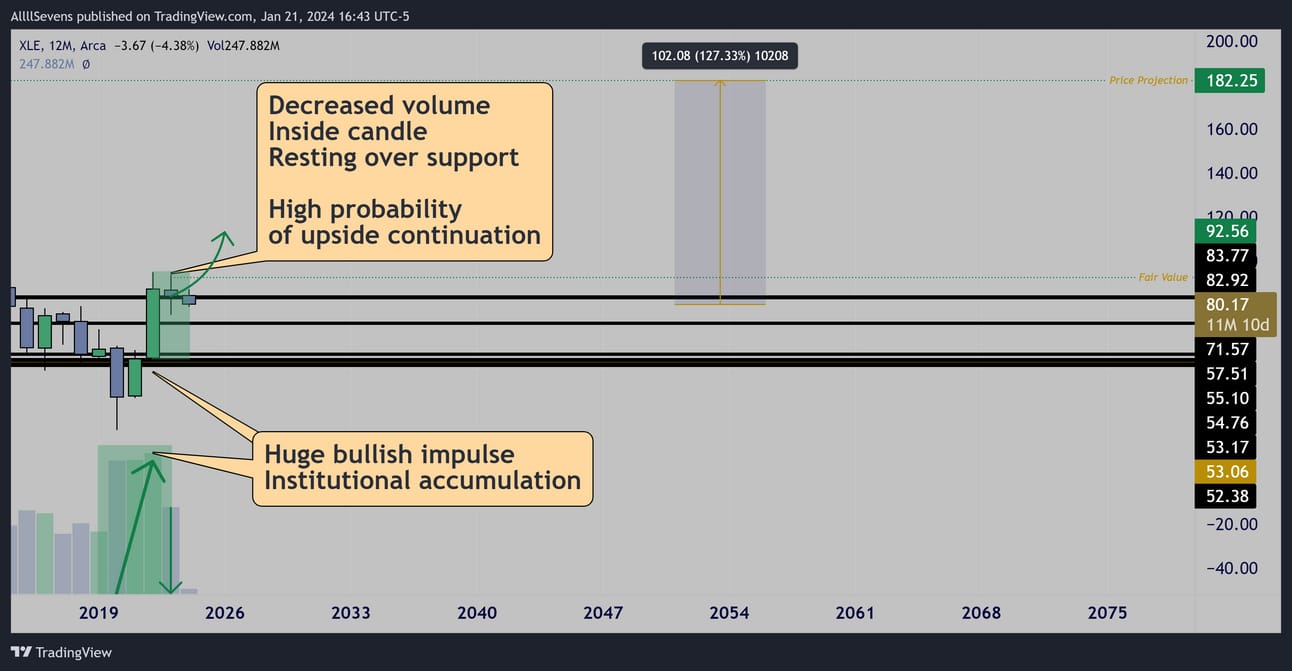
Monthly
This is easily the most interesting sector of them all,
And it has the most explosive upside potential.
Long-Term there’s no questioning where this goes. ($182.25)
The XLE is undervalued below $92.56
In the short-term, we have an extremely interesting setup here.
If this is going to see upside soon, it’s going to be THIS year.
The yearly candle is a perfect inside candle continuation pattern following a massive bullish impulse.
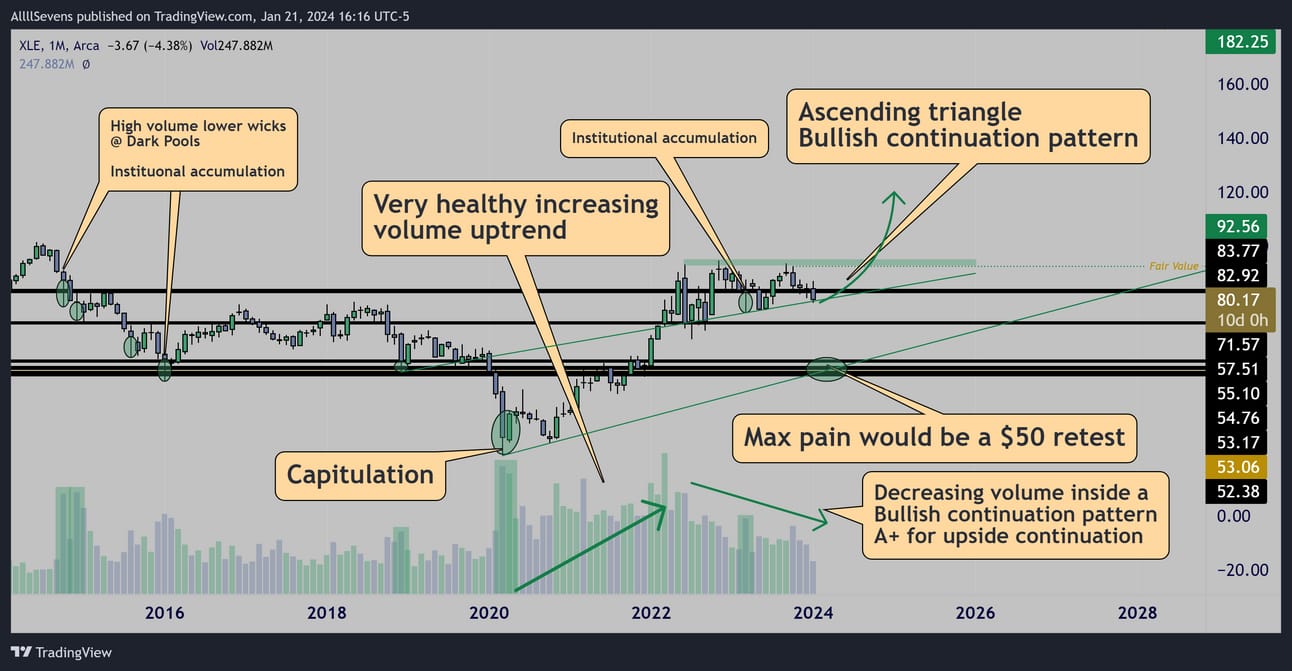
The monthly displays a similar continuation pattern:
A bullish ascending triangle.
The monthly also show us how long this sector has bee accumulated for…
This is why my projection is so high.
Price compression for over 10 years will inevitably lead to large expansion, and in this case, upwards expansion.
If a reversal does not begin relatively soon, then unfortunately this could be in trouble short-term with no strong support until the $50 range which would also be a major trend support.
The long-term investor wants this!
The short-term trader is cautious of this…
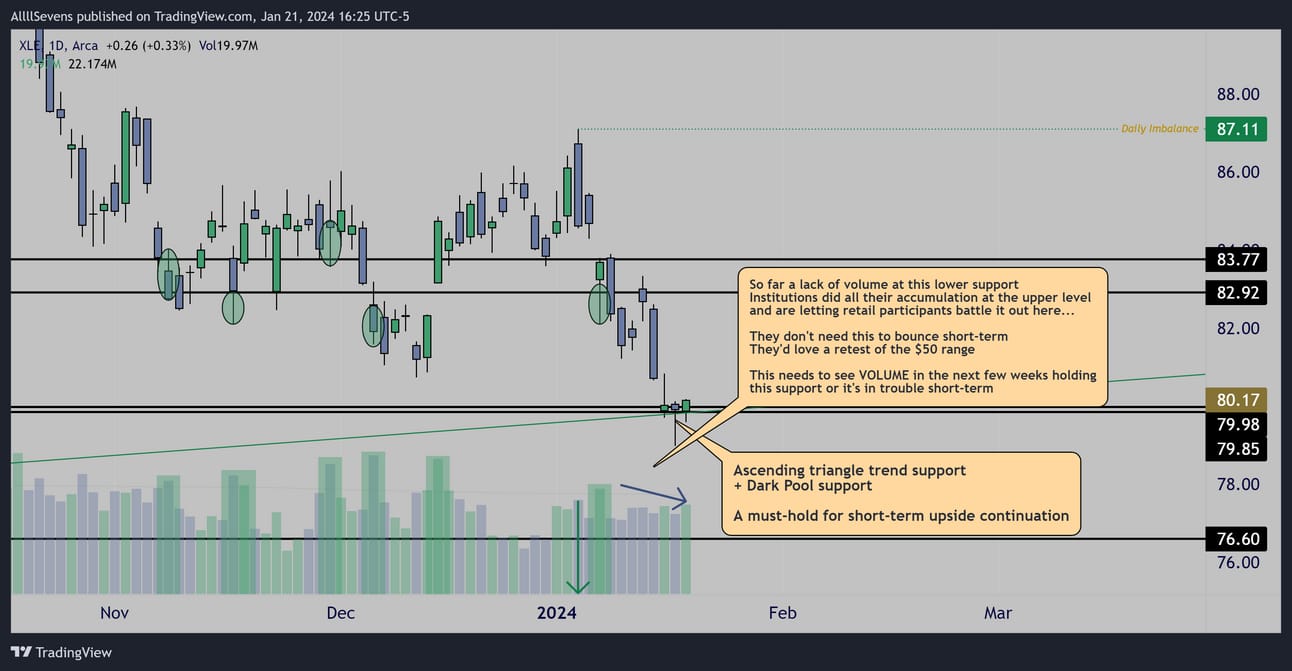
Daily
This sector is at an EXTREMELY pivotal spot.
Institutions have been heavily accumulating this for the last few months, but retail has been zoned in on selling out of a great long-term investment due to their impatience.
As price test’s this final support before a large downside range opens up, institutions seem to have stopped aggressively adding longs…
They’d rather add more risk at lower prices in case retail participants still don’t want to buy here.
This makes so much sense to me.
So how am I approaching this?
I’m not going to gamble on whether or not this can bounce here.
Just like the institutions, I’m going to let other retail participants make the first move here.
I want to get long only if this trend and support holds, leading to a strong reclaim of the accumulated levels above.
THAT would be the best entry long.
Confirmation will have occurred, and did we really miss out on that much a move compared to how much this can rally into years end? Nope.
Being aggressive and impatient with your trades does indeed offer the highest potential reward, but it simultaneously takes on the most risk.
Being patient with your trades offers slightly less reward and much less risk. Which strategy do you think leads to long-term profitability?
XLRE- Real Estate (2.40% weighting)
Long-Term Outlook:
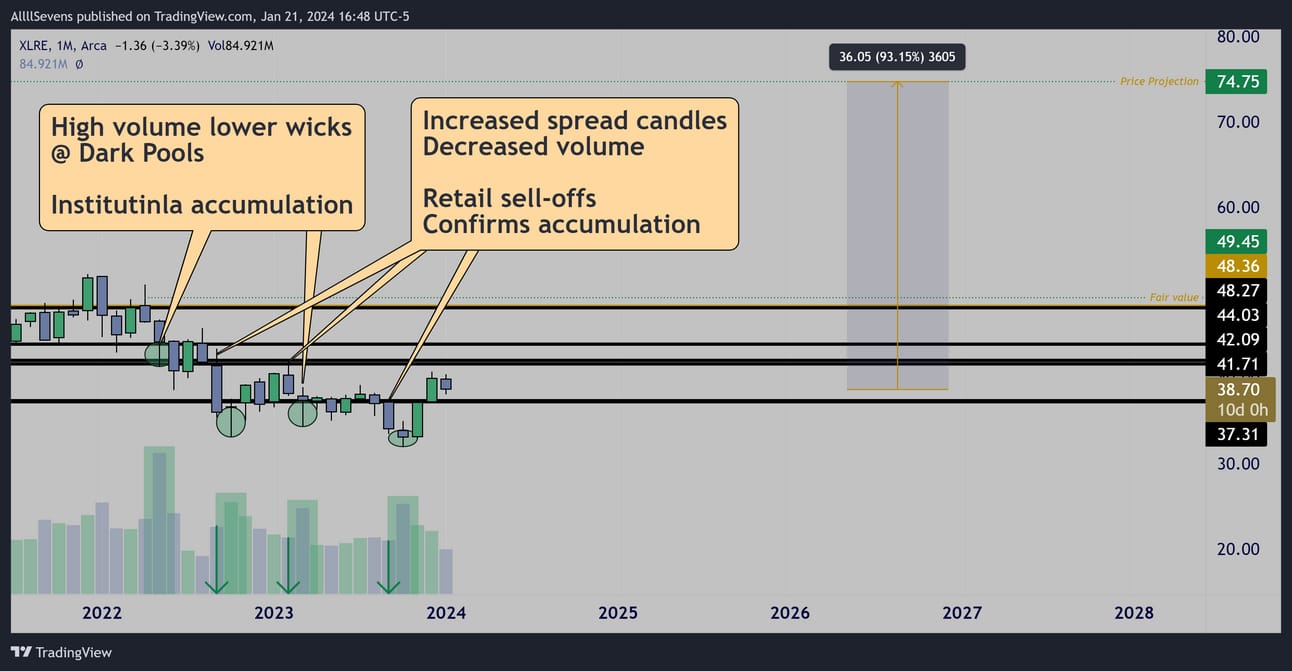
Monthly
The XLRE is undervalued below $49.45
Short-Term Outlook:
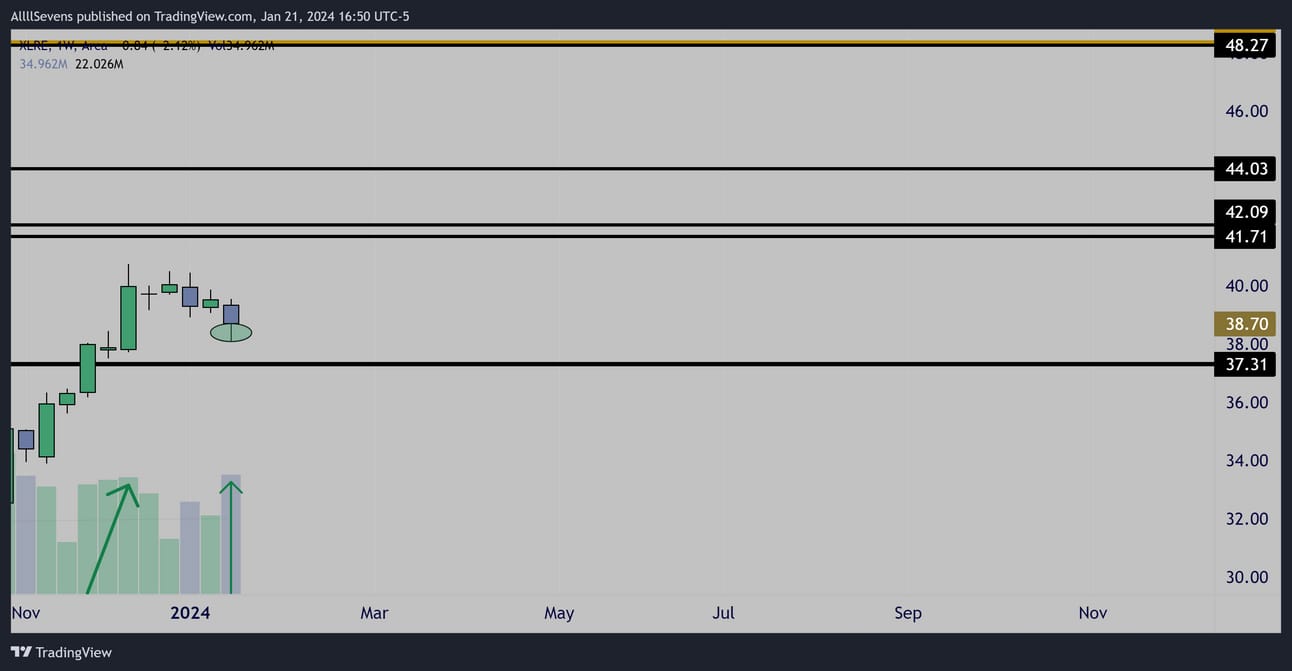
Weekly
Following a massive bullish impulse on the quarterly chart, reclaiming $37.31 support, price has fell into a bullish consolidation.
I’m watching for any retest’s of this level and high volume buyers stepping in for me to join in.
Otherwise, I will hop in later when the current monthly downtrend breaks and the $40 levels are broke.
If $37.31 cannot be defended short-term it does not change my long-term outlook it just means further accumulation is needed before a sustainable reversal can take place and it would no longer be on my short-term watch for upside.
XLB- Materials (2.31% weighting)
Long-Term Outlook:
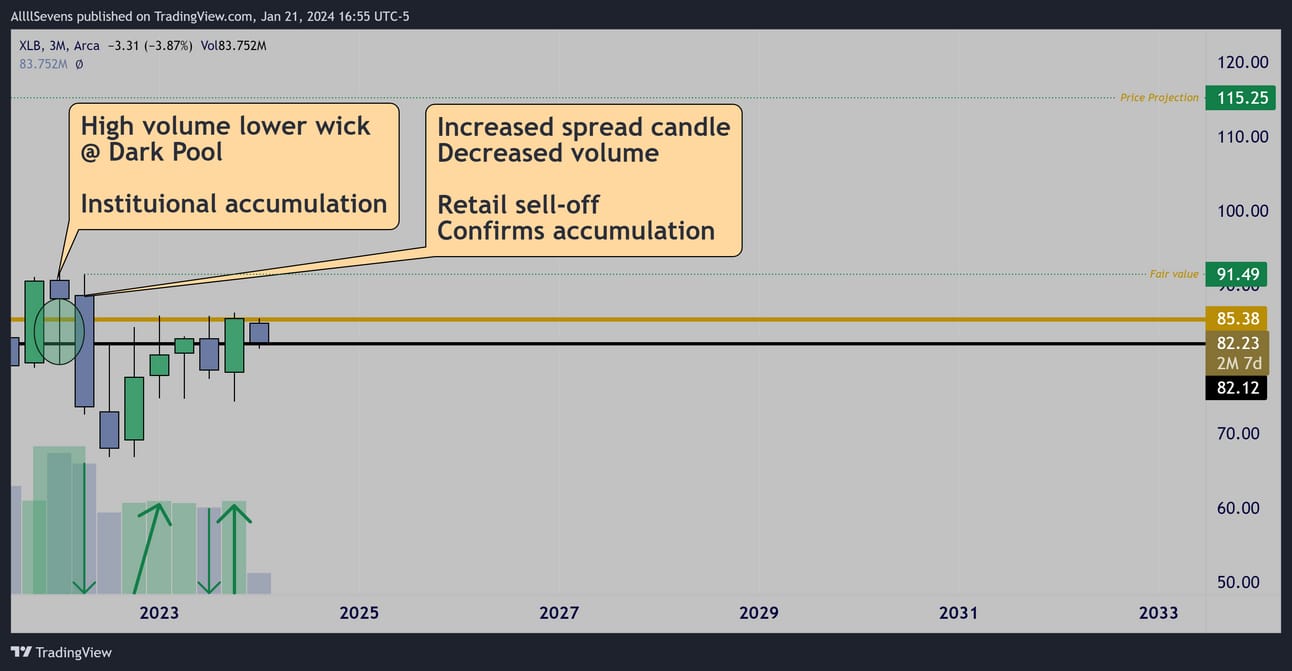
3 Month (Quarterly)
The XLB is undervalued below $91.49
Short-Term Outlook:
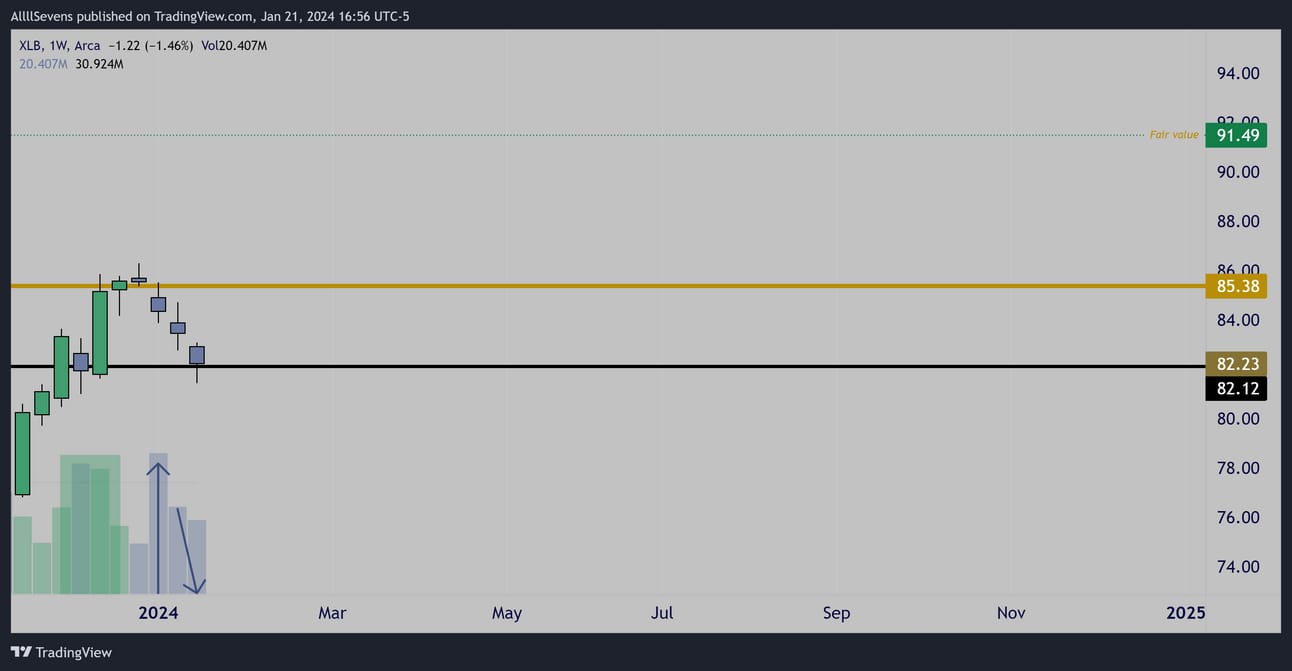
Weekly
Following a large bullish impulse to end the year with close over the largest Dark Pool on record, a gap down occurred…
This puts the ETF in a vert strange spot where high volume rejected the retest of the lost support and there is now a lack of buyers stepping in at this lower support.
This does not change my long-term outlook.
I’m extremely bullish, but short-term I don’t really like what I see here for upside continuation.
XLU- Utilities (2.25% weighting)
Long-Term Outlook:
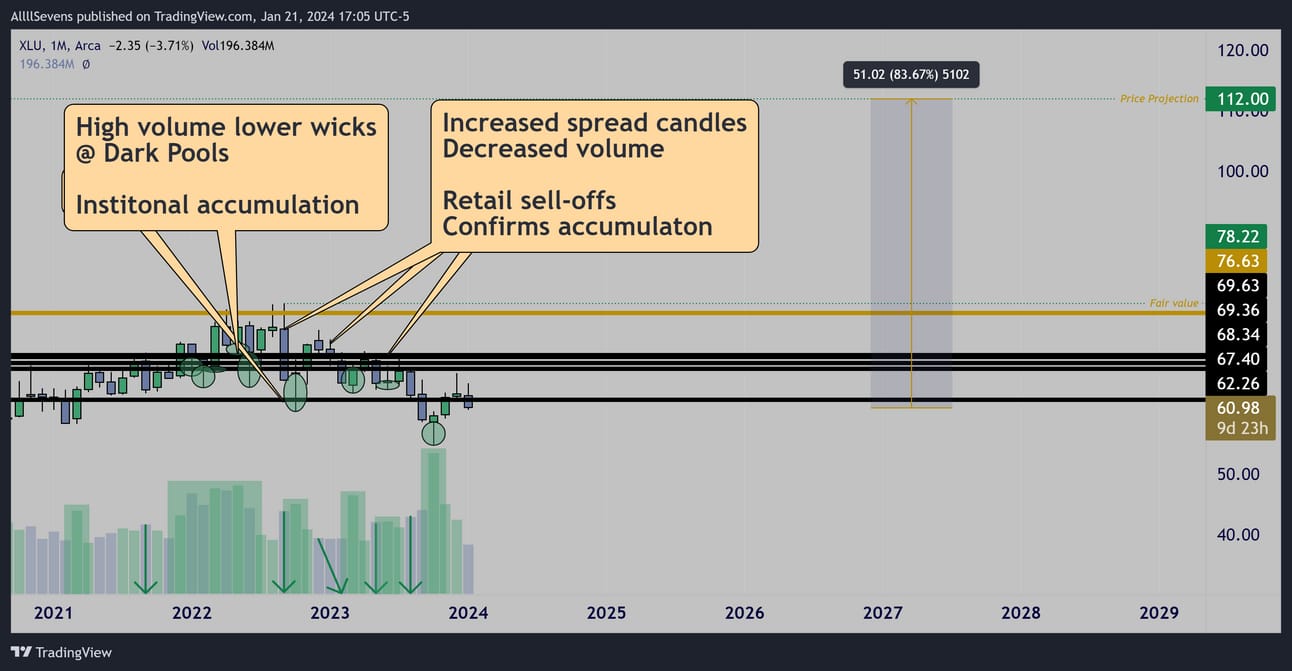
Monthly
The XLU is undervalued below $78.22
Short-Term Outlook:
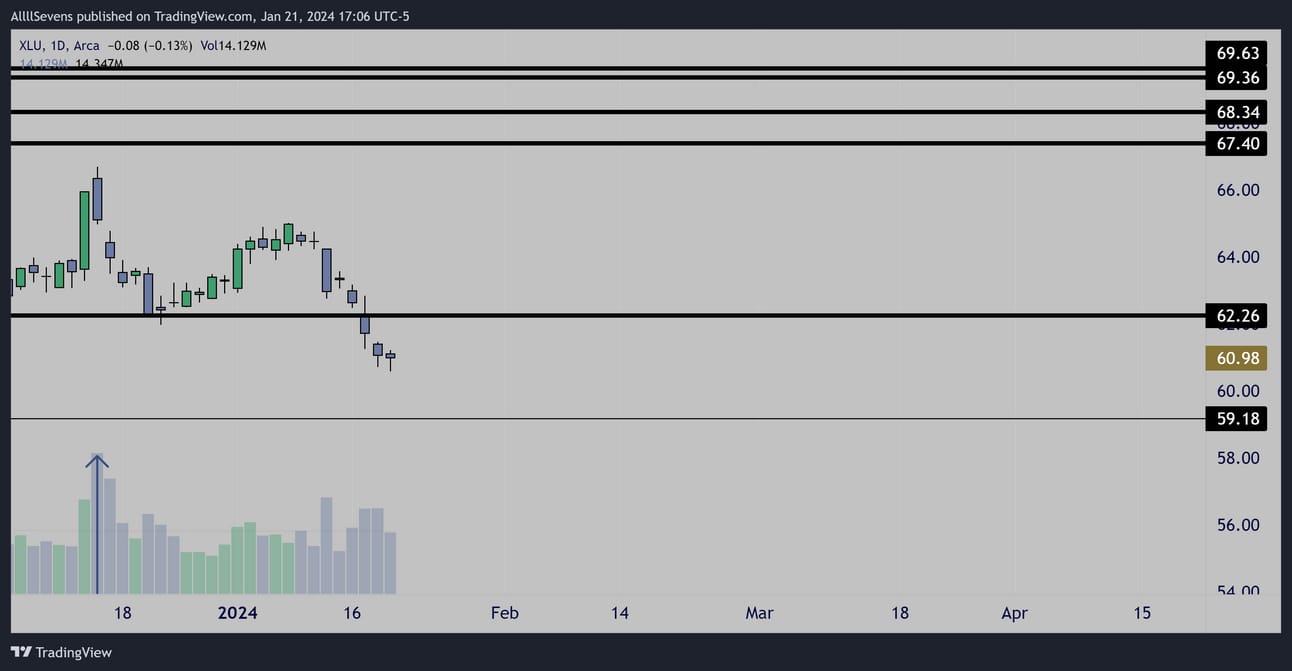
Daily
This still isn’t respecting any supports in the short-term and and is in a heavy monthly downtrend.
It ended the year with a huge volume top, which is not helping the situation. It likely takes some time for this to re-base and attempt another short-term rally to break the monthly downtrend.
I need a reclaim of support to be very bullish here.
I’ll also watch this $59 area below for any major volume anomalies signaling a potential bottom.
Conclusion
Long-term,
The SPY itself is no longer undervalued.
Neither is the XLK or the XLI
Every other sector is undervalued and has a lot of catching up to do. Watching these sectors in the short-term will be critical to measuring SPY’s momentum.
Short-Term,
The SPY looks extremely strong headed into next week, but it’s not near any levels for me to execute from. Last week’s newsletter provided a very actionable trade from support.
This week looks like all there is to do is hold!
Unless support is retested, there’s nothing for me to do on the index itself. My focus will be elsewhere…
Let’s recap the sectors:
The XLK is showing the most relative strength, with a pivot below to watch as support.
Individual names in this sector should continue to show strength.
AAPL for example.
The XLV is in a tricky spot- showing us either side could take control, heavily dependent on whether or not price can hold support over the weekend. If it opens over support next week and high volume buyers appear on a retest, individual names in this sector could heat up.
If price gaps below support, this sector could be relatively weak.
The XLF is at a critical pivot and I will be watching to see whether or not it can gap up over it’s largest Dark Pool on record next week, turning it into support and potentially prepping for a massive breakout.
If there is no gap up next week, price could still breakout, but I’d be extremely cautious as both the monthly and weekly candles will be testing the levels from underneath and if a breakout fails could leave a major upper wick, which I would not want caught in.
If price does not gap up next week and still tries to breakout, I will need to see MAJOR volume come in on retest’s of the broken levels.
Then, I’d like to see a daily candle open over and successfully retest support on extremely high volume.
This is rather nuanced and subjective and the only way to truly know what I mean will be to see my twitter feed for live updates:
https://twitter.com/SevenParr
My a second favorite financial name in the case of a gap up is SCHW
The XLY is at the bottom of my list for a short-term trade.
I wouldn’t focus on names in this sector for strength or weakness.
It looks extremely choppy, probably gravitates to resistance but haven’t seen strong buyer on this retest of lower support.
The XLC, while extended from support just like the SPY could show major relative strength in the coming weeks.
I have eyes on indivudal names in this sector.
XLK and XLC definitely look like leaders.
The XLI, like the XLY is not my focus at all.
Very similar looks.
The XLP has my attention if it can make a decent pullback into support and see high volume buyers catch the knife. Otherwise, not interested and if it gravitates up I’ll miss it.
The XLE does NOT have my attention this week.
I explained that we can clearly see institutions are letting retail participants gamble and battle this out. I have no interest in that.
I’ll miss the move up to reclaim support if it happens, and I’ll go long over support and make slightly less money, with less risk!
The XRLE has my attention if it retest’s support and shows high volume buyers stepping in.
The XLB does not have my attention. If I had to bet money on a sector being relatively weak this is the one I’d choose. With that said, because the overall market is so strong, I won’t be trying to short this, I just don’t see me missing a large bullish move here.
The XLU needs time to re-base before I focus here.
Overall, I’m not super focused on the SPY this week…
I have two stocks I am focused on…
But after that, I’m EXTREMELY focused on the Russel 2,000 (IWM)
This week, and likely the entire year of 2024
ZM
Long-Term Outlook:
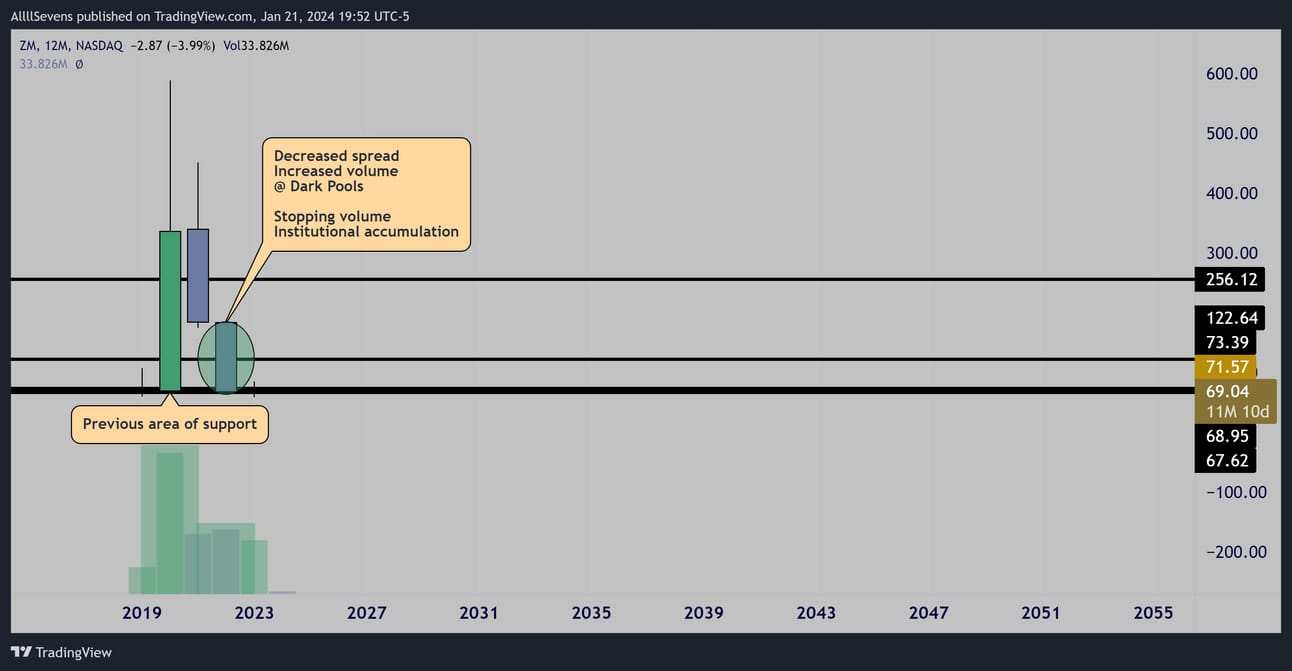
Yearly
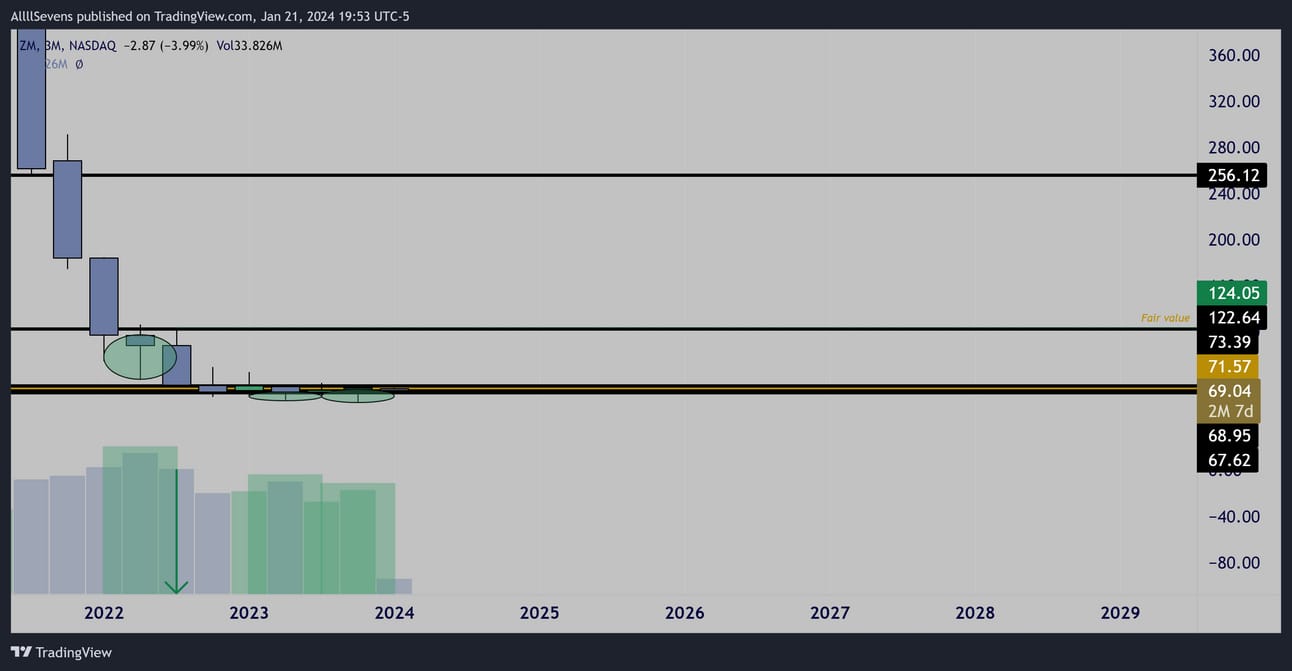
3 Month (Quarterly)
ZM is undervalued below $124.05
Short-Term Outlook:
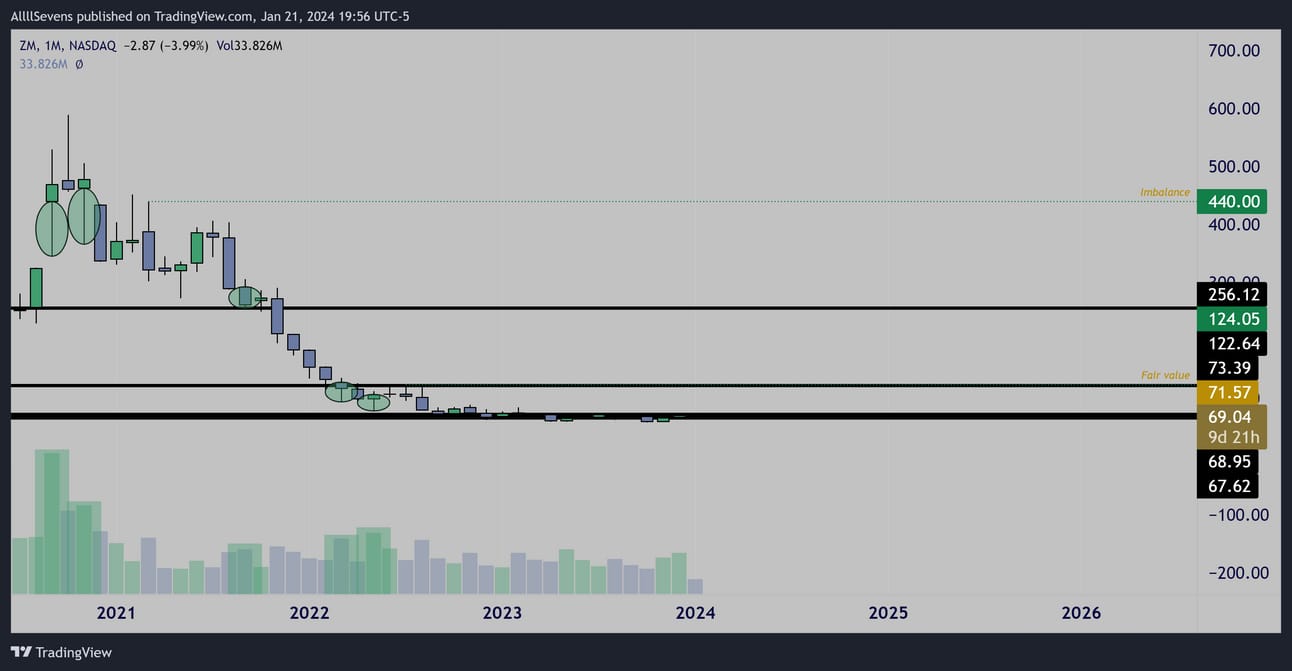
Monthly
The monthly chart really makes you think…
Technically, there is an imbalance at $440
Anyways-
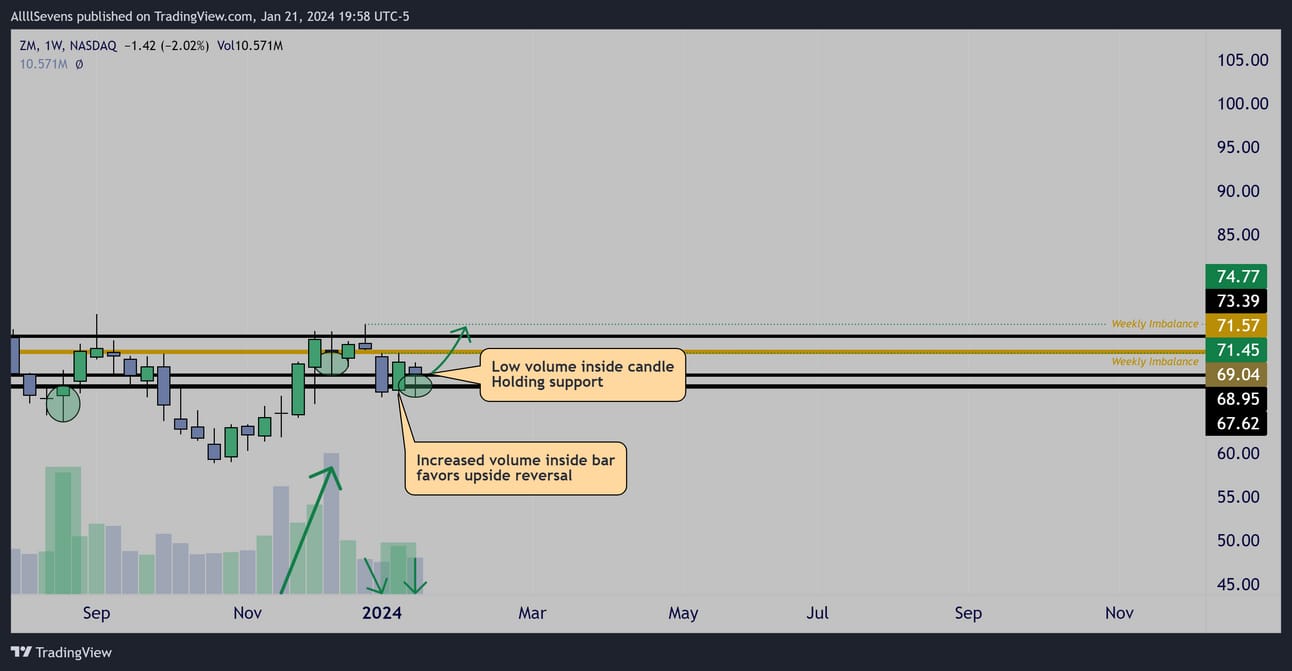
Weekly
A pretty solid weekly pattern here-
If $67.62 can continue to be defended by high volume, a major breakout over the levels above could finally take place.
Failure to hold this support would not invalidate my long-term bullishness, but I’d definitely need to manage risk short-term and shift my focus until it set up again.
Over this $71.50-$73.50 resistance, range opens up all the way to $120
Unusual Options Flow

$780K Calls Bought
ETSY
Long-Term Outlook:
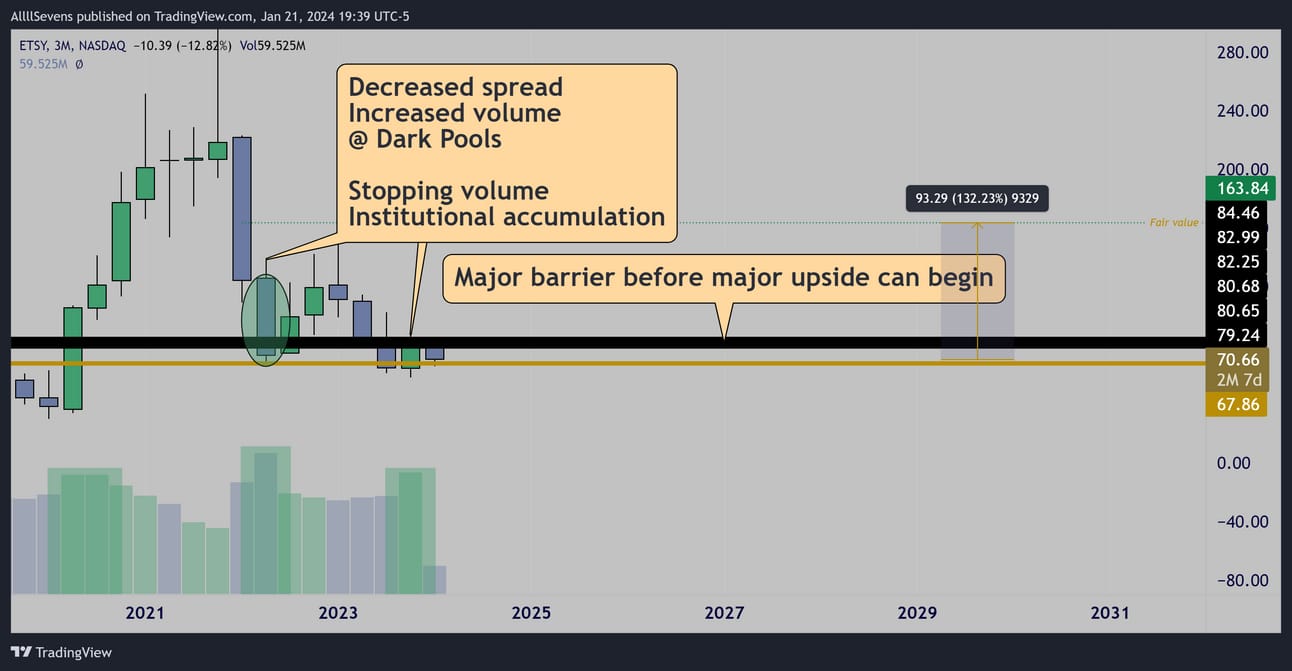
3 Month (Quarterly)
ETSY is undervalued below $163.84
Short-Term Outlook:
Until price reclaims the $80-$85 cluster, there’s really no reason to get super excited about this stock.
It did just see it’s largest Dark Pool on record down here at $67.86 though, so that is a good sign that institutions are attempting to create strong support down here, to eventually ignite a breakout.
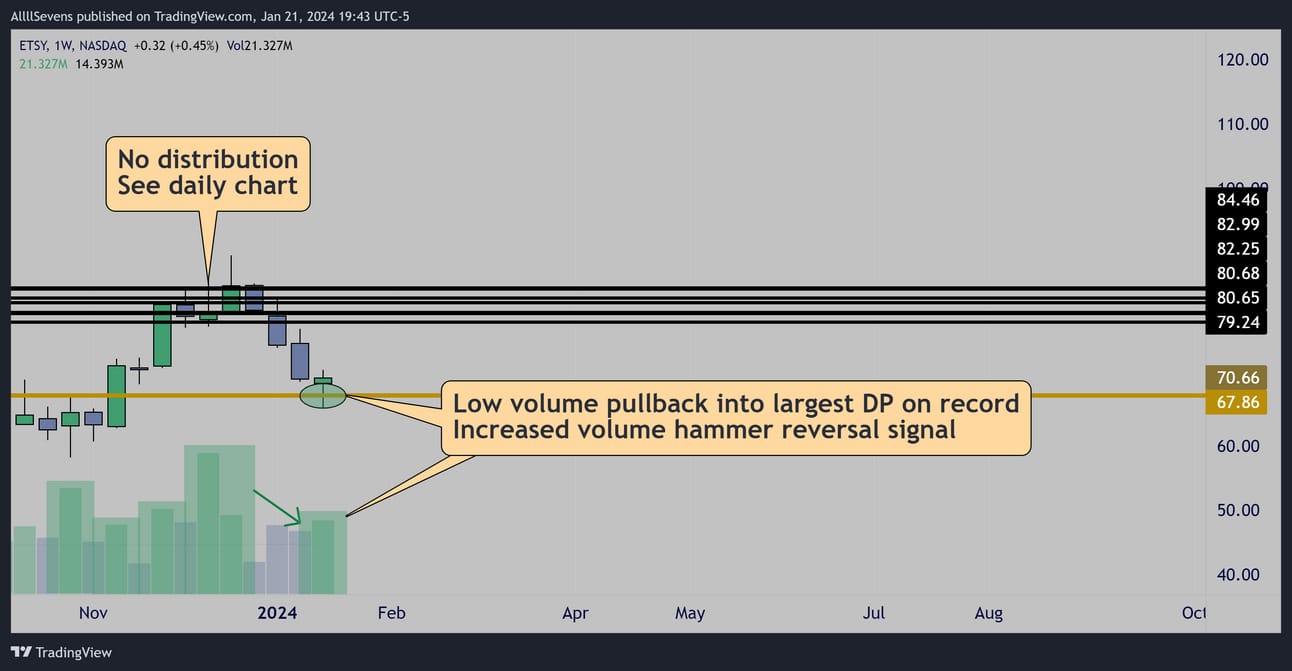
Weekly
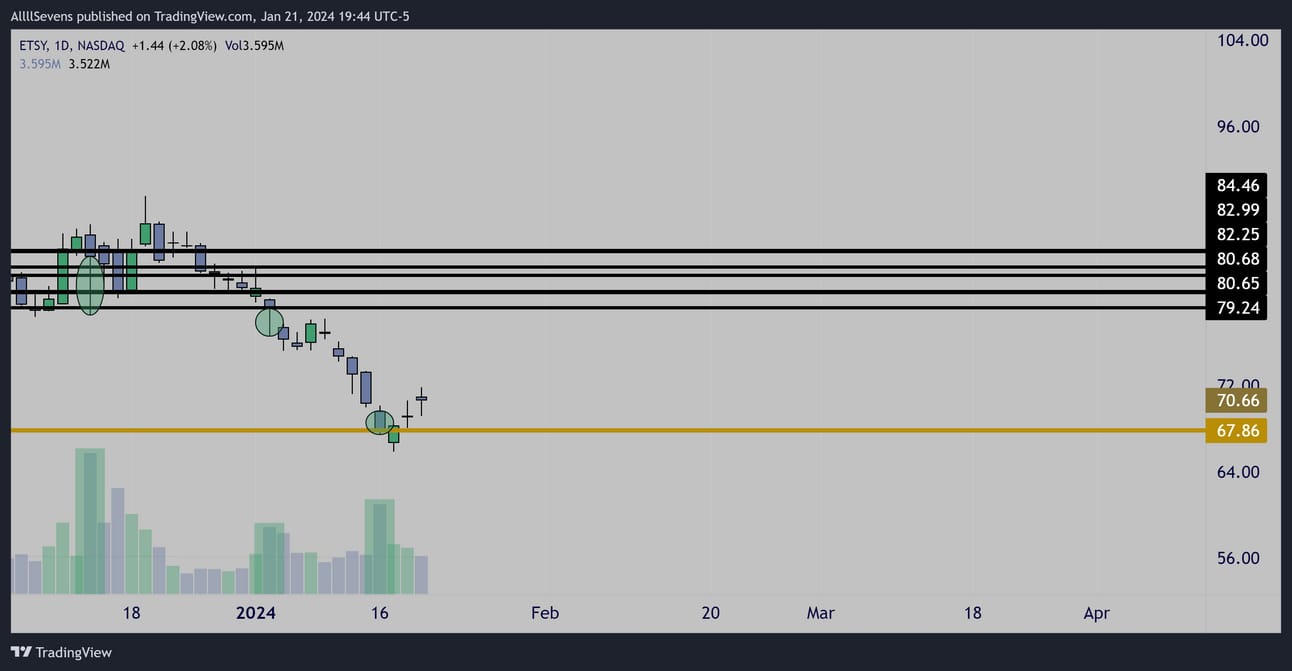
Daily
Very clean patterns on the Daily and Weekly charts.
As long as $67.86 is defended with volume, I push back towards $79.24 is likely.
For more upside, $80.65 needs to get reclaimed via a weekly / monthly candle open OVER this level. That could take some work.
Remember, the real move on this stock does not begin until it’s over this $80-$85 zone. I’d like to take starters down here, and really size up on confirmed break back over $80-$85
If $67.86 is not defended by volume, and price loses this level this week, I’ll have to manage risk in the short-term and wait for it to setup again.
My long-term analysis would not be invalidated, it would just mean retail participants are still not ready to chase this back up.
Unusual Options Flow
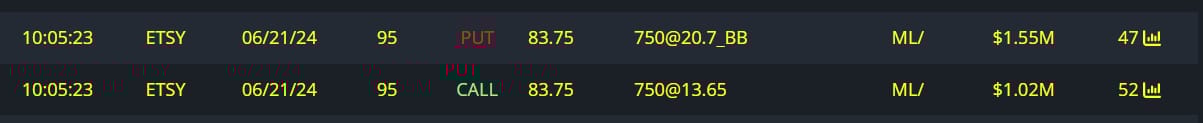
$1.5M Full Risk Bullish Order
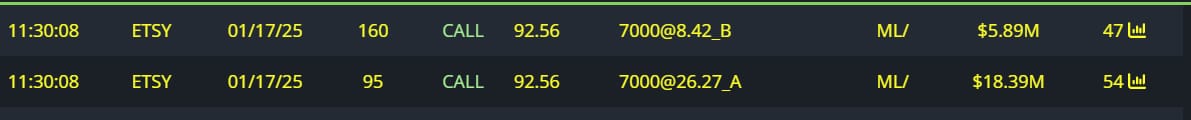
$12.5M Bullish Call Spread

$1.4M Calls Bought

$360K Calls bought
We-Bull Referral
https://a.webull.com/70Kp9cTCDSzfJtjKR2

AllllSevens+
It took me HOURS to write the newsletter above…
It took me even longer to write the newsletter below.
I really want to share my IWM analysis for free, but I genuinely put so much work into this, and I KNOW how valuable it is.
I don’t want people reading it if they don’t truly value this data.
All I ask for is $7.77
If the analysis I present to you is correct…
$7.77 is an absolutely insane deal. Criminally cheap.
With an AllllSevens+ subscription, you get access to the content below, all my past content, all future content as long as you’re subscribed and access to my Discord as long as you’re subscribed.
Reply