- AllllSevens
- Posts
- FOMC Was A Bull Trap
Disclaimer
I am not a legal professional.
The content shared in this newsletter is purely my personal opinion and for information purposes only.
You should not interpret any of this as investment or financial advice.
The statements I make are not solicitations, recommendations, or endorsements to buy or sell a security or financial instrument.
I am not a fiduciary on account of your viewing of this information.
You are solely responsible for the risks involved with the use of any information shared in this newsletter.
By using this site and reading this newsletter, you agree to not hold me, my affiliates, or any third party liable for decisions you might make based of information shared in this newsletter.
Preface
I am extremely bullish the S&P500
The 2022 correction allowed for historic institutional accumulations on the index AND across every single sector ETF. I believe the result of these accumulations will be historic bull-run over the coming years.
Two weeks ago, I wrote an entire newsletter explaining why I think The Bull Market Hasn’t Even Began. Be sure to read that if you have not.
In this week’s newsletter though, I will explain why I am actually “risk-off” at the moment- not looking for the current uptrend to continue just yet.
A pause in trend or even a pullback is beginning to shape up.
SPY
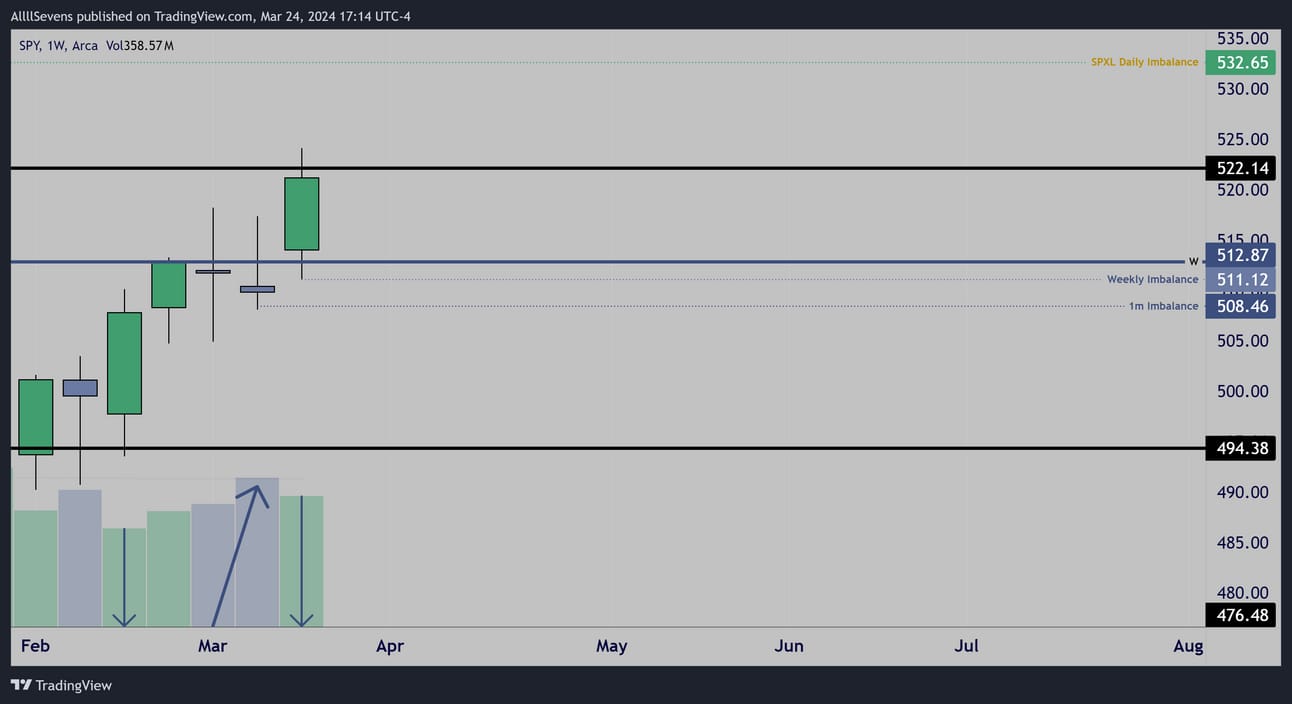
Weekly
Instability.
In February, price rose from $494.38 on extremely low volume which is not inherently bearish, but, now that volume has began to come in on a clear rejection of $512.8 it shows seller’s first attempt to gain control of the tape in MONTHS
Last week, price gapped above $512.87 despite the sell pressure which naturally turned it into support and allowed for a low volume retail rally. The low volume last week confirms the sellers from $512.87 are still active and did not flip long after FOMC or else volume would have been higher on the rise up.
I believe bulls are trapped.
Everyone thinks FOMC just opened the flood gates for a move higher…
Retail flooded into long positions last week!
If price opens below $522.14 tomorrow, I believe those same emotional traders/investors who fomo’d in on the way up will be the same ones panicking on the way back down.
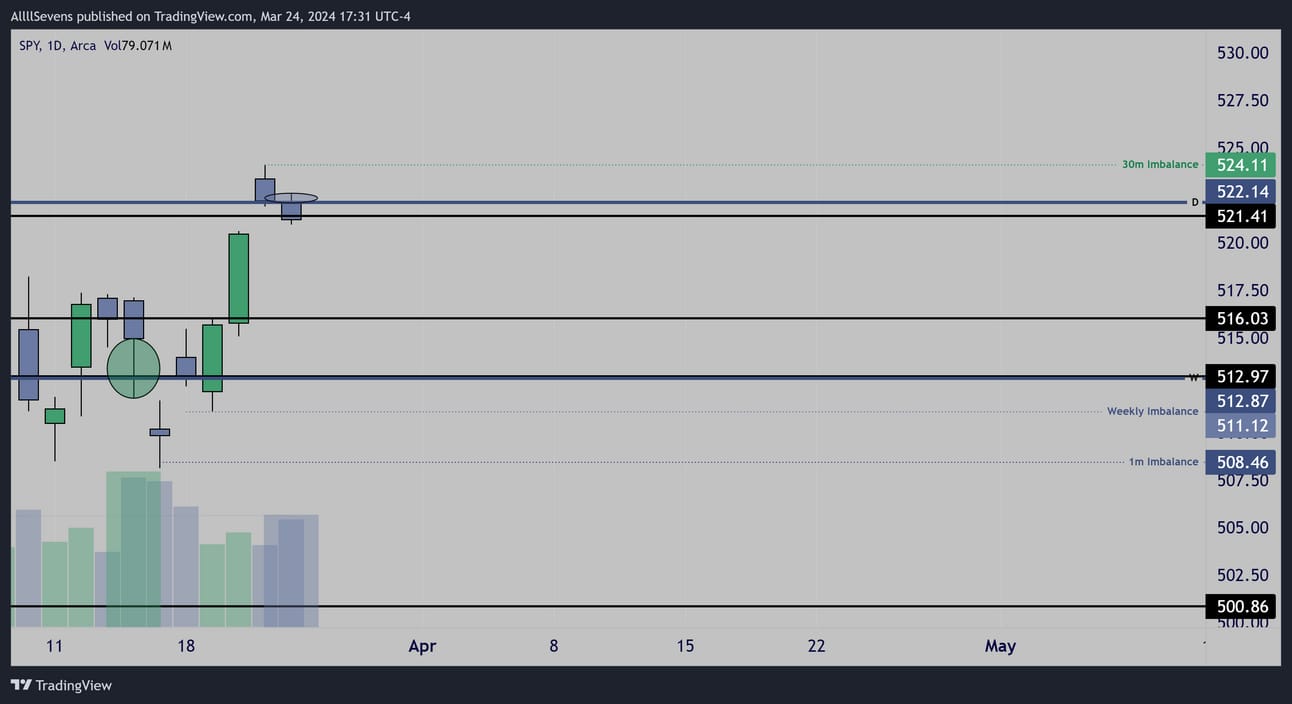
Daily
The Weekly candle shows strong sellers off of $512.87, but the Daily shows the exact opposite. This does not invalidate the weekly sell candle, BUT it does give reason to believe that this $512.87 level could be turned into a bullish pivot.
As of now, I only expect a sideways range to be formed over the coming weeks - I am not calling for a top here, just for a range.
$512.87 could turn into a weekly support. Right now, it’s not and we do have imbalances below this level as low as $508.46
So, on the first touch, I won’t be bearish, but once 508.46 gets hit, I will want to be open to the idea of bulls holding support into the weekly close.
Much like how as long as this week’s candle opens below $522.14 I will expect it to act as resistance into the end of the week-
As long as the following weekly candle’s are opened above $512.87, I will expect it to act as a support by the end of the week.
Unusual Options Flow

$3M 4/19 4965 SPX Puts Bought (Friday)

$2.6M 5/31 510p’s Bought (Friday)
Solid bets.
Conclusion
This week’s candle open is everything.
Below $522.14 and it’s very likely price remains weak into Friday, beginning a decent to $508.46
Above $522.14 and it’s likely that early bears like the flow shown above will get destroyed by another low volume move higher.
Next upside target for me is $532.65
Reply