- AllllSevens
- Posts
- Leverage.
Disclaimer
Before diving into this newsletter, it's important for you to understand a few things: I am extremely passionate about the stock market, but as a 22-year-old who's taken a non-traditional route with no formal education in this field, I am not a certified financial expert. Rather than representing definitive & accurate information, my analysis reflects my personal abstract ideas & opinions that I’ve deemed valid over the last four years.
I aim to provide unique thought-provoking content, but it is crucial to understand that this is not professional advice or a recommendation for action. Investing and trading the stock market involves significant risk, including the potential for total financial loss.
Always conduct your own research or consult with financial professionals before making investment or trading decisions. While I share my insights with enthusiasm and often a tone of certainty, they come with no guarantees.
Preface:
I
Volatility & The S&P500
The UVXY is a leveraged ETF that tracks short-term VIX futures, offering daily exposure with 1.5x leverage. The aim is to profit from increased volatility in the S&P500 or to hedge risk in equity portfolios. It's designed for short-term trading and is not intended as a long-term investment.
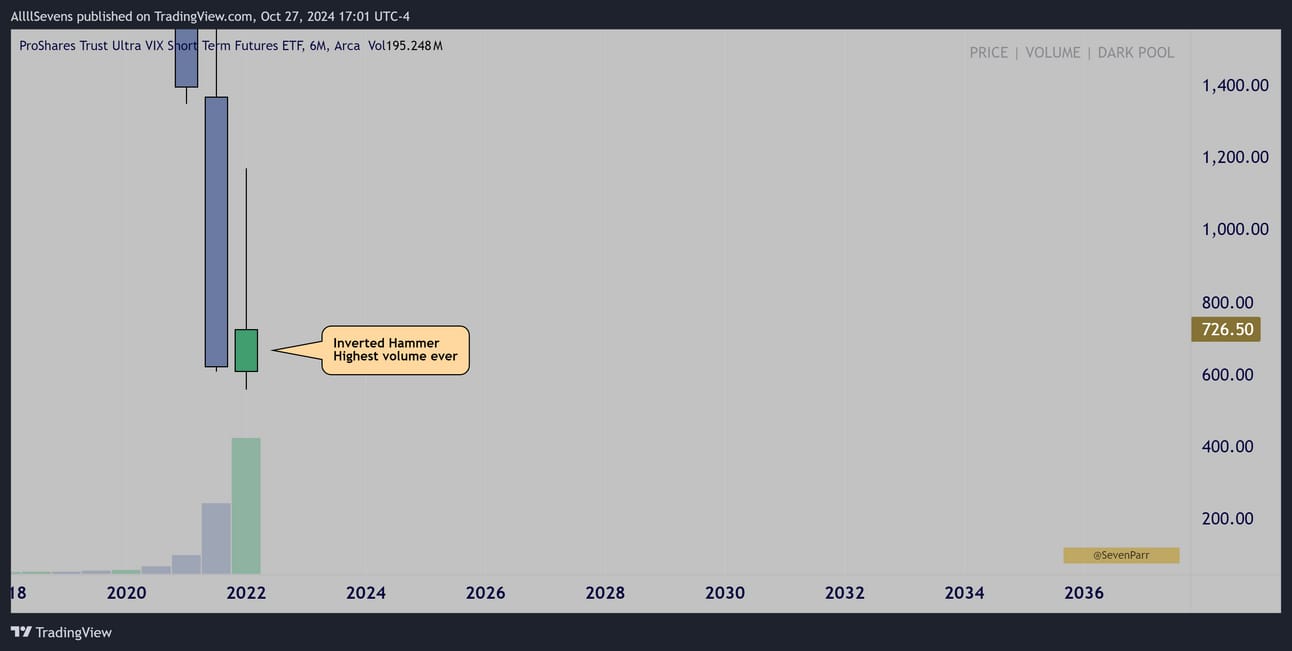
6 Month Interval (2022)
Durin the 2022 SPY correction, UVXY saw it’s highest level of if institutional accumulation ever. Institutions HEDGED their portfolios to the max!
Why?
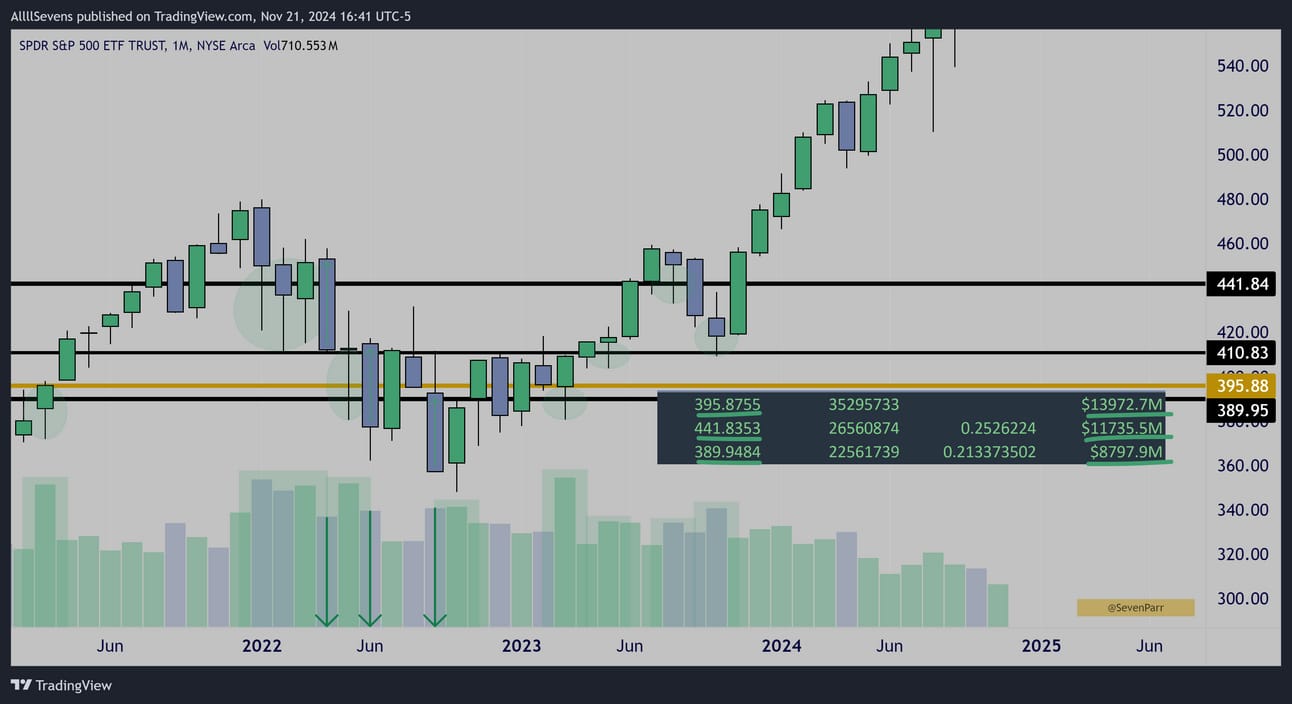
SPY Monthly Interval
Because they were simultaneously accumulating MASSIVE amounts of SPY.
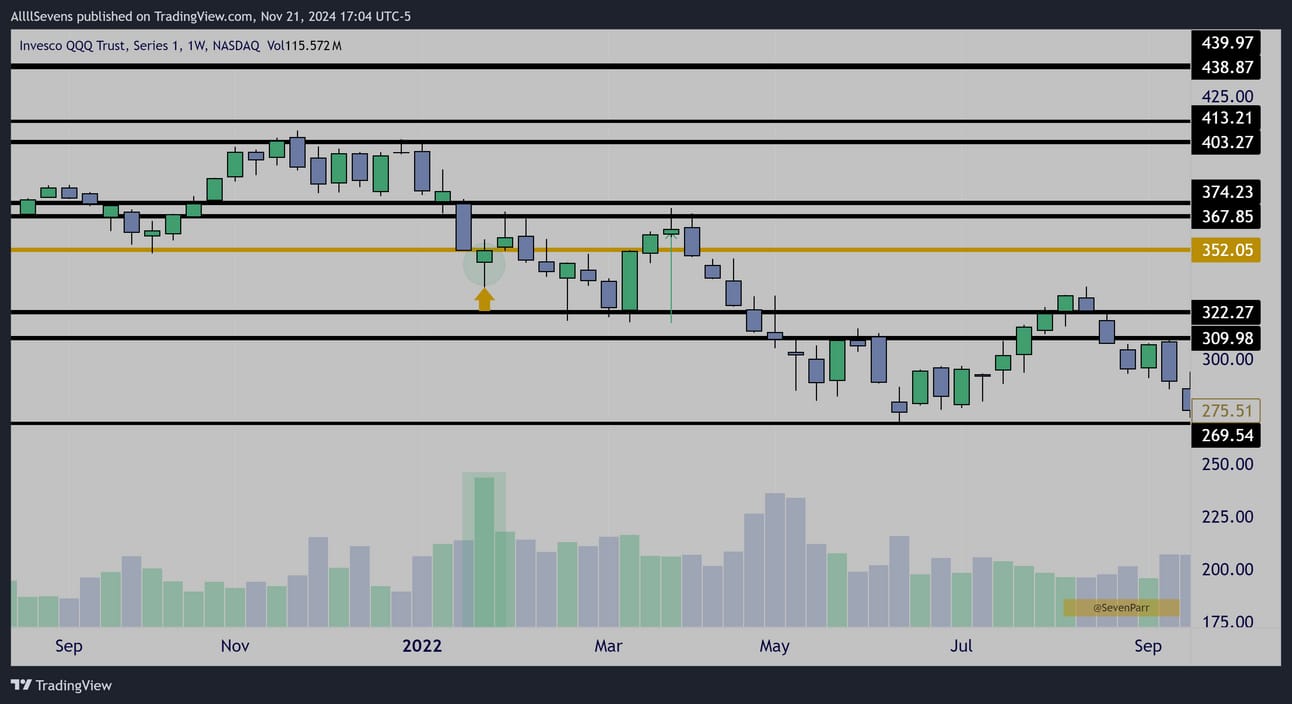
QQQ Weekly Interval (2022)
I also love to point out that the QQQ saw it’s largest weekly accumulation in over a decade during the 2022 ”bear market”.
Where else can you get this type of data?
Not only were the primary indices accumulated, but the sector ETF’s inside were accumulated with HISTORIC volumes- some their largest institutional investments in history, which was the focus of my 3/11/24 newsletter,
The Bull Market Hasn’t Even Began
So much was covered here.
One ETF I missed in that letter was XRT
Read that here if you have not.
What followed these accumulations and a massive UVXY hedge was a -97% decline in UVXY, and a +53% bull market for SPY, as well as large rallies in each of the sectors in that newsletter (except for XBI which remains severely under appreciated and I am still very bullish long-term)
The idea I have been pushing is that this is the Dawn of The Bull Market
We Outsmarted Seasonally Bearish Market Trends in September
And on 9/29/24, we saw The Ultimate Confirmation
Today, I want to once again re-iterate my stance that a HISTORIC bull-run is only JUST BEGINING. This is THE DAWN OF THE BULL MARKET.
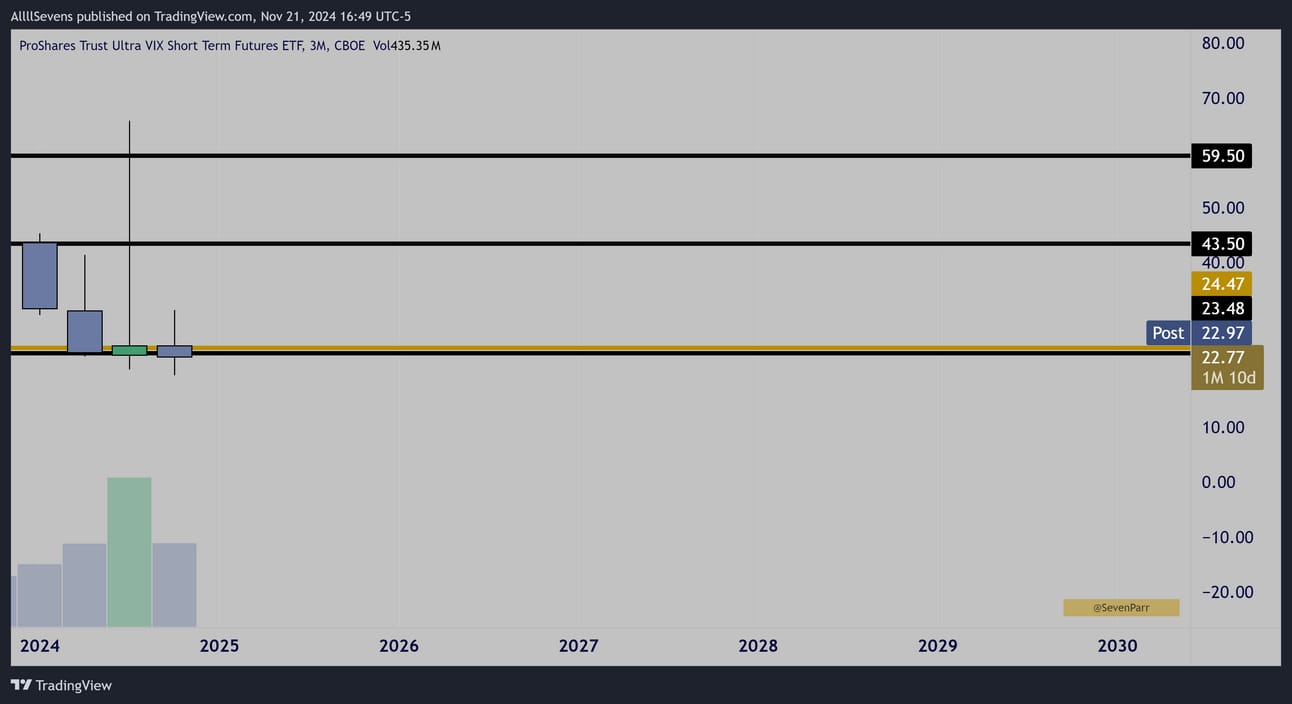
UVXY Quarterly Interval
The same level of hedging that occured in 2022, preceding the current bull market, has just occured on the UVXY over the last quarter-
The VIX itself spiked to levels not seen since major corrections.
Fear reached INSANE levels during the August correction…
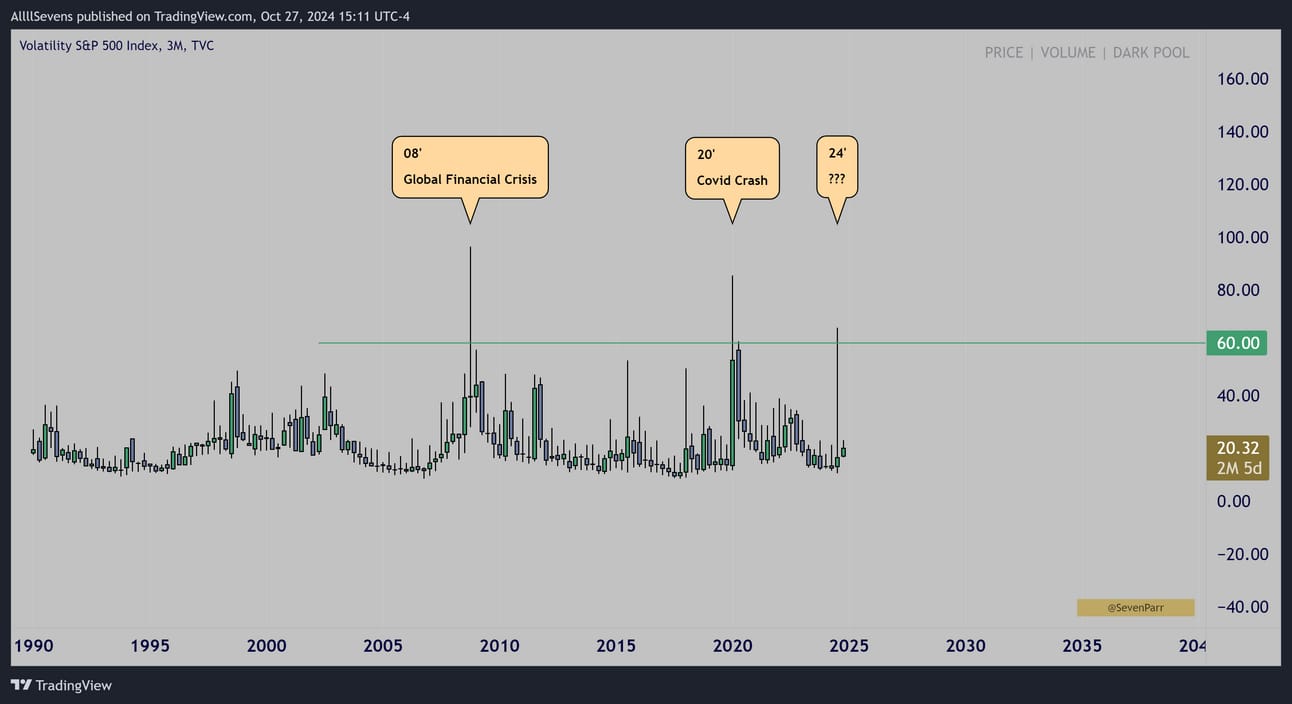
Truly unpresented levels of fear hit the market during August.
But instead of massive SPY accumulations being visible on the monthly chart once again, we are in a completely different market environment and something much more profound has occurred.
SPY Monthly Interval
Very minimal accumulation actually occurred directly into SPY during August.
Read this tweet.
It's so crucial to understand WHY SPY is trading record low volumes.
In 2022, the retail traders who consistently drove prices down on low trading volume between significant institutional accumulations are now, in 2024, the same participants propelling prices upward.
Retail speculators, despite trading in reduced volumes, significantly influence short-term market trends. Many fail to acknowledge this dynamic, leading to a misunderstanding of market movements. There's a common misconception that 'smart money' actively manipulates day-to-day price actions. However, the reality is quite different: institutional investors, or 'smart money,' operate more passively. They accumulate positions not during the frenzies of retail-driven volatility, but strategically when retail investors are selling, thereby capitalizing on mispriced assets during periods of lower demand.
Instead of directly accumulating SPY in their typical fashion-
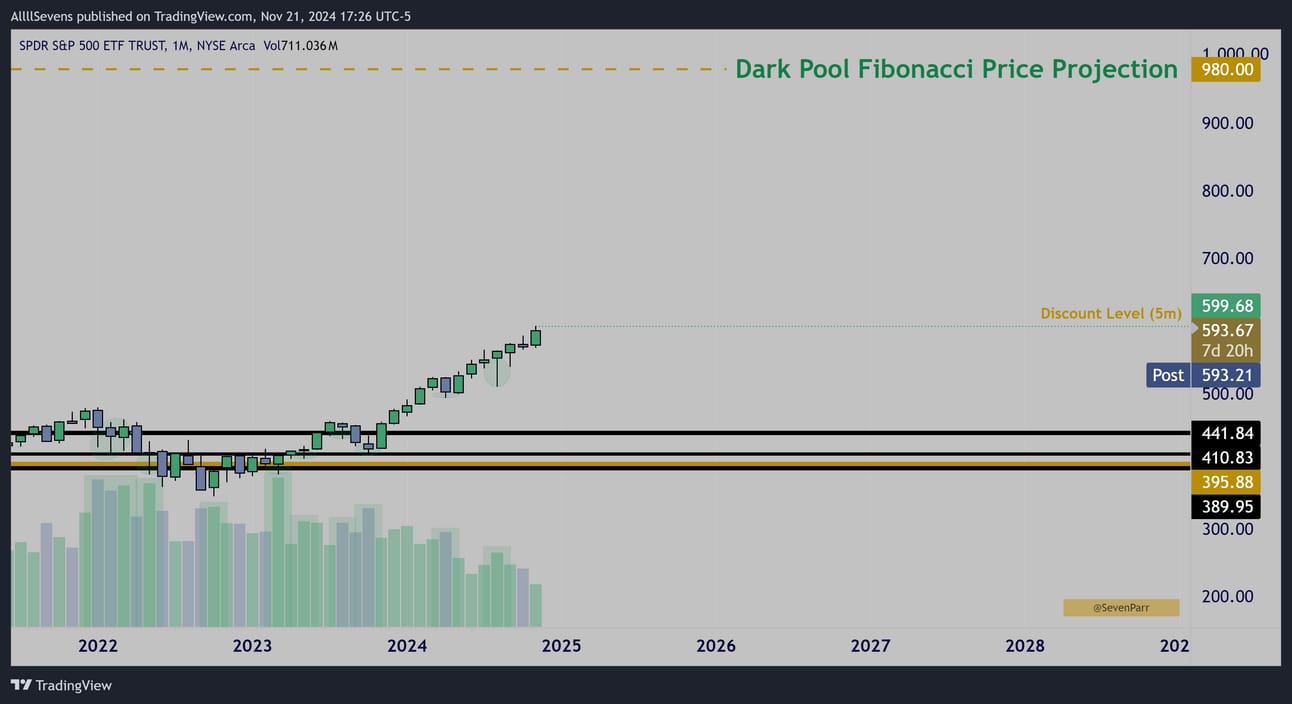
Massive dark pools were executed and accumulated on VOO & IVV
I outlined the INSANE size of the prints in The Ultimate Confirmation
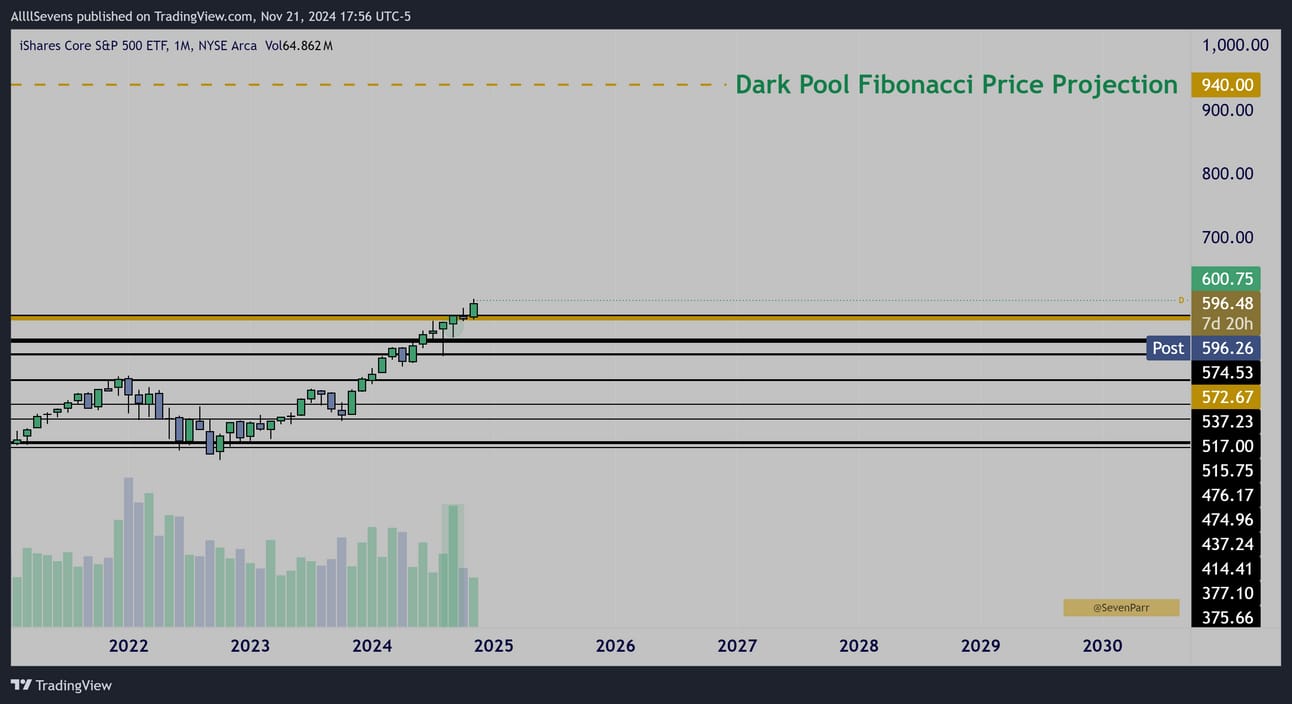
IVV Monthly Interval
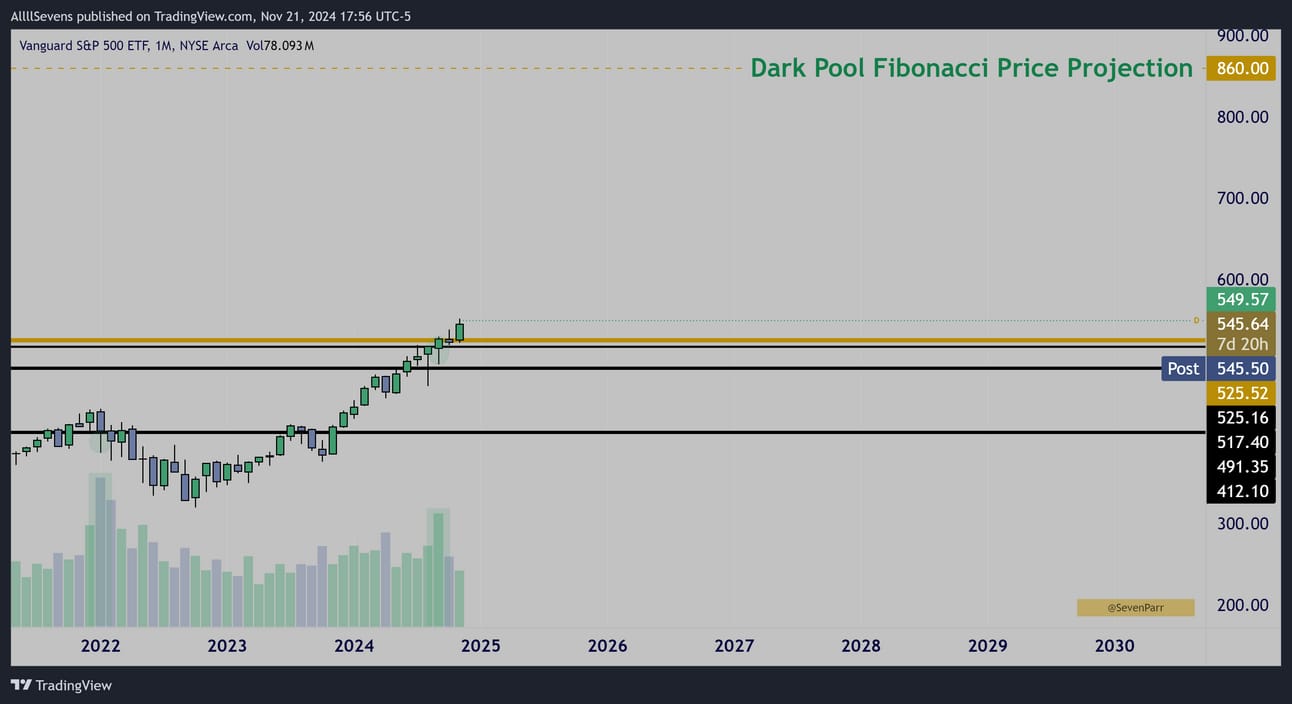
VOO Monthly Interval
I believe the UVXY is once again going to collapse over 90%, and the SPY is going to extend its gains, potentially much more than 58% this time.
VOO & IVV holding these recent dark pools as support is the basis for risk.
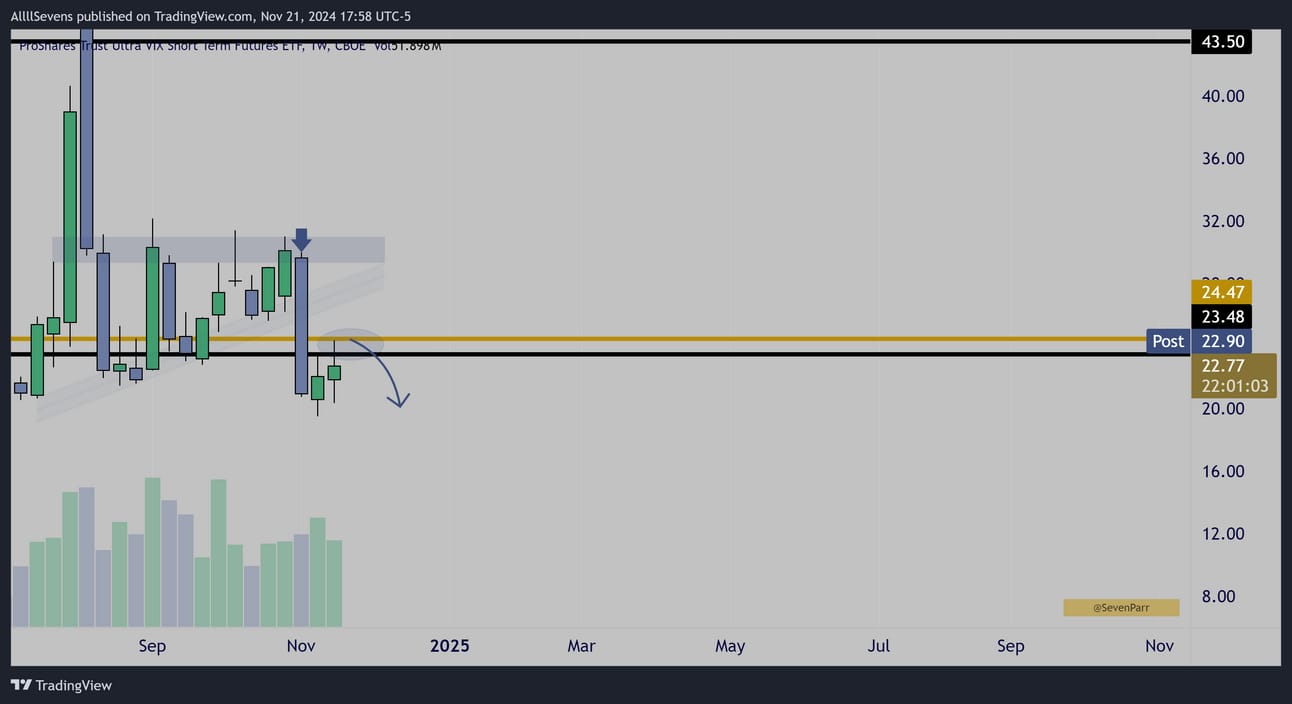
UVXY Weekly Interval
UVXY successfully breaking down and beginning its collapse is also a crucial level to watch to gauge whether my thesis is right or wrong.
If UVXY gets back over these levels, I think it would just mean the market needs some more chop, and I would expect VOO and IVV to accumulate more off their recent DP’s
But if VOO and IVV lose those levels, then I am clearly wrong, and we would discuss that situation when we get there.
As of now, I am max long.
Let’s get to the funky stuff.
If not SPY, what exactly did institutions accumulate during August to justify hedging so heavily with UVXY?
SOXL
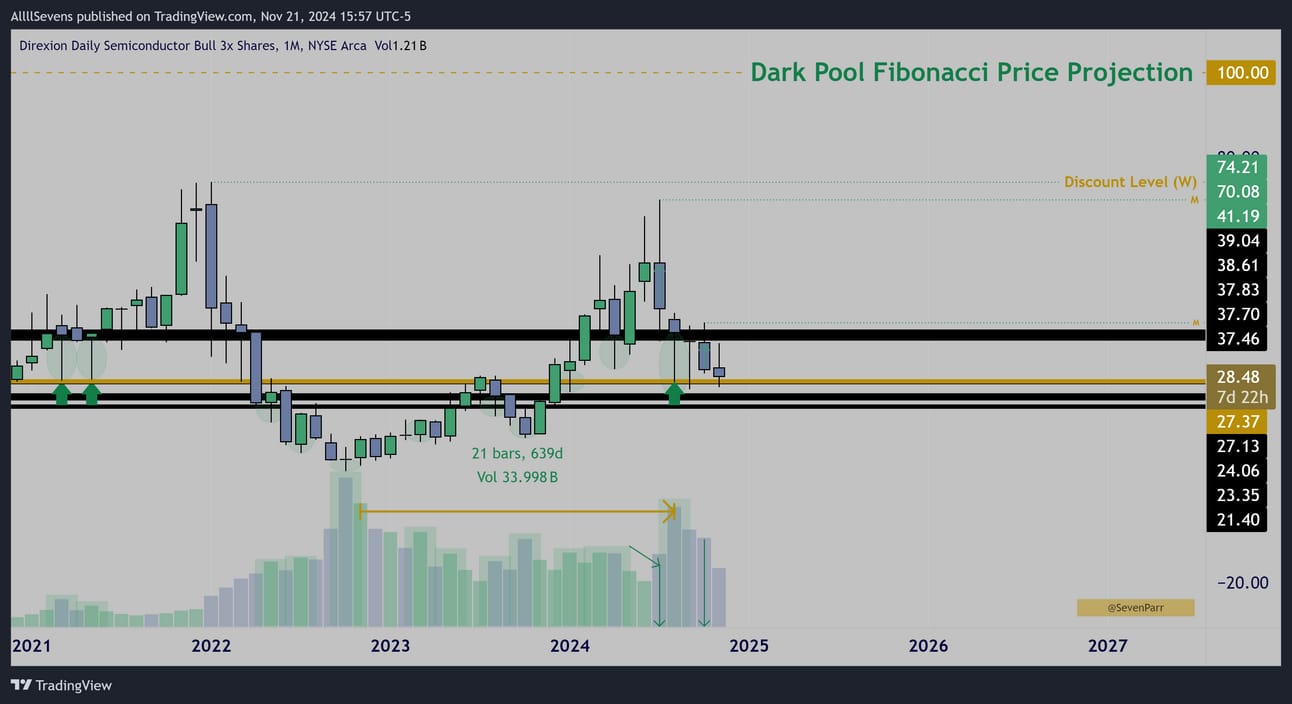
SOXL Monthly Interval
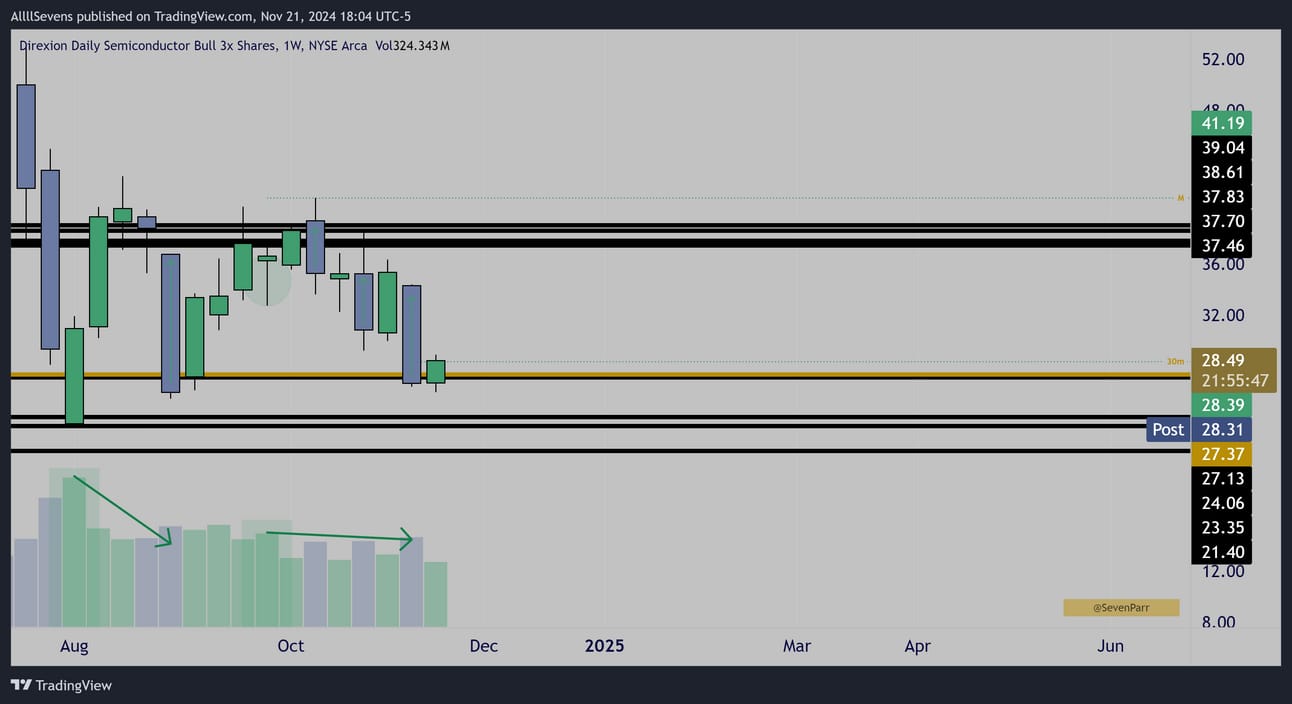
SOXL Weekly Interval
During August, SOXL, a 3x leverage semi-conductor ETF, was accumulated with size not seen since “bear market” lows…
This time, off the largest Dark Pool on record.
Extremely significant institutional accumulation.
For the last few months, RETAIL has sold this off, shown by the large candles down, on decreased volume relative to the August accumulation.
With VIX now attempting to break down, NVDA’s positive earnings report, and price being at the largest Dark Pool on record once again-
I have opened my long position in SOXL targeting $100
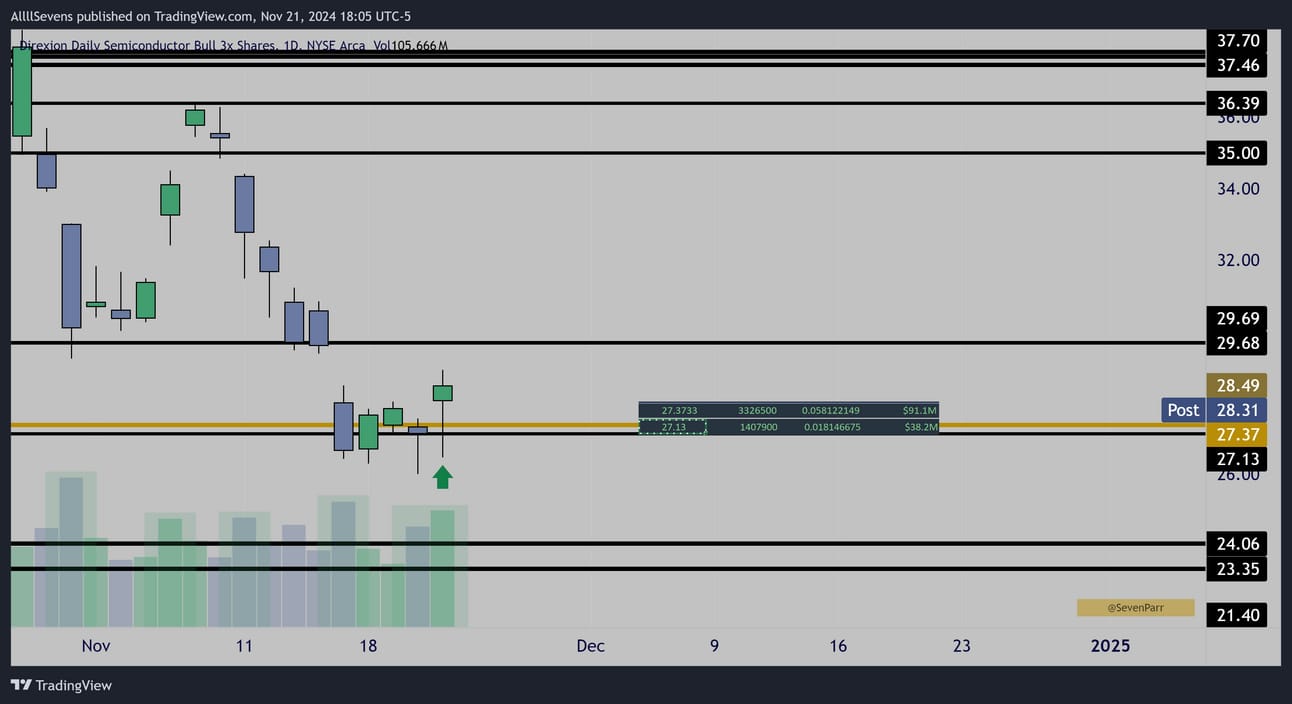
SOXL Daily Interval
This is why I entered specifically today.
Before I move forward, lets take a quick look at NVDA
NVDA has seen large Dark Pool recently as well as A+ flow
See this tweet here.
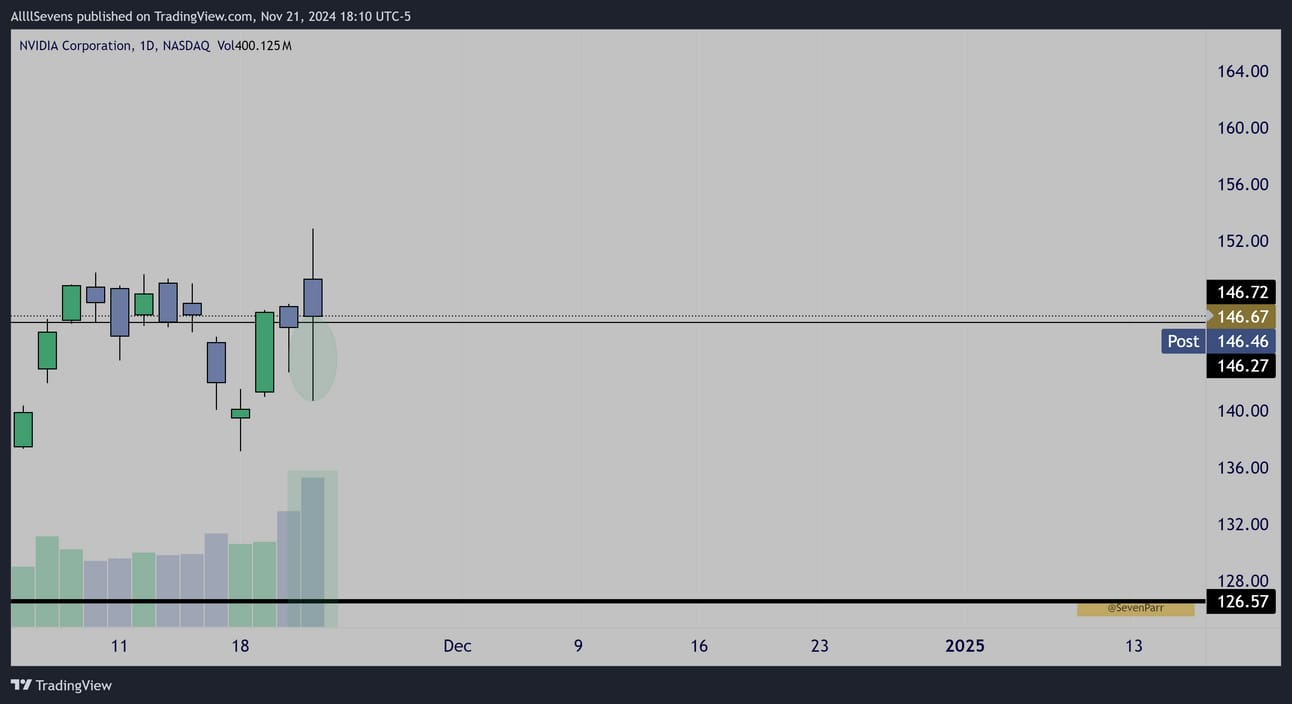
NVDA Daily Interval
Today’s candle shows continued accumulation off this DP
Now, I don’t know for sure if this goes straight up, I just know institutions are STILL buying this “overvalued” stock. Pair this with the SOXL, and I think it is safe to assume this will go higher long-term.
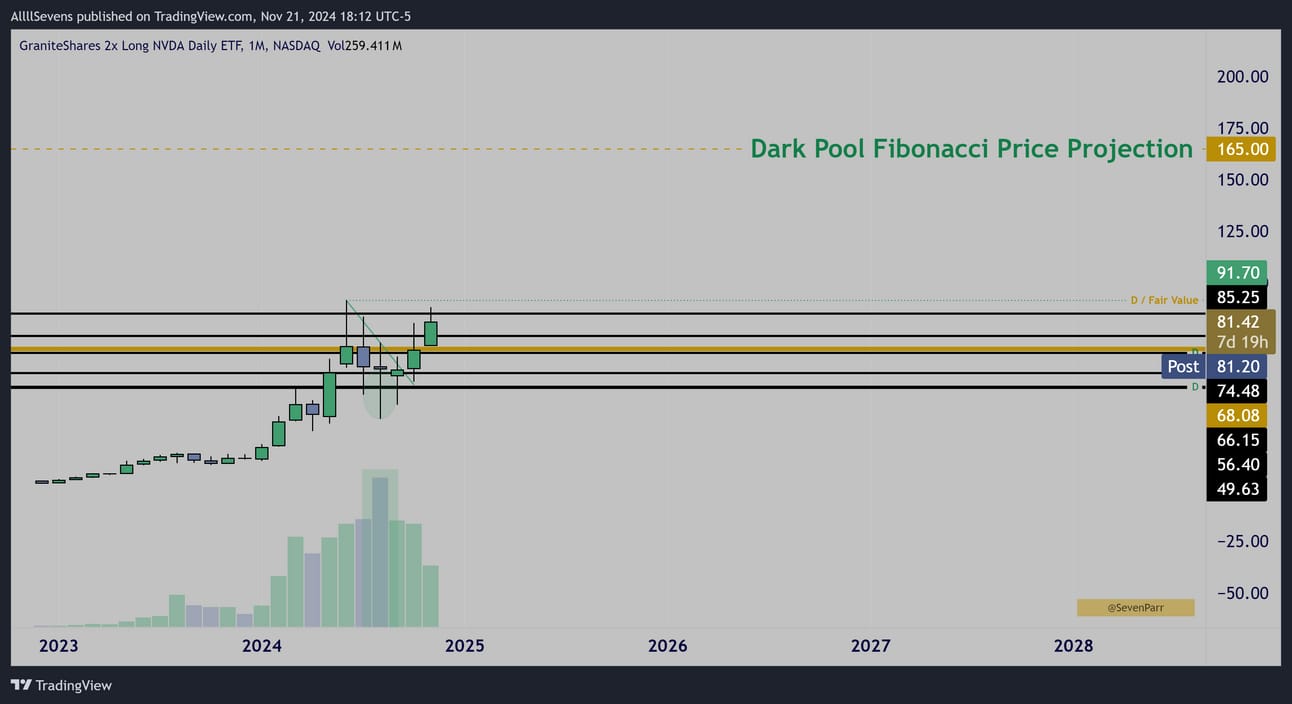
NVDL Monthly Interval
Last but not least, the NVDL, a 2x leveraged NVDA ETF, saw it’s largest amount of institutional accumulation since inception during August.
Not 2 years ago before the stock rallied hundreds of percents-
Now. Just 2 months ago.
I think NVDA has at least 200% more upside in it.
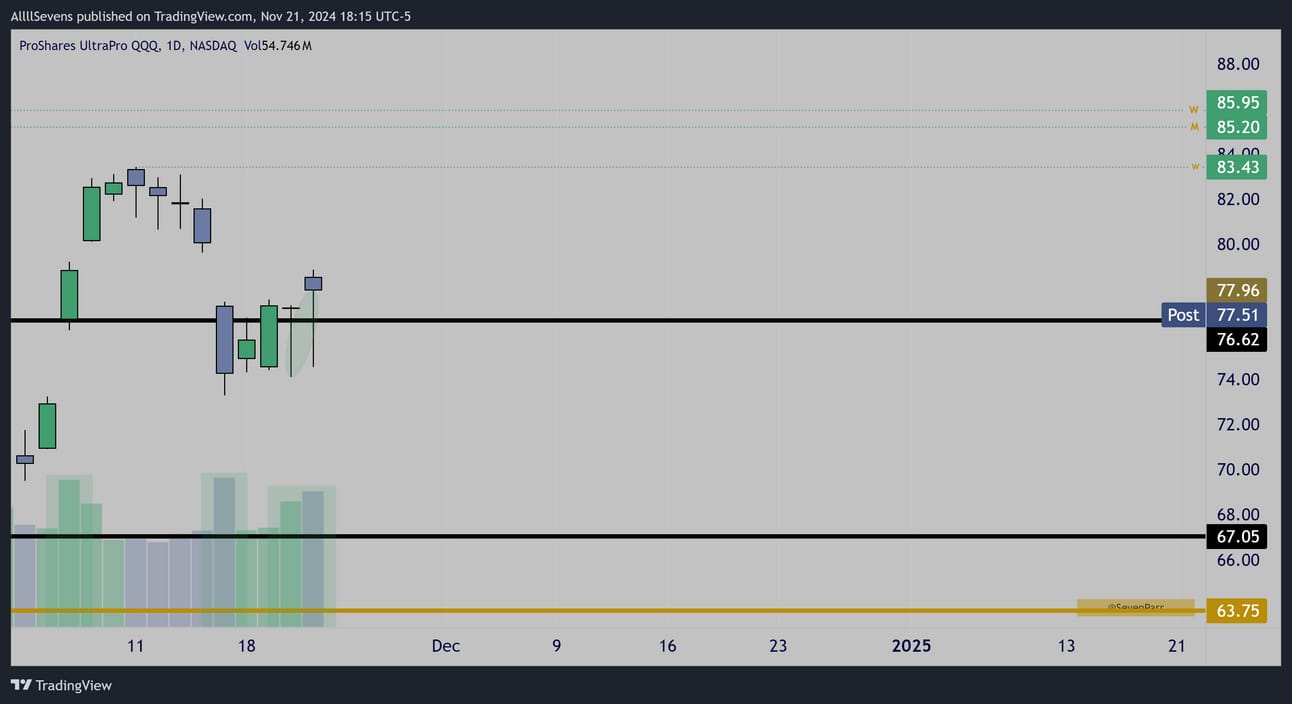
To get this newsletter out at a decent time, I am not going to cover the TQQQ again. I have covered this MANY times now.
See this tweet here.
Look at the last two days candles, showing MORE institutional accumulation directly at dark pool.
And last, but definitely not least, check out this tweet linked below where I outline QQQ’s weekly chart.
This is incredible stuff.
Sign up for my next newsletter here.
Click here to upgrade your subscription for $7.77 and gain access to my Discord as well as future premium newsletters. In Discord, I I share SO MUCH exclusive content and you will see all this research before I write newsletters, and before I post it to twitter. I also take requests, and it is just an amazing place to see first hand, this data being collected and analyzed in real time.
Major stuff there. Please join me!
If you’re interested in tracking dark pool data and unusual options flow yourself, here’s my affiliate link for BlackBoxStocks, the platform I use:
http://staygreen.blackboxstocks.com/SHQh
Find me on DUB! Here.
-Must read disclaimer.
(I will write a more official newsletter promoting what this is soon)
In short, you can view, and even copy my portfolio on this App.
Reply