- AllllSevens
- Posts
- Tesla's Electrifying Long-Term Potential
Tesla's Electrifying Long-Term Potential
Is this the single best stock in the market right now?
Seven Parr
October 10, 2024
Disclaimer
Before you read this newsletter, it is crucial to understand the following:
-Background: I am a 22 year old college dropout with no formal education or professional experience in the fields of finance, investing, or stock market operations.
-Content Nature: All information I share is purely speculative and represents my personal, abstract opinions.
-Take With Caution: Approach the ideas, concepts, and data presented with a healthy dose of skepticism. They should not be considered as definitive or accurate information.
-Not Financial Advice: This content should in no way be interpreted as financial or investment advice. It does not constitute a recommendation to buy, sell, or hold any securities or financial instruments.
-Investment Risk: Investing and trading the stock market involves significant risk, including the potential for substantial financial loss.
-Professional Consultation: Always consult with a licensed financial advisor or perform thorough personal research before making any financial decisions involving the market.
-Liability Disclaimer: I bear no liability for any financial losses that could result from actions taken based on the information provided.
Lastly,
Understand that while I often speak in certainties, no such thing actually exists.
This is all speculation.
Preface:
Tonight at 10 PM Eastern Time is Tesla’s "We, Robot" event.
It will spotlight the much-anticipated reveal of the Tesla robotaxi and be live-streamed on 𝕏 - Here is the link.
This event could be pivotal, focusing on Tesla's transition towards autonomous ride-hailing services and potentially showcasing advancements in their Full Self-Driving technology. While the main attraction is the robotaxi, there may also be other unexpected announcements.
There is an overwhelming skepticism regarding the feasibility and timeline of fully autonomous vehicles as well as the general future of TSLA, seen through the stock’s underperformance for the last two years.
Is it all hype? Or will this stock become the trillion dollar company that both retail and institutional participants are speculating it to be.
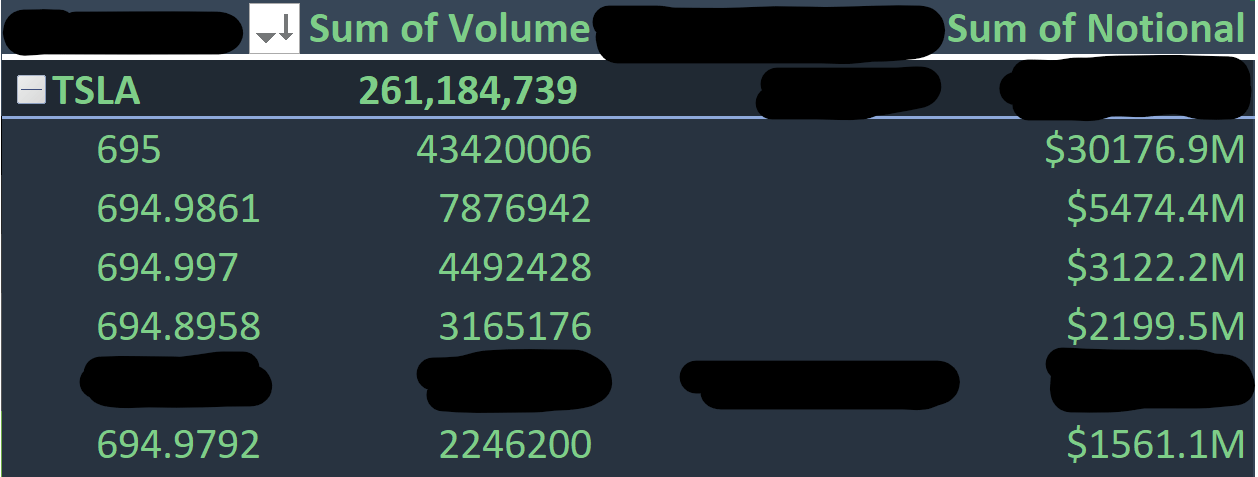
Largest Dark Pools on Record
(Occurred Pre-Split)
Over 180M Institutional Shares concentrated around $231.67
Over $40B notional
This Dark Pool level is larger than ANY other in the entire market over the last four years. Insanely profound.
This tells me that not only is their a retail cult following for this stock…
But, even institutional investors have incredibly abnormal expectations.
TSLA
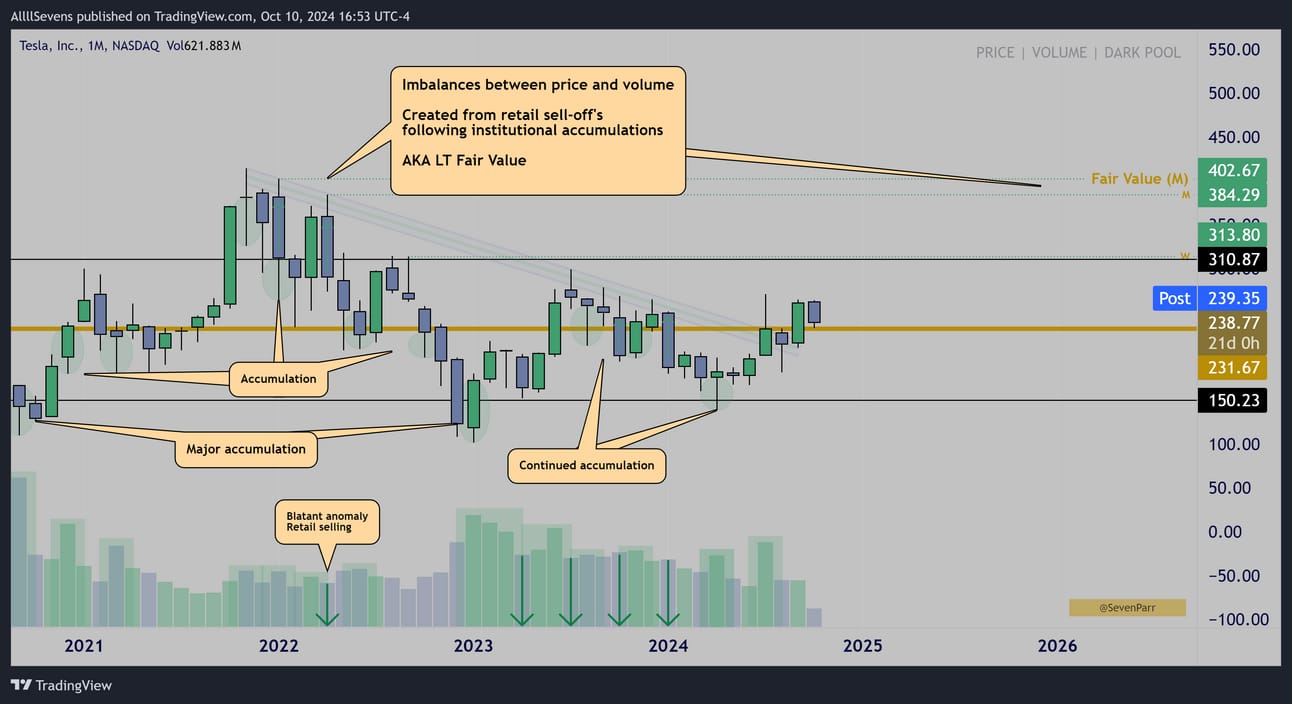
Monthly Interval
It is strikingly clear that institutions are using the and $310.87, $150.23 and most notably the $231.67 Dark Pools to accumulate long-term positions, and retail participants are the only sellers.
TSLA became mispriced as soon as it sold off from 2022 ATH’s
Large candle spreads on decreased volume sold price down and have established significant imbalances between price and volume - or what I consider to be, the “fair value” TSLA @ $402.67 / share.
If TSLA is clearly undervalued and being accumulated by institutions,
WHEN is it going to go up??
In order for price to efficiently enter a bull-market, institutions need to absorb all of retail’s supply. They need to accumulate ALL the shares that retail wants to sell. Until then, price chops, drops, and overall underperforms.
Through a specific pattern in price and volume, called a “Test of Supply” there is actually a way to determine if institutions have completed their campaign and retail is officially ready to start aggressively buying the stock, pushing it higher.
Before I move foreword, please read this tweet: Here
It is important to accept that retail speculators are indeed the drivers of short-term market trends, because institutions are PASSIVE.
——
To find a “Test of Supply”, and determine whether or not institutions have successfully absorbed all the retail sell-pressure for a stock, we need too see a very unique event occur. Price needs to push into a known area of retail sell pressure and high impact “bad” news needs to hit the market. This way, not only does retail sell the same known resistance they have been selling, but they do so in a more aggressive & emotional manner. This ensures that anyone who wants to sell the stock, is enticed to fully sell the stock.
Institutions buy this dip of course, continuing their accumulation campaign, and it creates a long lower wick hanging from resistance.
Depending on how much retail sell pressure there was, this wick will have a lot of volume or not a lot of volume.
If a high volume wick is created, it means there is still a ton of sell pressure in the market and more shares needed to be accumulated before an efficient rally.
If a low volume wick is created, it means that the retail sell pressure was minimal.
Even from a well-known resistance, with bad news dropped, institutions did not need to buy many shares to bring price back and create a wick.
The test was successful, and over this resistance, a bull-market can begin.
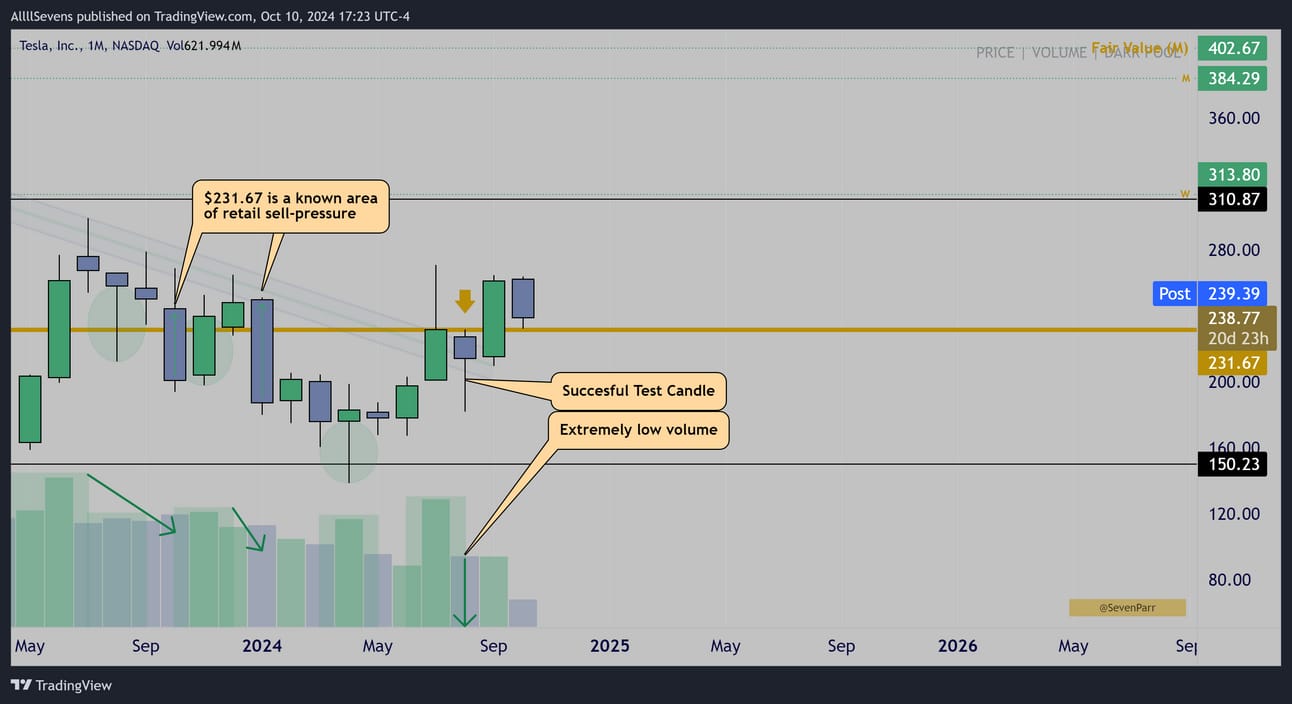
Monthly Interval
In August we had our news event at a well-known area of retail sell pressure:
A weaker than expected jobs report followed by the unwind of the Japanese-yen carry trade directly at the $231.67 dark pool that retail sold heavily in late 2023 and the first month of this year. January’s candle specifically, was MASSIVE!
And look at the volume. Nothing stand-out. Retail driven.
Price flushed hard, breaking the prior month’s low and losing the $200 psychological support. Institutions, but mostly retail, shown by the low volume, bought the dip to create a lower wick signifying there is no more sell-pressure.
TSLA passed the “Test of Supply”
Over this resistance, $231.67 and efficient bull-market can begin.
Understand how RARE this pattern is.
It is a completely random and coincidental event that gives us an extremely high conviction insight as to what’s happening internally to a stock.
Let’s move onto my favorite part of this setup.
I could have spared you my conspiracy theory test of supply thesis and only shown you the chart below.
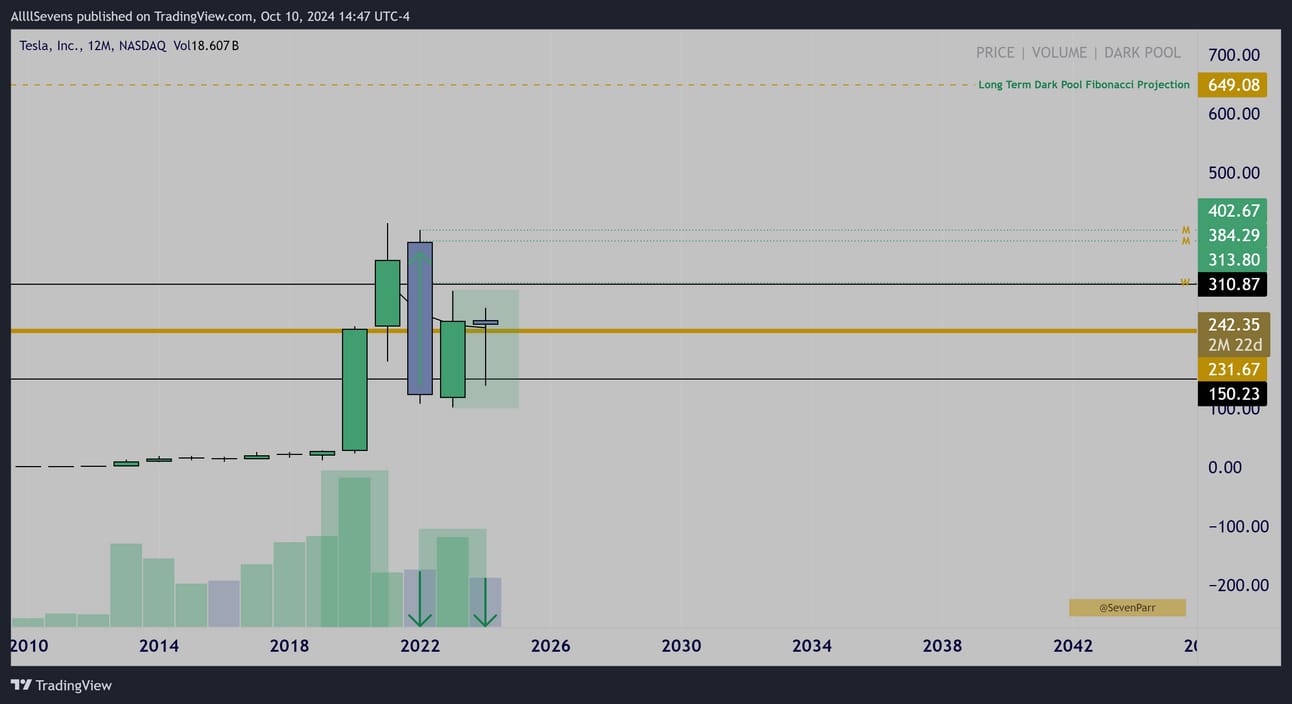
Yearly Interval
2020: Highest volume and largest candle ever impulses price to $231.67 showing an institutional buy presence.
2022: New largest candle ever dumps price below this level…
On decreased volume. An extreme anomaly.
The institutional participants who previously pushed price up, did not participate in this sell-off, or volume would have matched the move. It was retail driven.
2023: Increased volume impulse brings price back over $231.67, once again showing an institutional buy presence.
2024: Price consolidates for the entire year on low volume and has began to stabilized over $231.67 as well as the ATH AVWAP (black moving average)
This further signifies that the retail sell presence has drastically decreased and they are now respecting the $40B dark pool support at $231.67, as well as showing signs of an uptrend in development holding over the ATH AVWAP
This YEARLY pattern is THE core of this thesis.
Last time I presented a successful test of supply pattern, it was in late January of this year, for the Daily chart of the $SPY
Check out the newsletters I wrote Here & Here for reference.
This pattern, on a DAILY time frame, lead to a multi-month year long rally.
If I am correct on TSLA seeing this pattern on a MONTHLY time frame, it should lead to a multi-year decade long rally. My long-term projection is on the chart above around $650 /share. This is subject to upgrades over time and as a bull-market truly develops.
BONUS
This same monthly pattern is on IWM, which I made a video about: Here
Notice, in both the SPY pattern months ago but more so the IWM pattern LIVE right now, price actually needs OVER resistance to begin the bull run.
SPY chopped below res for a few days after it’s test. THEN, broke out and boom rallied for an entire year.
IWM has chopped for an entire month now. What we have is confirmation that when the resistance above does gets broke, there should be no sell pressure.
A decade long bull run should ensue.
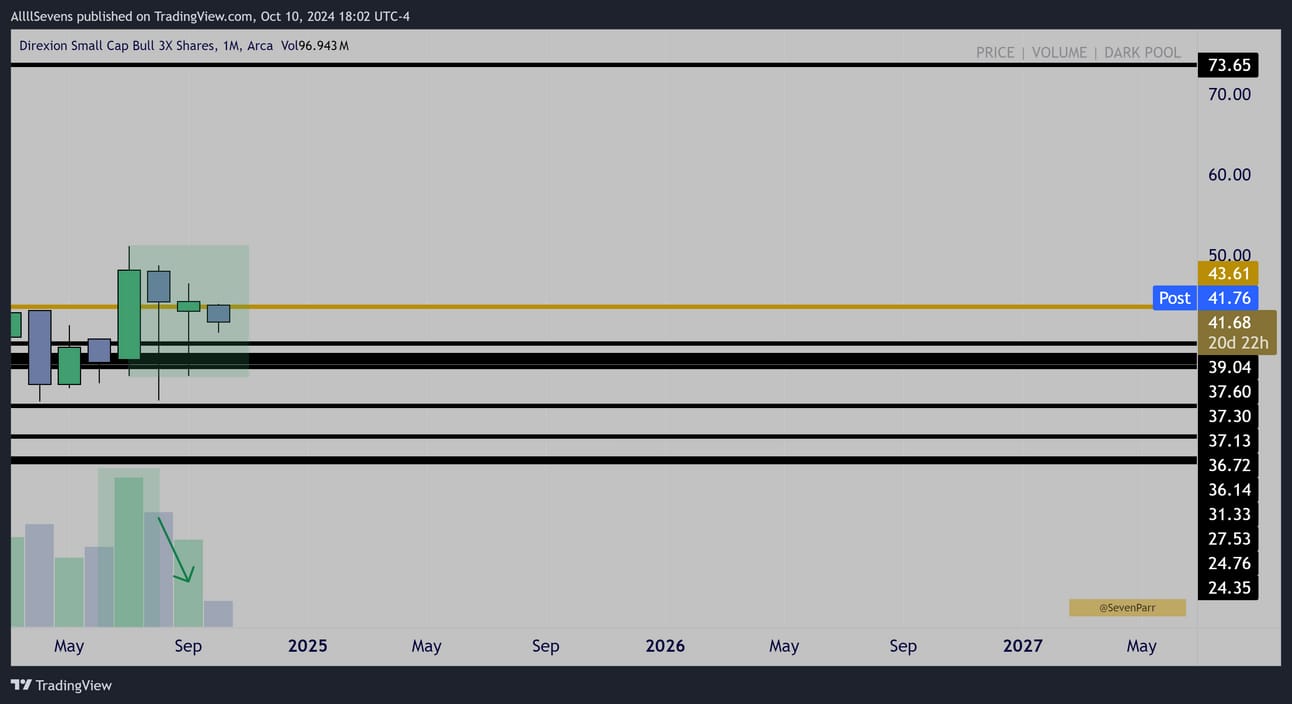
TNA Monthly Interval
This is the 3x leverage IWM, in a bullish consolidation over it’s largest Dark Pool on record. This really adds to the explosive potential behind IWM when it clears $230 and TNA starts pumping out of this compression.
TSLA is very unique in this sense because it passed the test, and has since broke over resistance. There’s nothing else to wait on like IWM
This is why I’m taking the risk of going long before the event this evening. I feel this could be exactly what’s needed to spark some smooth trend. I believe TSLA is beginning a multi-year bull market. Right now.
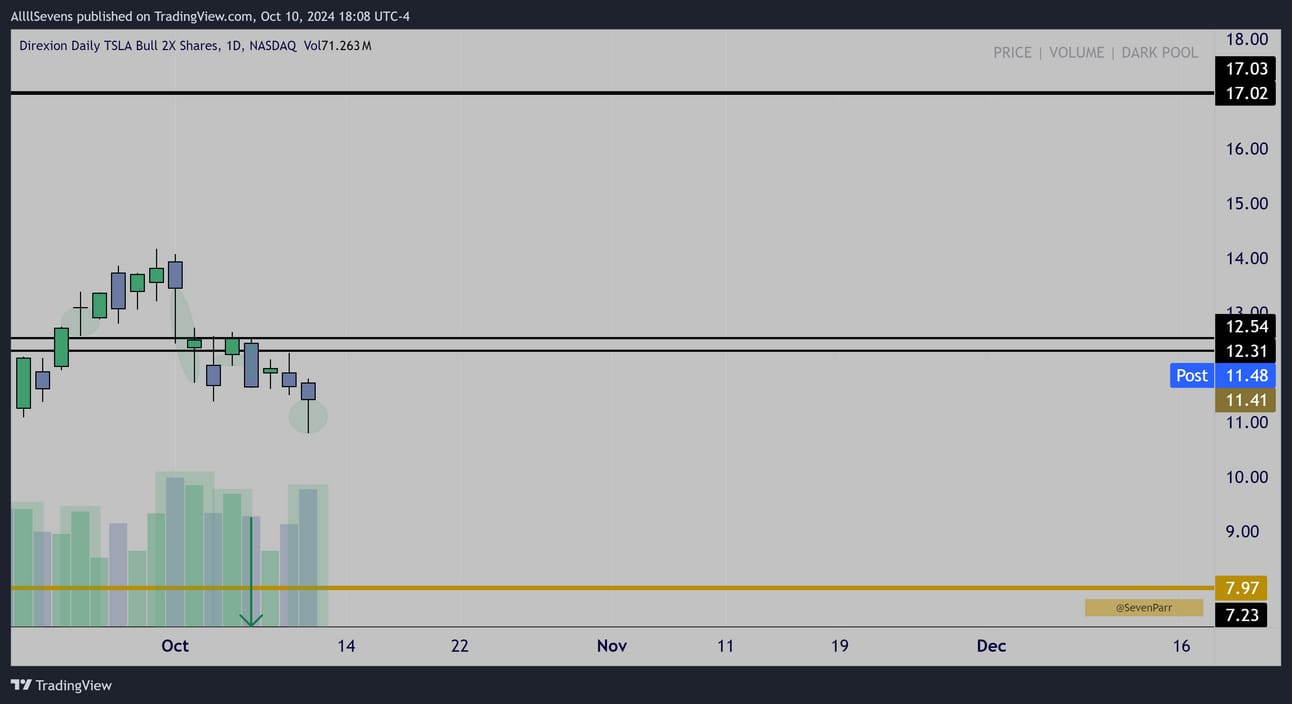
TSLL Daily
Speaking of leverage, this is the 2x TSLA ETF
It shows some glaring accumulation at these this $12.30-$12.50 DP cluster.
This could be a great area to gauge momentum in the coming sessions.
Like I said previously, this “test candle” pattern is EXTREMELY rare.
When TSLL breaks over this level, I will 100% be adding leverage to my TSLA position through the TSLL, that is how confident I am in this pattern.
One las thing.
In my newsletter, The Dawn of The Bull Market I discuss the XLY and I have made an extreme emphasis on this sector through my twitter posts, expressing how unique and substantial the accumulation for this specific sector is.
Video link: Here
TSLA is the #2 holding in this sector.
Sign up for my next newsletter here.
It’s 100% free.
Make sure you follow me on X.
If you truly find value in my work, and respect the time I put into these, please consider upgrading your free subscription to AllllSevens+ for just $7.77 per month. Click here to upgrade.
Premium content:
AAPL
LYFT
JD
NIO
More premium content is coming, specifically on the China Stock Market.
Upon upgrading, you will also get access to my Discord where I gather and collect my data throughout the week. It is NOT an alert service.
I take chart requests at any time in my Discord!
Find me on DUB! Here.
-Must read disclaimer.
(I will write a more official newsletter promoting what this is soon)
If you’re interested in tracking dark pool data and unusual options flow yourself, here’s my affiliate link for BlackBoxStocks, the platform I use:
http://staygreen.blackboxstocks.com/SHQh
Lastly, if you’re looking for a Brokerage to trade stocks & options, here’s my referral link for Webull. They give you (and me) free stocks when you make an account and deposit money with this link:
https://a.webull.com/Nwcp9cTCDSzfJtjWL4
Reply